Python绘制3D地图,做出来效果太酷炫啦~
这期主要介绍3D地图,
还是比较神奇的,
下面让我们一起来学习吧
![]()
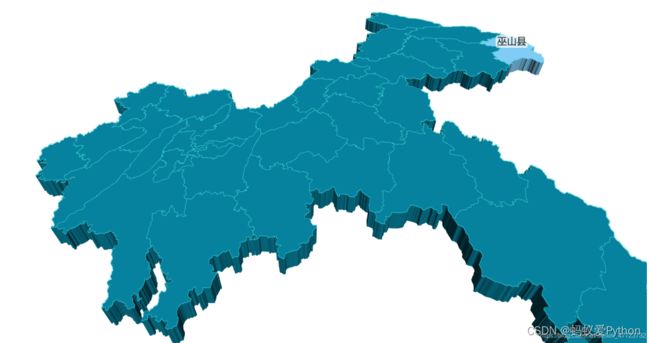
01. 重庆市3D地图
from pyecharts import options as opts
from pyecharts.charts import Map3D
from pyecharts.globals import ChartType
# 经纬度
example_data = [
    [[119.107078, 36.70925, 1000], [116.587245, 35.415393, 1000]],
    [[117.000923, 36.675807], [120.355173, 36.082982]],
    [[118.047648, 36.814939], [118.66471, 37.434564]],
    [[121.391382, 37.539297], [119.107078, 36.70925]],
    [[116.587245, 35.415393], [122.116394, 37.509691]],
    [[119.461208, 35.428588], [118.326443, 35.065282]],
    [[116.307428, 37.453968], [115.469381, 35.246531]],
]
c = (
    Map3D(init_opts=opts.InitOpts(width="1400px", height="700px"))
    .add_schema(
        maptype="重庆",
        itemstyle_opts=opts.ItemStyleOpts(
            color="rgb(5,101,123)",
            opacity=1,
            border_width=0.8,
            border_color="rgb(62,215,213)",
        ),
        light_opts=opts.Map3DLightOpts(
            main_color="#fff",
            main_intensity=1.2,
            is_main_shadow=False,
            main_alpha=55,
            main_beta=10,
            ambient_intensity=0.3,
        ),
        view_control_opts=opts.Map3DViewControlOpts(center=[-10, 0, 10]),
        post_effect_opts=opts.Map3DPostEffectOpts(is_enable=False),
    )
    .add(
        series_name="",
        data_pair=example_data,
        type_=ChartType.LINES3D,
        effect=opts.Lines3DEffectOpts(
            is_show=True,
            period=4,
            trail_width=3,
            trail_length=0.5,
            trail_color="#f00",
            trail_opacity=1,
        ),
        linestyle_opts=opts.LineStyleOpts(is_show=False, color="#fff", opacity=0),
    )
    .set_global_opts(title_opts=opts.TitleOpts(title="Map3D"))
    .render("区县3D地图.html")
)
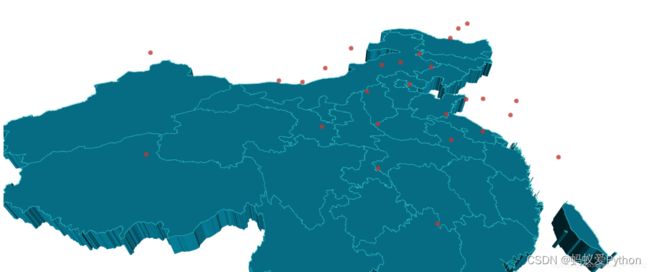
02 中国3D地图一
数组里面分别代表:经纬度,数值。
from pyecharts import options as opts
from pyecharts.charts import Map3D
from pyecharts.globals import ChartType
from pyecharts.commons.utils import JsCode

example_data = [
    ("黑龙江", [127.9688, 45.368, 100]),
    ("内蒙古", [110.3467, 41.4899, 100]),
    ("吉林", [125.8154, 44.2584, 100]),
    ("辽宁", [123.1238, 42.1216, 100]),
    ("河北", [114.4995, 38.1006, 100]),
    ("天津", [117.4219, 39.4189, 100]),
    ("山西", [112.3352, 37.9413, 100]),
    ("陕西", [109.1162, 34.2004, 100]),
    ("甘肃", [103.5901, 36.3043, 100]),
    ("宁夏", [106.3586, 38.1775, 100]),
    ("青海", [101.4038, 36.8207, 100]),
    ("新疆", [87.9236, 43.5883, 100]),
    ("西藏", [91.11, 29.97, 100]),
    ("四川", [103.9526, 30.7617, 100]),
    ("重庆", [108.384366, 30.439702, 100]),
    ("山东", [117.1582, 36.8701, 100]),
    ("河南", [113.4668, 34.6234, 100]),
    ("江苏", [118.8062, 31.9208, 100]),
    ("安徽", [117.29, 32.0581, 100]),
    ("湖北", [114.3896, 30.6628, 100]),
    ("浙江", [119.5313, 29.8773, 100]),
    ("福建", [119.4543, 25.9222, 100]),
    ("江西", [116.0046, 28.6633, 100]),
    ("湖南", [113.0823, 28.2568, 100]),
    ("贵州", [106.6992, 26.7682, 100]),
    ("广西", [108.479, 23.1152, 100]),
    ("海南", [110.3893, 19.8516, 100]),
    ("上海", [121.4648, 31.2891, 100]),
]

c = (
    Map3D(init_opts=opts.InitOpts(width="1400px", height="700px"))
    .add_schema(
        itemstyle_opts=opts.ItemStyleOpts(
            color="rgb(5,101,123)",
            opacity=1,
            border_width=0.8,
            border_color="rgb(62,215,213)",
        ),
        map3d_label=opts.Map3DLabelOpts(
            is_show=False,
            formatter=JsCode("function(data){return data.name + " " + data.value[2];}"),
        ),
        emphasis_label_opts=opts.LabelOpts(
            is_show=False,
            color="#fff",
            font_size=10,
            background_color="rgba(0,23,11,0)",
        ),
        light_opts=opts.Map3DLightOpts(
            main_color="#fff",
            main_intensity=1.2,
            main_shadow_quality="high",
            is_main_shadow=False,
            main_beta=10,
            ambient_intensity=0.3,
        ),
    )
    .add(
        series_name="Scatter3D",
        data_pair=example_data,
        type_=ChartType.SCATTER3D,
        bar_size=1,
        shading="lambert",
        label_opts=opts.LabelOpts(
            is_show=False,
            formatter=JsCode("function(data){return data.name + ' ' + data.value[2];}"),
        ),
    )
    .set_global_opts(title_opts=opts.TitleOpts(title="Map3D"))
    .render("中国3D地图.html")
)
03 中国3D地图二
如果说前面的那个你看起来不太舒服,
那么这个绝对适合做数据可视化展示哟!
from pyecharts import options as opts
from pyecharts.charts import Map3D
from pyecharts.globals import ChartType
from pyecharts.commons.utils import JsCode

example_data = [
    ("黑龙江", [127.9688, 45.368, 100]),
    ("内蒙古", [110.3467, 41.4899, 300]),
    ("吉林", [125.8154, 44.2584, 300]),
    ("辽宁", [123.1238, 42.1216, 300]),
    ("河北", [114.4995, 38.1006, 300]),
    ("天津", [117.4219, 39.4189, 300]),
    ("山西", [112.3352, 37.9413, 300]),
    ("陕西", [109.1162, 34.2004, 300]),
    ("甘肃", [103.5901, 36.3043, 300]),
    ("宁夏", [106.3586, 38.1775, 300]),
    ("青海", [101.4038, 36.8207, 300]),
    ("新疆", [87.9236, 43.5883, 300]),
    ("西藏", [91.11, 29.97, 300]),
    ("四川", [103.9526, 30.7617, 300]),
    ("重庆", [108.384366, 30.439702, 300]),
    ("山东", [117.1582, 36.8701, 300]),
    ("河南", [113.4668, 34.6234, 300]),
    ("江苏", [118.8062, 31.9208, 300]),
    ("安徽", [117.29, 32.0581, 300]),
    ("湖北", [114.3896, 30.6628, 300]),
    ("浙江", [119.5313, 29.8773, 300]),
    ("福建", [119.4543, 25.9222, 300]),
    ("江西", [116.0046, 28.6633, 300]),
    ("湖南", [113.0823, 28.2568, 300]),
    ("贵州", [106.6992, 26.7682, 300]),
    ("广西", [108.479, 23.1152, 300]),
    ("海南", [110.3893, 19.8516, 300]),
    ("上海", [121.4648, 31.2891, 1300]),
]

c = (
    Map3D(init_opts=opts.InitOpts(width="1400px", height="700px"))
    .add_schema(
        itemstyle_opts=opts.ItemStyleOpts(
            color="rgb(5,101,123)",
            opacity=1,
            border_width=0.8,
            border_color="rgb(62,215,213)",
        ),
        map3d_label=opts.Map3DLabelOpts(
            is_show=False,
            formatter=JsCode("function(data){return data.name + " " + data.value[2];}"),
        ),
        emphasis_label_opts=opts.LabelOpts(
            is_show=False,
            color="#fff",
            font_size=10,
            background_color="rgba(0,23,11,0)",
        ),
        light_opts=opts.Map3DLightOpts(
            main_color="#fff",
            main_intensity=1.2,
            main_shadow_quality="high",
            is_main_shadow=False,
            main_beta=10,
            ambient_intensity=0.3,
        ),
    )
    .add(
        series_name="数据",
        data_pair=example_data,
        type_=ChartType.BAR3D,
        bar_size=1,
        shading="lambert",
        label_opts=opts.LabelOpts(
            is_show=False,
            formatter=JsCode("function(data){return data.name + ' ' + data.value[2];}"),
        ),
    )
    .set_global_opts(title_opts=opts.TitleOpts(title="城市数据"))
    .render("带有数据展示地图.html")
)
看完直呼这个模板,适合做城市之间的数据对,同时也展示了经纬度。
04 中国3D地图三
 from pyecharts import options as opts
from pyecharts.charts import Map3D
from pyecharts.globals import ChartType

c = (
    Map3D(init_opts=opts.InitOpts(width="1400px", height="700px"))
    .add_schema(
        itemstyle_opts=opts.ItemStyleOpts(
            color="rgb(5,101,123)",
            opacity=1,
            border_width=0.8,
            border_color="rgb(62,215,213)",
        ),
        map3d_label=opts.Map3DLabelOpts(
            is_show=True,
            text_style=opts.TextStyleOpts(
                color="#fff", font_size=16, background_color="rgba(0,0,0,0)"
            ),
        ),
        emphasis_label_opts=opts.LabelOpts(is_show=True),
        light_opts=opts.Map3DLightOpts(
            main_color="#fff",
            main_intensity=1.2,
            is_main_shadow=False,
            main_alpha=55,
            main_beta=10,
            ambient_intensity=0.3,
        ),
    )
    .add(series_name="", data_pair="", maptype=ChartType.MAP3D)
    .set_global_opts(
        title_opts=opts.TitleOpts(title="全国行政区划地图-Base"),
        visualmap_opts=opts.VisualMapOpts(is_show=False),
        tooltip_opts=opts.TooltipOpts(is_show=True),
    )
    .render("全国标签地图.html")
)
05 地球展示
import pyecharts.options as opts
from pyecharts.charts import MapGlobe
from pyecharts.faker import POPULATION

data = [x for _, x in POPULATION[1:]]
low, high = min(data), max(data)

c = (
    MapGlobe(init_opts=opts.InitOpts(width="1400px", height="700px"))
    .add_schema()
    .add(
        maptype="world",
        series_name="World Population",
        data_pair=POPULATION[1:],
        is_map_symbol_show=False,
        label_opts=opts.LabelOpts(is_show=False),
    )
    .set_global_opts(
        visualmap_opts=opts.VisualMapOpts(
            min_=low,
            max_=high,
            range_text=["max", "min"],
            is_calculable=True,
            range_color=["lightskyblue", "yellow", "orangered"],
        )
    )
    .render("地球.html")
)
可以缩放定位到每一个区域,
但是其实我们在日常生活中可能用不上,如果要用可以去百度地图展示效果。
资料安装包什么的都可以 点击文章末尾的名片 找管理获取~
end
好了本期地图专栏系列就到这里了,我们下期文章再会!
喜欢的话记得给小编个三连在走啦~


