新版TCGAbiolinks的整理表达数据和临床数据
没有废话直接干
##加载包
rm(list = ls())
options(stringsAsFactors = F)
gc()
library(TCGAbiolinks)
library(scRNAseq)
library(data.table)
library(limma)
library(dplyr)
library(DT)
表达数据下载,跟GDC官网一样的参数
?GDCquery ##好好看参数,真的很简单对着选就可以
###表达数据下载
query <- GDCquery(
  project = "TCGA-ESCA",
  data.category = "Transcriptome Profiling",
  data.type = "Gene Expression Quantification",
  workflow.type = "STAR - Counts"
)
GDCdownload(query = query)
expData<- GDCprepare(query = query,
                   save = TRUE,
                   save.filename = 'ESCA_exp.rda'
)
##利用scRNAseq这个包直接获取
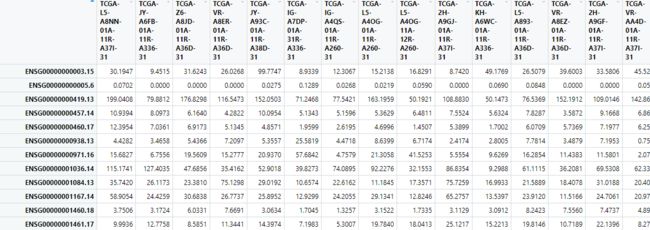
tpm_data <- assay(expData,i = "tpm_unstrand")##选择的比较多根据下面图的列名选取需要的数据

我们得到标准化的TPM矩阵

行名转换
目录下会生成一个GDCdata的文件夹,需要你选取里面任意的一个表达文件,格式为tsv的哈
#随便找个表达文件
row_file <-  data.table::fread('./GDCdata/TCGA-ESCA/harmonized/Transcriptome_Profiling/Gene_Expression_Quantification/00373cba-948b-4fb5-a8ea-8aa612f4ea99/625933e1-f9c9-43d9-8335-9de0c7ecb367.rna_seq.augmented_star_gene_counts.tsv',data.table = F)
row_file <- row_file[-c(1:4),]
rownames(row_file) <- row_file[,1]
###
same <- intersect(row.names(tpm_data),row.names(row_file))
length(same)
ESCA_tpmExp <- cbind(row_file[same,],tpm_data[same,])
ESCA_tpmExp <- ESCA_tpmExp[,-c(1,3:9)]
dim(ESCA_tpmExp)
#60660   175 ##含有基因的名字所以175
##去重
rt=as.matrix(ESCA_tpmExp)
rownames(rt)=rt[,1]
exp=rt[,2:ncol(rt)]
dimnames=list(rownames(exp),colnames(exp))
data=matrix(as.numeric(as.matrix(exp)),nrow=nrow(exp),dimnames=dimnames)
data=avereps(data)
ESCA_exp=data[rowMeans(data)>0,]
dim(ESCA_exp)
#56911   174
Out=rbind(id=colnames(ESCA_exp), ESCA_exp)
write.table(Out, file="./00.data/ESCA_exp.txt", sep="\t", quote=F, col.names=F)
接下来下载临床数据
解释下这个参数,需要你选择下需要的信息
cli <- GDCprepare_clinic(query,'follow_up')

rm(list = ls())
options(stringsAsFactors = F)
gc()
###临床数据下载
query <- GDCquery(
  project = "TCGA-ESCA",
  data.category = "Clinical",
  data.type = "Clinical Supplement",
  data.format = "BCR XML"
)
GDCdownload(query)
cli <- GDCprepare_clinic(query,'follow_up')
接着把生存时间给合并下
2个人没有生存状态信息
#合并时间
cli <- cli  %>%
  select(bcr_followup_barcode,vital_status,
                days_to_death,days_to_last_followup) %>%
  distinct(bcr_followup_barcode, .keep_all = TRUE)
table(cli$vital_status)
# NA  Alive  Dead
#  2   121    32
##死亡的信息
dead_patient <-  cli %>%
  dplyr::filter(vital_status == 'Dead') %>%
  dplyr::select(-days_to_last_followup) %>%
    rename(c(bcr_followup_barcode = 'Barcode',
                    vital_status = 'fustat',
                    days_to_death='futime'
                    )) %>%
  mutate(fustat=ifelse(fustat=='Dead',1,0))%>%
  mutate(futime=futime/365)
#活的信息
alive_patient <-  cli %>%
  dplyr::filter(vital_status == 'Alive') %>%
  dplyr::select(-days_to_death) %>%
  rename(c(bcr_followup_barcode = 'Barcode',
           vital_status = 'fustat',
           days_to_last_followup='futime'
  )) %>%
  mutate(fustat=ifelse(fustat=='Dead',1,0))%>%
  mutate(futime=futime/365)
#合并
survival_data <- rbind(dead_patient,alive_patient)
write.csv(survival_data,file="./00.data/ESCA_surviv.csv")
不要问我原理,不要问我为啥报错,复制一堆代码给我看,应用自己数据的时候你要一行行的RUN,不要全选跑,多多比较与我给的例子每一步的差异,你就会进步,各位同学,拿来主义快乐。工具就是用的,没有那么多为啥


