Android之ANR问题分析,触发原理,解决办法
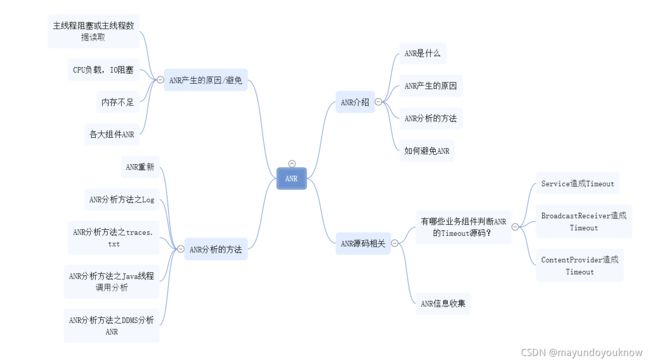
1.ANR是什么?
Application Not Responding,字面意思就是应用无响应,稍加解释就是用户的一些操作无法从应用中获取反馈;在实际的应用中应当去避免这种现象,虽然它暂时不会造成应用崩溃,但是却极大地损坏用户体验;
2.ANR触发原因
出现ANR之后一个直观的现象就是系统会展示出一个ANR对话框,如图:
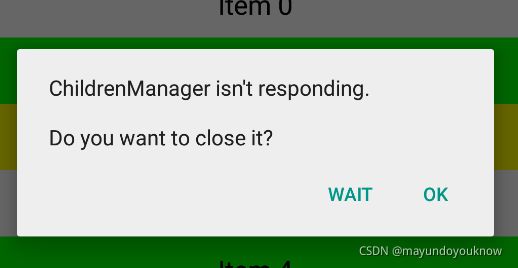
Android系统中,ActivityManagerService(简称AMS)和WindowManagerService(简称WMS)会检测APP的响应时间,如果APP在特定时间无法处理相应屏幕触摸或键盘输入事件,或者特定时间没有处理完毕,就会出现ANR;
那么哪些场景会造成ANR呢?
- Service Timeout:比如前台服务在20s内未执行完成;
- BroadcastQueue Timeout:比如前台广播在10s内未执行完成
- ContentProvider Timeout:内容提供者,在publish过超时10s;
- InputDispatching Timeout: 输入事件分发超时5s,包括按键和触摸事件。
因此避免以上四种情况就是解决ANR的关键;
导致ANR无响应的常见原因:
- 主线程阻塞或主线程数据读取
解决办法:避免死锁的出现,使用子线程来处理耗时操作或阻塞任务。尽量避免在主线程query provider、不要滥用SharePreferenceS
- CPU满负荷,I/O阻塞
解决办法:文件读写或数据库操作放在子线程异步操作。
- 内存不足
解决办法:
AndroidManifest.xml文件中可以设置 android:largeHeap="true",以此增大App使用内存。不过不建议使用此法,从根本上防止内存泄漏,优化内存使用才是正道。
- 各大组件ANR
各大组件生命周期中也应避免耗时操作,注意BroadcastReciever的onRecieve()、后台Service和ContentProvider也不要执行太长时间的任务。
3.ANR时系统做了什么?
ANR时展示给用户什么内容,源码分析ANR做了哪些事情,知道ANR做了什么,更有助于我们分析ANR;
3.1展示一个应用无反应的对话框
在Activity内为Button添加点击事件,点击时让主线程休眠30秒,在连续点击几次Button按钮;
        Button.setOnClickListener(new View.OnClickListener() {
            @Override
            public void onClick(View v) {
                // 这是Android提供线程休眠函数,与Thread.sleep()最大的区别是
                // 该使用该函数不会抛出InterruptedException异常。
                SystemClock.sleep(30 * 1000);
            }
        });
在点击Button按钮第一次以后,在连续点击几次Button按钮,大概七八秒,终于弹出ANR异常;
3.2将ANR信息输出到Logcat
产生ANR时Logcat会同时如下内容:
10-15 01:47:20.975 4038-4046/com.gome.childrenmanager I/art: Thread[5,tid=4046,WaitingInMainSignalCatcherLoop,Thread*=0xaf00d400,peer=0x12c00080,"Signal Catcher"]: reacting to signal 3
10-15 01:47:20.985 4038-4046/com.gome.childrenmanager I/art: Wrote stack traces to '/data/anr/traces.txt'
10-15 01:47:45.820 4038-4038/com.gome.childrenmanager I/Choreographer: Skipped 42 frames! The application may be doing too much work on its main thread.
可以看到Logcat清晰的记录ANR发生的时间,以及线程的tid和一句话概括的原因:WaitingInMainSignalCatcherLoop主线程等待异常,最后一句话 Skipped 42 frames! The application may be doing too much work on its main thread.告知主线程被阻塞导致帧画面无法刷新;
3.3将ANR信息输出到traces.txt文件中
Wrote stack traces to '/data/anr/traces.txt
通过Logcat输出日志看到会将ANR信息写入traces.txt文件,traces.txt文件是一个ANR记录文件,用于开发人员调试分析ANR产生原因,目录在/data/anr中,可以通过adb pull命令导出:
adb pull /data/anr/traces.txt C:\anradb命令默认在Android SDK下platform-tools目录,没有配置adb环境变量的需要进入platform-tools目录执行adb命令;
不指定traces.txt导出默认,默认导出到adb所在命令目录;后面对如何分析traces.txt这个文件做详细描述;
3.4ANR源码分析
最后来看看做出上述反应的源代码,这部分代码位于ProcessRecord类中;
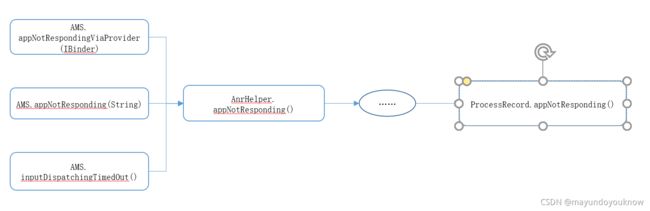
ActivityManagerService监听到ANR信息,调用AnrHelper下的方法appNotResponding(),AnrHelper在后台开启一个独立的线程去处理ANR消息,以便缩短处理时间;
AnrHelper
private class AnrConsumerThread extends Thread {
        @Override
        public void run() {
            AnrRecord r;
            r.appNotResponding(onlyDumpSelf);

        }
    }

private static class AnrRecord {
        final ProcessRecord mApp;
        void appNotResponding(boolean onlyDumpSelf) {
            mApp.appNotResponding(mActivityShortComponentName, mAppInfo,
                    mParentShortComponentName, mParentProcess, mAboveSystem, mAnnotation,
                    onlyDumpSelf);
        }
    }
ProcessRecord.appNotResponding()
ProcessRecord.java
void appNotResponding(String activityShortComponentName, ApplicationInfo aInfo,
            String parentShortComponentName, WindowProcessController parentProcess,
            boolean aboveSystem, String annotation, boolean onlyDumpSelf) {
        ArrayList firstPids = new ArrayList<>(5);
        SparseArray lastPids = new SparseArray<>(20);

        mWindowProcessController.appEarlyNotResponding(annotation, () -> kill("anr",
                  ApplicationExitInfo.REASON_ANR, true));

        long anrTime = SystemClock.uptimeMillis();

        if (isMonitorCpuUsage()) {
            //第一次,更新CPU统计信息
            mService.updateCpuStatsNow();
        }

        final boolean isSilentAnr;
        synchronized (mService) {
            // 某些特定情况下忽略本次ANR,比如系统关机,比如该进程已经处于anr状态或者crash状态
            if (mService.mAtmInternal.isShuttingDown()) {
                Slog.i(TAG, "During shutdown skipping ANR: " + this + " " + annotation);
                return;
            } else if (isNotResponding()) {
                Slog.i(TAG, "Skipping duplicate ANR: " + this + " " + annotation);
                return;
            } else if (isCrashing()) {
                Slog.i(TAG, "Crashing app skipping ANR: " + this + " " + annotation);
                return;
            } else if (killedByAm) {
                Slog.i(TAG, "App already killed by AM skipping ANR: " + this + " " + annotation);
                return;
            } else if (killed) {
                Slog.i(TAG, "Skipping died app ANR: " + this + " " + annotation);
                return;
            }

            //为了防止多次对相同APP的anr执行重复代码,在此处标注记录,属于上面的特定情况中的一种
            setNotResponding(true);

            // 记录ANR信息到Event Log中
            EventLog.writeEvent(EventLogTags.AM_ANR, userId, pid, processName, info.flags,
                    annotation);

            //将当前进程添加到firstPids
            firstPids.add(pid);

            // 如果它是一个后台的ANR或者仅仅请求导出他自己,不需要加入其它PIDS
            isSilentAnr = isSilentAnr();
            if (!isSilentAnr && !onlyDumpSelf) {
                int parentPid = pid;
                if (parentProcess != null && parentProcess.getPid() > 0) {
                    parentPid = parentProcess.getPid();
                }
                if (parentPid != pid) firstPids.add(parentPid);
                 //将system_server进程添加到firstPids
                if (MY_PID != pid && MY_PID != parentPid) firstPids.add(MY_PID);
                // 添加所有进程到firstpids中
                for (int i = getLruProcessList().size() - 1; i >= 0; i--) {
                    ProcessRecord r = getLruProcessList().get(i);
                    if (r != null && r.thread != null) {
                        int myPid = r.pid;
                        if (myPid > 0 && myPid != pid && myPid != parentPid && myPid != MY_PID) {
                            if (r.isPersistent()) {
                                firstPids.add(myPid);    //将persistent进程添加到firstPids
                                if (DEBUG_ANR) Slog.i(TAG, "Adding persistent proc: " + r);
                            } else if (r.treatLikeActivity) {
                                firstPids.add(myPid);
                                if (DEBUG_ANR) Slog.i(TAG, "Adding likely IME: " + r);
                            } else {    //其它进程添加到lastPids
                                lastPids.put(myPid, Boolean.TRUE);
                                if (DEBUG_ANR) Slog.i(TAG, "Adding ANR proc: " + r);
                            }
                        }
                    }
                }
            }
        }

        // 记录ANR输出到main log
        StringBuilder info = new StringBuilder();
        info.setLength(0);
        info.append("ANR in ").append(processName);
        if (activityShortComponentName != null) {
            info.append(" (").append(activityShortComponentName).append(")");
        }
        info.append("\n");
        info.append("PID: ").append(pid).append("\n");
        if (annotation != null) {
            info.append("Reason: ").append(annotation).append("\n");
        }
        if (parentShortComponentName != null
                && parentShortComponentName.equals(activityShortComponentName)) {
            info.append("Parent: ").append(parentShortComponentName).append("\n");
        }

        StringBuilder report = new StringBuilder();
        report.append(MemoryPressureUtil.currentPsiState());
        //创建CPU tracker对象
        ProcessCpuTracker processCpuTracker = new ProcessCpuTracker(true);

        // don't dump native PIDs for background ANRs unless it is the process of interest
        String[] nativeProcs = null;
        if (isSilentAnr || onlyDumpSelf) {
            for (int i = 0; i < NATIVE_STACKS_OF_INTEREST.length; i++) {
                if (NATIVE_STACKS_OF_INTEREST[i].equals(processName)) {
                    nativeProcs = new String[] { processName };
                    break;
                }
            }
        } else {
            nativeProcs = NATIVE_STACKS_OF_INTEREST;
        }

        int[] pids = nativeProcs == null ? null : Process.getPidsForCommands(nativeProcs);
        ArrayList nativePids = null;

        if (pids != null) {
            nativePids = new ArrayList<>(pids.length);
            for (int i : pids) {
                nativePids.add(i);
            }
        }

        // For background ANRs, don't pass the ProcessCpuTracker to
        // avoid spending 1/2 second collecting stats to rank lastPids.
        StringWriter tracesFileException = new StringWriter();
        // To hold the start and end offset to the ANR trace file respectively.
        final long[] offsets = new long[2];
        //将ANR信息输出到traces文件
        File tracesFile = ActivityManagerService.dumpStackTraces(firstPids,
                isSilentAnr ? null : processCpuTracker, isSilentAnr ? null : lastPids,
                nativePids, tracesFileException, offsets);

        if (isMonitorCpuUsage()) {//第二次更新CPU统计信息
            mService.updateCpuStatsNow();
            synchronized (mService.mProcessCpuTracker) {
                //记录当前各个进程的CPU使用情况
                report.append(mService.mProcessCpuTracker.printCurrentState(anrTime));
            }
            //记录当前CPU的负载情况
            info.append(processCpuTracker.printCurrentLoad());
            info.append(report);
        }
        report.append(tracesFileException.getBuffer());
        //记录从anr时间开始的CPU使用情况
        info.append(processCpuTracker.printCurrentState(anrTime));
        //输出当前ANR的reason,以及CPU使用率、负载信息
        Slog.e(TAG, info.toString());
        if (tracesFile == null) {
            // There is no trace file, so dump (only) the alleged culprit's threads to the log
            Process.sendSignal(pid, Process.SIGNAL_QUIT);
        } else if (offsets[1] > 0) {
            // We've dumped into the trace file successfully
            mService.mProcessList.mAppExitInfoTracker.scheduleLogAnrTrace(
                    pid, uid, getPackageList(), tracesFile, offsets[0], offsets[1]);
        }

        FrameworkStatsLog.write(FrameworkStatsLog.ANR_OCCURRED, uid, processName,
                activityShortComponentName == null ? "unknown": activityShortComponentName,
                annotation,
                (this.info != null) ? (this.info.isInstantApp()
                        ? FrameworkStatsLog.ANROCCURRED__IS_INSTANT_APP__TRUE
                        : FrameworkStatsLog.ANROCCURRED__IS_INSTANT_APP__FALSE)
                        : FrameworkStatsLog.ANROCCURRED__IS_INSTANT_APP__UNAVAILABLE,
                isInterestingToUserLocked()
                        ? FrameworkStatsLog.ANROCCURRED__FOREGROUND_STATE__FOREGROUND
                        : FrameworkStatsLog.ANROCCURRED__FOREGROUND_STATE__BACKGROUND,
                getProcessClassEnum(),
                (this.info != null) ? this.info.packageName : "");
        final ProcessRecord parentPr = parentProcess != null
                ? (ProcessRecord) parentProcess.mOwner : null;
        //将traces文件 和 CPU使用率信息保存到dropbox,即data/system/dropbox目录
        mService.addErrorToDropBox("anr", this, processName, activityShortComponentName,
                parentShortComponentName, parentPr, annotation, report.toString(), tracesFile,
                null);

        if (mWindowProcessController.appNotResponding(info.toString(), () -> kill("anr",
                ApplicationExitInfo.REASON_ANR, true),
                () -> {
                    synchronized (mService) {
                        mService.mServices.scheduleServiceTimeoutLocked(this);
                    }
                })) {
            return;
        }

        synchronized (mService) {
            // mBatteryStatsService can be null if the AMS is constructed with injector only. This
            // will only happen in tests.
            if (mService.mBatteryStatsService != null) {
                mService.mBatteryStatsService.noteProcessAnr(processName, uid);
            }

            if (isSilentAnr() && !isDebugging()) {
                kill("bg anr", ApplicationExitInfo.REASON_ANR, true);
                return;
            }

            // Set the app's notResponding state, and look up the errorReportReceiver
            makeAppNotRespondingLocked(activityShortComponentName,
                    annotation != null ? "ANR " + annotation : "ANR", info.toString());

            // mUiHandler can be null if the AMS is constructed with injector only. This will only
            // happen in tests.
            // 发送SHOW_NOT_RESPONDING_UI_MSG,准备显示ANR对话框
            if (mService.mUiHandler != null) {
                // Bring up the infamous App Not Responding dialog
                Message msg = Message.obtain();
                msg.what = ActivityManagerService.SHOW_NOT_RESPONDING_UI_MSG;
                msg.obj = new AppNotRespondingDialog.Data(this, aInfo, aboveSystem);

                mService.mUiHandler.sendMessage(msg);
            }
        }
    }
4.ANR的分析方法
由于面对ANR源码的分析可以看出来,我们ANR可以生成traces.txt以及DropBox目录下的ANR历史记录,因此可以考虑阅读该文件来分析,除此之外我们还有DDMS帮助我们分析ANR,这两种方式实际上是大同小异的,只是应用的场景不同;在讲ANR分析之前,我们先说Java应用的分析;
4.1.Java线程调用分析方法
为什么要在讲Android的ANR分析方法之前提到Java的分析方法呢,因为需要在解释ANR之前稍微介绍一下线程状态的概念,以便后面做叙述,同时也可以更方便的带入分析的方法。JDK中有一个关键命令可以帮助我们分析和调试Java应用——jstack,命令的使用方法是
jstack {pid}
启动pid是通过jps命令获得,jps命令会列出当前系统中运行的所有Java虚拟机进程,比如这个
C:\Users\XXX>jps
3636 GradleDaemon
11656
6796 Jps
7036 Test
上面的命令可以发现系统中目前有6796、3636和7036三个Java虚拟机进程,此时如果我想知道当前Test进程的情况,就可以通过jstack命令来查看,jstack命令的输出结果很简单,它会打印出该进程中所有线程的状态以及调用关系,甚至会给出一些简单的分析结果
C:\Users\dongdawei1>jstack 7036
2021-10-18 14:08:25
Full thread dump Java HotSpot(TM) 64-Bit Server VM (25.151-b12 mixed mode):

"DestroyJavaVM" #16 prio=5 os_prio=0 tid=0x00000000031c2000 nid=0x8d8 waiting on condition [0x0000000000000000]
   java.lang.Thread.State: RUNNABLE

"Thread-3" #15 prio=5 os_prio=0 tid=0x000000001ef7a800 nid=0x2de8 waiting for monitor entry [0x000000001fc6f000]
   java.lang.Thread.State: BLOCKED (on object monitor)
        at com.gome.childrenmanager.Test.rightLeft(Test.java:37)
        - waiting to lock <0x000000076c8997e8> (a com.gome.childrenmanager.Test$LeftObject)
        - locked <0x000000076c89eb00> (a com.gome.childrenmanager.Test$RightObject)
        at com.gome.childrenmanager.Test$2.run(Test.java:56)
        at java.lang.Thread.run(Thread.java:748)

"Thread-2" #14 prio=5 os_prio=0 tid=0x000000001ef18000 nid=0x484 waiting for monitor entry [0x000000001fb6f000]
   java.lang.Thread.State: BLOCKED (on object monitor)
        at com.gome.childrenmanager.Test.leftRight(Test.java:25)
        - waiting to lock <0x000000076c89eb00> (a com.gome.childrenmanager.Test$RightObject)
        - locked <0x000000076c8997e8> (a com.gome.childrenmanager.Test$LeftObject)
        at com.gome.childrenmanager.Test$1.run(Test.java:48)
        at java.lang.Thread.run(Thread.java:748)

"Service Thread" #13 daemon prio=9 os_prio=0 tid=0x000000001ee51800 nid=0x3a20 runnable [0x0000000000000000]
   java.lang.Thread.State: RUNNABLE

"C1 CompilerThread3" #12 daemon prio=9 os_prio=2 tid=0x000000001eda8000 nid=0xa7c waiting on condition [0x0000000000000000]
   java.lang.Thread.State: RUNNABLE

"C2 CompilerThread2" #11 daemon prio=9 os_prio=2 tid=0x000000001eda5000 nid=0x234c waiting on condition [0x0000000000000000]
   java.lang.Thread.State: RUNNABLE

"C2 CompilerThread1" #10 daemon prio=9 os_prio=2 tid=0x000000001eda2800 nid=0x2ec8 waiting on condition [0x0000000000000000]
   java.lang.Thread.State: RUNNABLE

"C2 CompilerThread0" #9 daemon prio=9 os_prio=2 tid=0x000000001eda0800 nid=0x1728 waiting on condition [0x0000000000000000]
   java.lang.Thread.State: RUNNABLE

"Monitor Ctrl-Break" #8 daemon prio=5 os_prio=0 tid=0x000000001ed9f000 nid=0x3144 runnable [0x000000001f46e000]
   java.lang.Thread.State: RUNNABLE
        at java.net.SocketInputStream.socketRead0(Native Method)
        at java.net.SocketInputStream.socketRead(SocketInputStream.java:116)
        at java.net.SocketInputStream.read(SocketInputStream.java:171)
        at java.net.SocketInputStream.read(SocketInputStream.java:141)
        at sun.nio.cs.StreamDecoder.readBytes(StreamDecoder.java:284)
        at sun.nio.cs.StreamDecoder.implRead(StreamDecoder.java:326)
        at sun.nio.cs.StreamDecoder.read(StreamDecoder.java:178)
        - locked <0x000000076c5bb728> (a java.io.InputStreamReader)
        at java.io.InputStreamReader.read(InputStreamReader.java:184)
        at java.io.BufferedReader.fill(BufferedReader.java:161)
        at java.io.BufferedReader.readLine(BufferedReader.java:324)
        - locked <0x000000076c5bb728> (a java.io.InputStreamReader)
        at java.io.BufferedReader.readLine(BufferedReader.java:389)
        at com.intellij.rt.execution.application.AppMainV2$1.run(AppMainV2.java:61)

"Attach Listener" #5 daemon prio=5 os_prio=2 tid=0x000000001eca8000 nid=0x1f28 waiting on condition [0x0000000000000000]
   java.lang.Thread.State: RUNNABLE

"Signal Dispatcher" #4 daemon prio=9 os_prio=2 tid=0x000000001ec3e800 nid=0x1e14 runnable [0x0000000000000000]
   java.lang.Thread.State: RUNNABLE

"Finalizer" #3 daemon prio=8 os_prio=1 tid=0x00000000032be000 nid=0x321c in Object.wait() [0x000000001f10e000]
   java.lang.Thread.State: WAITING (on object monitor)
        at java.lang.Object.wait(Native Method)
        - waiting on <0x000000076c188ec8> (a java.lang.ref.ReferenceQueue$Lock)
        at java.lang.ref.ReferenceQueue.remove(ReferenceQueue.java:143)
        - locked <0x000000076c188ec8> (a java.lang.ref.ReferenceQueue$Lock)
        at java.lang.ref.ReferenceQueue.remove(ReferenceQueue.java:164)
        at java.lang.ref.Finalizer$FinalizerThread.run(Finalizer.java:209)

"Reference Handler" #2 daemon prio=10 os_prio=2 tid=0x000000001cd0d800 nid=0xcc8 in Object.wait() [0x000000001ec0f000]
   java.lang.Thread.State: WAITING (on object monitor)
        at java.lang.Object.wait(Native Method)
        - waiting on <0x000000076c186b68> (a java.lang.ref.Reference$Lock)
        at java.lang.Object.wait(Object.java:502)
        at java.lang.ref.Reference.tryHandlePending(Reference.java:191)
        - locked <0x000000076c186b68> (a java.lang.ref.Reference$Lock)
        at java.lang.ref.Reference$ReferenceHandler.run(Reference.java:153)

"VM Thread" os_prio=2 tid=0x000000001cd08800 nid=0x2500 runnable

"GC task thread#0 (ParallelGC)" os_prio=0 tid=0x00000000031dc000 nid=0x2dac runnable

"GC task thread#1 (ParallelGC)" os_prio=0 tid=0x00000000031de000 nid=0x4f0 runnable

"GC task thread#2 (ParallelGC)" os_prio=0 tid=0x00000000031df800 nid=0x122c runnable

"GC task thread#3 (ParallelGC)" os_prio=0 tid=0x00000000031e2000 nid=0x2e20 runnable

"GC task thread#4 (ParallelGC)" os_prio=0 tid=0x00000000031e4000 nid=0x137c runnable

"GC task thread#5 (ParallelGC)" os_prio=0 tid=0x00000000031e5800 nid=0x2610 runnable

"GC task thread#6 (ParallelGC)" os_prio=0 tid=0x00000000031e8800 nid=0x1f88 runnable

"GC task thread#7 (ParallelGC)" os_prio=0 tid=0x00000000031e9800 nid=0x94c runnable

"VM Periodic Task Thread" os_prio=2 tid=0x000000001ef0b000 nid=0x17f8 waiting on condition

JNI global references: 17


Found one Java-level deadlock:
=============================
"Thread-3":
  waiting to lock monitor 0x000000001cd13648 (object 0x000000076c8997e8, a com.gome.childrenmanager.Test$LeftObject),
  which is held by "Thread-2"
"Thread-2":
  waiting to lock monitor 0x000000001cd10db8 (object 0x000000076c89eb00, a com.gome.childrenmanager.Test$RightObject),
  which is held by "Thread-3"

Java stack information for the threads listed above:
===================================================
"Thread-3":
        at com.gome.childrenmanager.Test.rightLeft(Test.java:37)
        - waiting to lock <0x000000076c8997e8> (a com.gome.childrenmanager.Test$LeftObject)
        - locked <0x000000076c89eb00> (a com.gome.childrenmanager.Test$RightObject)
        at com.gome.childrenmanager.Test$2.run(Test.java:56)
        at java.lang.Thread.run(Thread.java:748)
"Thread-2":
        at com.gome.childrenmanager.Test.leftRight(Test.java:25)
        - waiting to lock <0x000000076c89eb00> (a com.gome.childrenmanager.Test$RightObject)
        - locked <0x000000076c8997e8> (a com.gome.childrenmanager.Test$LeftObject)
        at com.gome.childrenmanager.Test$1.run(Test.java:48)
        at java.lang.Thread.run(Thread.java:748)

Found 1 deadlock.
1)Thread基础信息
输出包含所有线程,取其中的一条
"Thread-3" #15 prio=5 os_prio=0 tid=0x000000001ef7a800 nid=0x2de8 waiting for monitor entry [0x000000001fc6f000]
   java.lang.Thread.State: BLOCKED (on object monitor)
        at com.gome.childrenmanager.Test.rightLeft(Test.java:37)
        - waiting to lock <0x000000076c8997e8> (a com.gome.childrenmanager.Test$LeftObject)
        - locked <0x000000076c89eb00> (a com.gome.childrenmanager.Test$RightObject)
        at com.gome.childrenmanager.Test$2.run(Test.java:56)
        at java.lang.Thread.run(Thread.java:748)
a)"Thread-3" #15 prio=5 os_prio=0 tid=0x000000001ef7a800 nid=0x2de8 waiting for monitor entry [0x000000001fc6f000]
首先描述了线程名是『Thread-3』,然后prio=5表示优先级,tid表示的是线程id,nid表示native层的线程id,他们的值实际都是一个地址,后续给出了对于线程状态的描述,waiting for monitor entry [0x000000001fc6f000]这里表示该线程目前处于一个等待进入临界区状态,该临界区的地址是[0x000000001fc6f000]
这里对线程的描述多种多样,简单解释下上面出现的几种状态
- waiting on condition(等待某个事件出现)
- waiting for monitor entry(等待进入临界区)
- runnable(正在运行)
- in Object.wait(处于等待状态)
b)java.lang.Thread.State: BLOCKED (on object monitor)
这段是描述线程状态,我们知道Java的6种线程状态定义在Thread.java中
Thread.java
public enum State {
        /**
         * Thread state for a thread which has not yet started.
         */
        NEW,

        /**
         * Thread state for a runnable thread.
         */
        RUNNABLE,

        /**
         * Thread state for a thread blocked waiting for a monitor lock.
         */
        BLOCKED,

        /**
         * Thread state for a waiting thread.
         */
        WAITING,

        /**
         * Thread state for a waiting thread with a specified waiting time.
         */
        TIMED_WAITING,

        /**
         * Thread state for a terminated thread.
         */
        TERMINATED;
    }
由此我们知道Thread-3这个线程的状态是BLOCKED,根据线程状态的描述知道它在等待一个锁
c) at com.XXX.Test.rightLeft(Test.java:37)调用栈
at com.gome.childrenmanager.Test.rightLeft(Test.java:37)
        - waiting to lock <0x000000076c8997e8> (a com.gome.childrenmanager.Test$LeftObject)
        - locked <0x000000076c89eb00> (a com.gome.childrenmanager.Test$RightObject)
        at com.gome.childrenmanager.Test$2.run(Test.java:56)
        at java.lang.Thread.run(Thread.java:748)
这段线程的调用栈,可以看到线程在我们执行jstack命令的时候运行到Test.java的37行,而在56行到37行之间,线程对一个Test$RightObject上了锁,并且目前在等待Test$LeftObject锁;
2)jstack分析信息
Found one Java-level deadlock:
=============================
"Thread-3":
  waiting to lock monitor 0x000000001cd13648 (object 0x000000076c8997e8, a com.gome.childrenmanager.Test$LeftObject),
  which is held by "Thread-2"
"Thread-2":
  waiting to lock monitor 0x000000001cd10db8 (object 0x000000076c89eb00, a com.gome.childrenmanager.Test$RightObject),
  which is held by "Thread-3"

Java stack information for the threads listed above:
===================================================
"Thread-3":
        at com.gome.childrenmanager.Test.rightLeft(Test.java:37)
        - waiting to lock <0x000000076c8997e8> (a com.gome.childrenmanager.Test$LeftObject)
        - locked <0x000000076c89eb00> (a com.gome.childrenmanager.Test$RightObject)
        at com.gome.childrenmanager.Test$2.run(Test.java:56)
        at java.lang.Thread.run(Thread.java:748)
"Thread-2":
        at com.gome.childrenmanager.Test.leftRight(Test.java:25)
        - waiting to lock <0x000000076c89eb00> (a com.gome.childrenmanager.Test$RightObject)
        - locked <0x000000076c8997e8> (a com.gome.childrenmanager.Test$LeftObject)
        at com.gome.childrenmanager.Test$1.run(Test.java:48)
        at java.lang.Thread.run(Thread.java:748)

Found 1 deadlock.说明中的信息很详细,它认为我们的应用出现了一个Java层的死锁,即Thread-2等待一个被Thread-3持有的锁,Thread-3等待一个被Thread-2持有的锁,实际上的确也是这样,最后再来看看源代码是不是这么回事;
public class Test {

    public static class LeftObject {

    }

    public static class RightObject {

    }
    private Object leftLock = new LeftObject();
    private Object rightLock = new RightObject();

    public void leftRight() {
        synchronized (leftLock) {
            try {
                TimeUnit.SECONDS.sleep(3);
            } catch (InterruptedException e) {
                e.printStackTrace();
            }
            synchronized (rightLock) {
                System.out.println("leftRight");
            }
        }
    }
    public void rightLeft() {
        synchronized (rightLock) {
            try {
                TimeUnit.SECONDS.sleep(3);
            } catch (InterruptedException e) {
                e.printStackTrace();
            }
            synchronized (leftLock) {
                System.out.println("leftRight");
            }
        }
    }
    public static void main(String[] args) {
        final Test test = new Test();

        new Thread(new Runnable() {

            @Override
            public void run() {
                test.leftRight();
            }
        }).start();

        new Thread(new Runnable() {

            @Override
            public void run() {
                test.rightLeft();
            }
        }).start();
    }
}
一目了然的故意死锁行为。。。实际的死锁可能比这个复杂,但是原理就是这样了
4.2DDMS分析ANR问题
有了上面的基础,再来看看Android的ANR如何分析,Android的DDMS工具其实已经给我们提供了一个类似于jstack命令的玩意,可以很好的让我们调试的时候实时查看Android虚拟机的线程状况。
1)使用DDMS-Update Threads工具
使用DDMS的Update Threads工具可以分为如下几步
- 选择需要查看的进程
- 点击Update Threads按钮
- 在Threads视图查看该进程的所有线程状态
选择需要查看的进程并点击更新线程按钮

查看线程状态
2)阅读Update Threads的输出
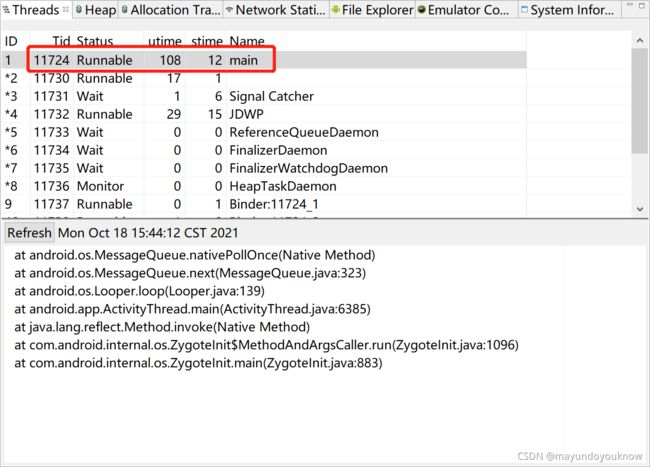
Update Threads工具可以输出当前进程的所有线程的状态,上半部分是线程列表,选中其中一条下半部分将展现出该线程当前的调用栈;
a) 线程列表
上半部分种的线程列表分为好几列,其中ID栏表示的序号,其中带有『*』标志的是守护线程,Tid是线程号,Status表示线程状态,utime表示执行用户代码的累计时间,stime表示执行系统代码的累计时间,Name表示的是线程名字。实际上utime还有stime他们具体的含义我也不是太清楚,不过这不影响我们分析问题,这里需要特别注意的是main线程啦,还有线程状态。
b)main线程
main线程就是应用主线程啦,点击上半部分线程列表选中main线程,我们可以发现,绝大多数不操作应用的情况下,调用栈应该是如下样式的;
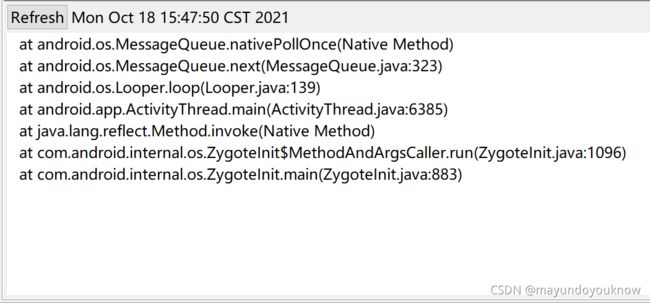
这是一个空闲等待状态,等待其他线程或者进程发送消息到主线程,再由主线程处理相应事件,具体可以看看老罗写的一篇关于Looper和Handler的文章(http://blog.csdn.net/luoshengyang/article/details/6817933) 。 如果主线程在执行过程中出现了问题,就会出现ANR,结合下面关于线程状态的分析可以知道如果主线程的状态是MONITOR一般肯定就是出现了ANR了。
c) 线程状态
我们刚刚在分心Java线程状态时明明只有6个状态,但是现在Android虚拟机给出的线程状态超出了这6个的限制,这也是需要在源码中寻找答案的,VMThread.java类中有这么一段代码
/**
 * Holds a mapping from native Thread statuses to Java one. Required for
 * translating back the result of getStatus().
 */
static final Thread.State[] STATE_MAP = new Thread.State[] {
    Thread.State.TERMINATED,     // ZOMBIE
    Thread.State.RUNNABLE,       // RUNNING
    Thread.State.TIMED_WAITING,  // TIMED_WAIT
    Thread.State.BLOCKED,        // MONITOR
    Thread.State.WAITING,        // WAIT
    Thread.State.NEW,            // INITIALIZING
    Thread.State.NEW,            // STARTING
    Thread.State.RUNNABLE,       // NATIVE
    Thread.State.WAITING,        // VMWAIT
    Thread.State.RUNNABLE        // SUSPENDED
};
而且,native层的Thread.cpp中还有一段代码
const char* dvmGetThreadStatusStr(ThreadStatus status)
{
    switch (status) {
        case THREAD_ZOMBIE:         return "ZOMBIE";
        case THREAD_RUNNING:        return "RUNNABLE";
        case THREAD_TIMED_WAIT:     return "TIMED_WAIT";
        case THREAD_MONITOR:        return "MONITOR";
        case THREAD_WAIT:           return "WAIT";
        case THREAD_INITIALIZING:   return "INITIALIZING";
        case THREAD_STARTING:       return "STARTING";
        case THREAD_NATIVE:         return "NATIVE";
        case THREAD_VMWAIT:         return "VMWAIT";
        case THREAD_SUSPENDED:      return "SUSPENDED";
        default:                    return "UNKNOWN";
    }
}
由此我们可以看到Android虚拟机中有10种线程状态,对应于Java的6种线程状态,表格如下
Android线程状态
Java线程状态
ZOMBIE TERMINATED
RUNNABLE RUNNABLE
TIMED_WAIT TIMED_WAITING in Object.wait()
MONITOR BLOCKED(on a monitor)
WAIT WAITING
INITIALIZING NEW allocated not yet running
STARTING NEW started not yet on thread list
NATIVE RUNNABLE off in a JNI native method
VMWAIT WAITING waiting on a VM resource
SUSPENDED RUNNABLE suspended usually by GC or debugger
于是各自含义就清晰了。
3)举个例子
public class BehaviorActivity extends AppCompatActivity {
    private Button btn;

    @Override
    protected void onCreate(@Nullable Bundle savedInstanceState) {
        super.onCreate(savedInstanceState);
        setContentView(R.layout.gome_most_behavior);
        btn= findViewById(R.id.btn);
        btn.setOnClickListener(new View.OnClickListener() {
            @Override
            public void onClick(View v) {
                // 这是Android提供线程休眠函数,与Thread.sleep()最大的区别是
                // 该使用该函数不会抛出InterruptedException异常。
                SystemClock.sleep(30 * 1000);
        });
    }
}
简单的一个Activity,点击按钮模拟在主线程延时操作(可以是读取文件,保存大的图片等),本身没有什么大问题,但是在该Activity的按钮连续被点击几次出现未响应的情况;
通过DDMS,我们查看到当前未响应时主线程一直处于如下调用状态
at java.lang.Thread.sleep(Native Method)
at java.lang.Thread.sleep(Thread.java:1031)
at java.lang.Thread.sleep(Thread.java:985)
at android.os.SystemClock.sleep(SystemClock.java:120)
at com.gome.childrenmanager.BehaviorActivity$1.onClick(BehaviorActivity.java:71)
at android.view.View.performClick(View.java:4756)
at android.view.View$PerformClick.run(View.java:19749)
at android.os.Handler.handleCallback(Handler.java:739)
at android.os.Handler.dispatchMessage(Handler.java:95)
at android.os.Looper.loop(Looper.java:135)
at android.app.ActivityThread.main(ActivityThread.java:5221)
at java.lang.reflect.Method.invoke(Native Method)
at java.lang.reflect.Method.invoke(Method.java:372)
at com.android.internal.os.ZygoteInit$MethodAndArgsCaller.run(ZygoteInit.java:899)
at com.android.internal.os.ZygoteInit.main(ZygoteInit.java:694)
由上面对主线程的分析可以知道,正常情况下主线程应当是处于空闲等待状态,如果长时间处于处理某一个任务时就会导致其他被发送到主线程的事件无法被及时处理,导致ANR,实际上这里模拟了30s执行耗时任务,连续点击按钮,导致ANR也就理所当然了,所以对于耗时操作还是建议在非主线程操作。
4.3traces文件分析ANR
我们在开发调试过程中遇到ANR问题大多是可以通过DDMS方法来分析问题原因的,但是所有的ANR问题不一定会在开发阶段出现,如果在测试或者发版之后出现了ANR问题,那么就需要通过traces文件来分析。根据之前的分析我们知道,traces文件位于/data/anr目录下,即便是没有root的手机也是可以通过adb命令将该文件pull出来,一个traces文件中包含了出现ANR时当前系统的所有活动进程的情况,其中每一个进程会包含所有线程的情况,因此文件的内容量往往比较大。但是一般造成ANR的进程会被记录在头一段,因此尽可能详细的分析头一段进程是解析traces文件的重要方法。
1) 文件内容解析
在traces文件中我们会看到很多段类似于如下文本的内容,其中每一段是一个进程,N段表示N个进程,共同描述了出现ANR时系统进程的状况;
----- pid 5340 at 2021-10-19 03:42:25 -----
Cmd line: com.gome.childrenmanager
ABI: x86
Build type: optimized
Loaded classes: 3927 allocated classes
Intern table: 4718 strong; 436 weak
JNI: CheckJNI is on; globals=258 (plus 1 weak)
Libraries: /system/lib/libandroid.so /system/lib/libaudioeffect_jni.so /system/lib/libcompiler_rt.so /system/lib/libjavacrypto.so /system/lib/libjnigraphics.so /system/lib/libmedia_jni.so /system/lib/librs_jni.so /system/lib/libsoundpool.so /system/lib/libwebviewchromium_loader.so libjavacore.so (10)
Heap: 9% free, 1803KB/1999KB; 54159 objects
Dumping cumulative Gc timings
Start Dumping histograms for 272 iterations for concurrent mark sweep
...
Done Dumping histograms
sticky concurrent mark sweep paused:	Sum: 536us 99% C.I. 186us-350us Avg: 268us Max: 350us
sticky concurrent mark sweep total time: 6.982ms mean time: 3.491ms
sticky concurrent mark sweep freed: 12602 objects with total size 703KB
sticky concurrent mark sweep throughput: 2.10033e+06/s / 114MB/s
Total time spent in GC: 902.591ms
Mean GC size throughput: 24MB/s
Mean GC object throughput: 146425 objects/s
Total number of allocations 186321
Total bytes allocated 23MB
Free memory 195KB
Free memory until GC 195KB
Free memory until OOME 382MB
Total memory 1999KB
Max memory 384MB
Total mutator paused time: 72.023ms
Total time waiting for GC to complete: 8.130ms

DALVIK THREADS (14):
"main" prio=5 tid=1 Sleeping
  | group="main" sCount=1 dsCount=0 obj=0x73f8e970 self=0xb4506800
  | sysTid=5340 nice=0 cgrp=default sched=0/0 handle=0xb770e160
  | state=S schedstat=( 0 0 0 ) utm=4 stm=6 core=3 HZ=100
  | stack=0xbf182000-0xbf184000 stackSize=8MB
  | held mutexes=
  at java.lang.Thread.sleep!(Native method)
  - sleeping on <0x2d25f5e3> (a java.lang.Object)
  at java.lang.Thread.sleep(Thread.java:1031)
  - locked <0x2d25f5e3> (a java.lang.Object)
  at java.lang.Thread.sleep(Thread.java:985)
  at android.os.SystemClock.sleep(SystemClock.java:120)
  at com.gome.childrenmanager.BehaviorActivity$1.onClick(BehaviorActivity.java:71)
  at android.view.View.performClick(View.java:4756)
  at android.view.View$PerformClick.run(View.java:19749)
  at android.os.Handler.handleCallback(Handler.java:739)
  at android.os.Handler.dispatchMessage(Handler.java:95)
  at android.os.Looper.loop(Looper.java:135)
  at android.app.ActivityThread.main(ActivityThread.java:5221)
  at java.lang.reflect.Method.invoke!(Native method)
  at java.lang.reflect.Method.invoke(Method.java:372)
  at com.android.internal.os.ZygoteInit$MethodAndArgsCaller.run(ZygoteInit.java:899)
  at com.android.internal.os.ZygoteInit.main(ZygoteInit.java:694)

"Heap thread pool worker thread 2" prio=5 tid=2 Native (still starting up)
  | group="" sCount=1 dsCount=0 obj=0x0 self=0xafa0d400
  | sysTid=5345 nice=0 cgrp=default sched=0/0 handle=0xb455a180
  | state=S schedstat=( 0 0 0 ) utm=0 stm=0 core=2 HZ=100
  | stack=0xb38ff000-0xb3901000 stackSize=1020KB
  | held mutexes=
  kernel: futex_wait_queue_me+0xcd/0x113
  kernel: futex_wait+0xc1/0x194
  kernel: do_futex+0x9b/0x740
  kernel: SyS_futex+0xaf/0xf6
  kernel: syscall_call+0x7/0xb
  native: #00 pc 00012d50  /system/lib/libc.so (syscall+32)
  native: #01 pc 000fdc97  /dev/ashmem/dalvik-Heap thread pool worker thread 2 (deleted) (???)
  (no managed stack frames)

//...

----- end 5340 -----
a) 进程头部信息
----- pid 5340 at 2021-10-19 03:42:25 -----
Cmd line: com.gome.childrenmanager
这里记录了出现ANR时该进程的pid号以及当前时间,进程名是com.gome.childrenmanager
b) 进程资源状态信息
ABI: x86
Build type: optimized
Loaded classes: 3927 allocated classes
Intern table: 4718 strong; 436 weak
JNI: CheckJNI is on; globals=258 (plus 1 weak)
Libraries: /system/lib/libandroid.so /system/lib/libaudioeffect_jni.so /system/lib/libcompiler_rt.so /system/lib/libjavacrypto.so /system/lib/libjnigraphics.so /system/lib/libmedia_jni.so /system/lib/librs_jni.so /system/lib/libsoundpool.so /system/lib/libwebviewchromium_loader.so libjavacore.so (10)
Heap: 9% free, 1803KB/1999KB; 54159 objects
Dumping cumulative Gc timings
Start Dumping histograms for 272 iterations for concurrent mark sweep
...
Done Dumping histograms
sticky concurrent mark sweep paused:	Sum: 536us 99% C.I. 186us-350us Avg: 268us Max: 350us
sticky concurrent mark sweep total time: 6.982ms mean time: 3.491ms
sticky concurrent mark sweep freed: 12602 objects with total size 703KB
sticky concurrent mark sweep throughput: 2.10033e+06/s / 114MB/s
Total time spent in GC: 902.591ms
Mean GC size throughput: 24MB/s
Mean GC object throughput: 146425 objects/s
Total number of allocations 186321
Total bytes allocated 23MB
Free memory 195KB
Free memory until GC 195KB
Free memory until OOME 382MB
Total memory 1999KB
Max memory 384MB
Total mutator paused time: 72.023ms
Total time waiting for GC to complete: 8.130ms
这里打印了一大段关于硬件状态的信息,虽然目前我还没用到这里的信息,不过我觉得在某些时候这里的数据是会有作用的;
c) 每条线程的信息
"main" prio=5 tid=1 Sleeping  // 输出了线程名,优先级,线程号,线程状态,带有『deamon』字样的线程表示守护线程,即DDMS中『*』线程
  | group="main" sCount=1 dsCount=0 obj=0x73f8e970 self=0xb4506800 // 输出了线程组名,sCount被挂起次数,dsCount被调试器挂起次数,obj表示线程对象的地址,self表示线程本身的地址
  | sysTid=5340 nice=0 cgrp=default sched=0/0 handle=0xb770e160 // // sysTid是Linux下的内核线程id,nice是线程的调度优先级,sched分别标志了线程的调度策略和优先级,cgrp是调度属组,handle是线程的处理函数地址。
  | state=S schedstat=( 0 0 0 ) utm=4 stm=6 core=3 HZ=100 // state是调度状态;schedstat从 /proc/[pid]/task/[tid]/schedstat读出,三个值分别表示线程在cpu上执行的时间、线程的等待时间和线程执行的时间片长度,有的android内核版本不支持这项信息,得到的三个值都是0;utm是线程用户态下使用的时间值(单位是jiffies);stm是内核态下的调度时间值;core是最后执行这个线程的cpu核的序号。
  | stack=0xbf182000-0xbf184000 stackSize=8MB
  | held mutexes=
  at java.lang.Thread.sleep!(Native method)
  - sleeping on <0x2d25f5e3> (a java.lang.Object)
  at java.lang.Thread.sleep(Thread.java:1031)
  - locked <0x2d25f5e3> (a java.lang.Object)
  at java.lang.Thread.sleep(Thread.java:985)
  at android.os.SystemClock.sleep(SystemClock.java:120)
  at com.gome.childrenmanager.BehaviorActivity$1.onClick(BehaviorActivity.java:71)
  at android.view.View.performClick(View.java:4756)
  at android.view.View$PerformClick.run(View.java:19749)
  at android.os.Handler.handleCallback(Handler.java:739)
  at android.os.Handler.dispatchMessage(Handler.java:95)
  at android.os.Looper.loop(Looper.java:135)
  at android.app.ActivityThread.main(ActivityThread.java:5221)
  at java.lang.reflect.Method.invoke!(Native method)
  at java.lang.reflect.Method.invoke(Method.java:372)
  at com.android.internal.os.ZygoteInit$MethodAndArgsCaller.run(ZygoteInit.java:899)
  at com.android.internal.os.ZygoteInit.main(ZygoteInit.java:694)
该有的描述上面已经用注释的方式放入了,最后的部分是调用栈信息。
2)再举个例子
----- pid 12838 at 2021-10-19 10:41:04 -----
Cmd line: 略
// 进程状态信息省略

suspend all histogram:  Sum: 1.456ms 99% C.I. 3us-508.799us Avg: 97.066us Max: 523us
DALVIK THREADS (19):
"Signal Catcher" daemon prio=5 tid=2 Runnable
  | group="system" sCount=0 dsCount=0 obj=0x32c02100 self=0xb82f1d40
  | sysTid=12843 nice=0 cgrp=bg_non_interactive sched=0/0 handle=0xb39ec930
  | state=R schedstat=( 10914800 1156480 11 ) utm=0 stm=0 core=2 HZ=100
  | stack=0xb38f0000-0xb38f2000 stackSize=1014KB
  | held mutexes= "mutator lock"(shared held)
  native: #00 pc 00371069  /system/lib/libart.so (_ZN3art15DumpNativeStackERNSt3__113basic_ostreamIcNS0_11char_traitsIcEEEEiPKcPNS_9ArtMethodEPv+160)
  native: #01 pc 003508c3  /system/lib/libart.so (_ZNK3art6Thread4DumpERNSt3__113basic_ostreamIcNS1_11char_traitsIcEEEE+150)
  native: #02 pc 0035a5bb  /system/lib/libart.so (_ZN3art14DumpCheckpoint3RunEPNS_6ThreadE+442)
  native: #03 pc 0035b179  /system/lib/libart.so (_ZN3art10ThreadList13RunCheckpointEPNS_7ClosureE+212)
  native: #04 pc 0035b6a7  /system/lib/libart.so (_ZN3art10ThreadList4DumpERNSt3__113basic_ostreamIcNS1_11char_traitsIcEEEE+142)
  native: #05 pc 0035bdb7  /system/lib/libart.so (_ZN3art10ThreadList14DumpForSigQuitERNSt3__113basic_ostreamIcNS1_11char_traitsIcEEEE+334)
  native: #06 pc 00331179  /system/lib/libart.so (_ZN3art7Runtime14DumpForSigQuitERNSt3__113basic_ostreamIcNS1_11char_traitsIcEEEE+72)
  native: #07 pc 0033b27d  /system/lib/libart.so (_ZN3art13SignalCatcher13HandleSigQuitEv+928)
  native: #08 pc 0033bb61  /system/lib/libart.so (_ZN3art13SignalCatcher3RunEPv+340)
  native: #09 pc 00041737  /system/lib/libc.so (_ZL15__pthread_startPv+30)
  native: #10 pc 00019433  /system/lib/libc.so (__start_thread+6)
  (no managed stack frames)
"main" prio=5 tid=1 Blocked
  | group="main" sCount=1 dsCount=0 obj=0x759002c0 self=0xb737fee8
  | sysTid=12838 nice=-1 cgrp=bg_non_interactive sched=0/0 handle=0xb6f1eb38
  | state=S schedstat=( 743081924 64813008 709 ) utm=50 stm=23 core=4 HZ=100
  | stack=0xbe54e000-0xbe550000 stackSize=8MB
  | held mutexes=
  kernel: (couldn't read /proc/self/task/12838/stack)
  native: #00 pc 00016aa4  /system/lib/libc.so (syscall+28)
  native: #01 pc 000f739d  /system/lib/libart.so (_ZN3art17ConditionVariable4WaitEPNS_6ThreadE+96)
  native: #02 pc 002bcd8d  /system/lib/libart.so (_ZN3art7Monitor4LockEPNS_6ThreadE+408)
  native: #03 pc 002bed73  /system/lib/libart.so (_ZN3art7Monitor4WaitEPNS_6ThreadExibNS_11ThreadStateE+922)
  native: #04 pc 002bfbaf  /system/lib/libart.so (_ZN3art7Monitor4WaitEPNS_6ThreadEPNS_6mirror6ObjectExibNS_11ThreadStateE+142)
  native: #05 pc 002d1403  /system/lib/libart.so (_ZN3artL11Object_waitEP7_JNIEnvP8_jobject+38)
  native: #06 pc 0000036f  /data/dalvik-cache/arm/system@[email protected] (Java_java_lang_Object_wait__+74)
  at java.lang.Object.wait!(Native method)
  - waiting to lock <0x0520de84> (a java.lang.Object) held by thread 22
  at com.xx(unavailable:-1)
  - locked <0x00e3266d>
  - locked <0x0520de84> (a java.lang.Object)
  at com.xx.R(unavailable:-1)
  at com.xx.ux(unavailable:-1)
  // 其余栈略
  at com.android.internal.os.ZygoteInit.main(ZygoteInit.java:684)
// 其他线程省略
"Thread-654" prio=5 tid=22 Blocked
  | group="main" sCount=1 dsCount=0 obj=0x32c027c0 self=0xb83e9750
  | sysTid=12891 nice=0 cgrp=bg_non_interactive sched=0/0 handle=0x9cf1c930
  | state=S schedstat=( 50601200 1215760 62 ) utm=4 stm=0 core=7 HZ=100
  | stack=0x9ce1a000-0x9ce1c000 stackSize=1038KB
  | held mutexes=
  at com.yy(unavailable:-1)
  - waiting to lock <0x00e3266d> held by thread 1
  at com.yy.MX(unavailable:-1)
  at com.yy.run(unavailable:-1)
  - locked <0x0520de84> (a java.lang.Object)
  at java.lang.Thread.run(Thread.java:833)
从traces文件种可以很明显的看到我们的主线程处于Blcoked状态,详细查看Blcoked的原因知道,它在等待一个被22号线程持有的对象锁,于是我们查看tid=22的线程,可以看出这个线程的确锁住了一个对象,该对象正是主线程正在等待上锁的对象,那这个线程为何没有释放锁呢,因为它在等一个被1号线程持有的对象锁,因此死锁问题导致了ANR现象。
5.其他
略!!!
参考:
Android ANR介绍及分析ANR log信息的方法 - JustinYo - 博客园
Android ANR:原理分析及解决办法 - 简书
理解Android ANR的触发原理 - Gityuan博客 | 袁辉辉的技术博客
Android应用ANR分析 - 简书
理解Android ANR的信息收集过程 - Gityuan博客 | 袁辉辉的技术博客