结构化技能——特征筛选
特征筛选
- 特征筛选的方法
-
- 基于统计值的特征筛选
- 利用方差
- 利用相关性
- 利用线性模型
- 迭代消除
- 排列重要性(Permutation Importance)
- 基于模型的特征筛选
特征筛选就是在已有的特征中,筛选出最具有代表的一部分特征来进行接下来的学习
通常,我们通过加入特征,模型的精度的变化来判断该特征的重要性
特征筛选的方法
基于统计值的特征筛选
利用方差
方差主要计算特征的统计量(离散程度),结果可能与最终结果有出入(相当于计算数据的离散程度)
sklearn.feature_selection.VarianceThreshold
我们先定义方差的计算方法
from sklearn.feature_selection import VarianceThreshold
X = [[0, 0, 1], [0, 1, 0], [1, 0, 0], [0, 1, 1], [0, 1, 0], [0, 1, 1]]
sel = VarianceThreshold(threshold=(.8 * (1 - .8)))
sel.fit_transform(X)
sel.fit_transform(data.data)
print(data.feature_names[~sel.get_support()])
print(data.feature_names)
利用相关性
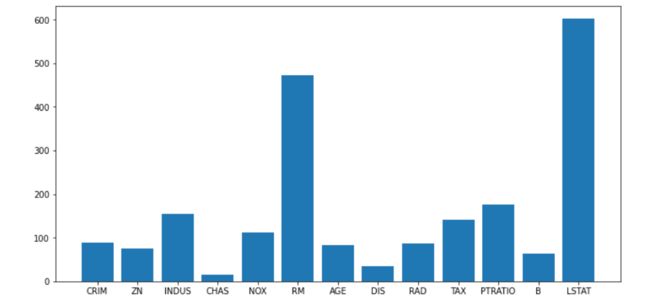
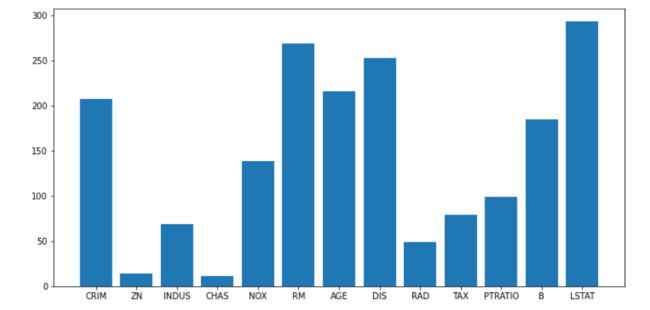
我们直接使用sklearn封装好的包来计算波士顿房价的相关性
from sklearn.datasets import load_iris
from sklearn.feature_selection import SelectKBest
from sklearn.feature_selection import chi2

from sklearn.feature_selection import f_regression
sel = SelectKBest(f_regression, k='all').fit(data.data, data.target)
sel.fit_transform(data.data, data.target)
print(data.feature_names)
print(sel.scores_)
plt.figure(figsize=(12, 6))
plt.bar(range(data.data.shape[1]), sel.scores_)
_ = plt.xticks(range(data.data.shape[1]), data.feature_names)
利用线性模型
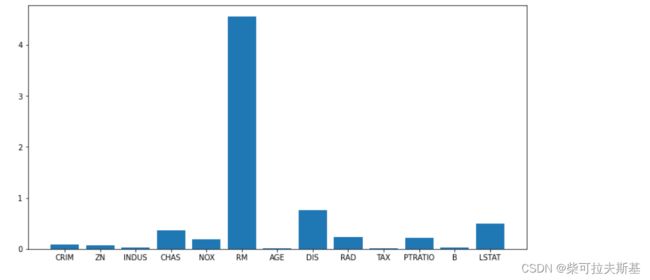
利用线性模型拟合,得出各个特征的重要性
from sklearn.svm import LinearSVR
from sklearn.feature_selection import SelectFromModel

lsvc = LinearSVR().fit(data.data, data.target)
print(data.feature_names)
print(lsvc.coef_)
plt.figure(figsize=(12, 6))
plt.bar(range(data.data.shape[1]), np.abs(lsvc.coef_))
_ = plt.xticks(range(data.data.shape[1]), data.feature_names)
迭代消除
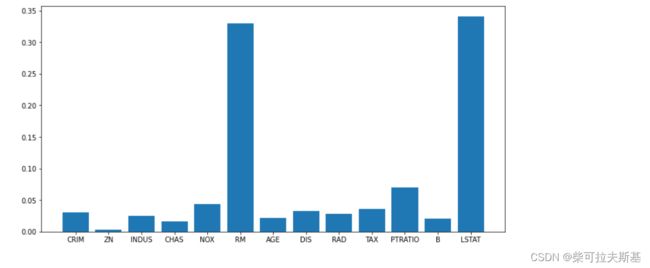
from sklearn.ensemble import ExtraTreesRegressor
from sklearn.feature_selection import SelectFromModel
clf = ExtraTreesRegressor(n_estimators=50)
clf = clf.fit(data.data, data.target)
clf.feature_importances_
plt.figure(figsize=(12, 6))
plt.bar(range(data.data.shape[1]), clf.feature_importances_)
_ = plt.xticks(range(data.data.shape[1]), data.feature_names)
排列重要性(Permutation Importance)
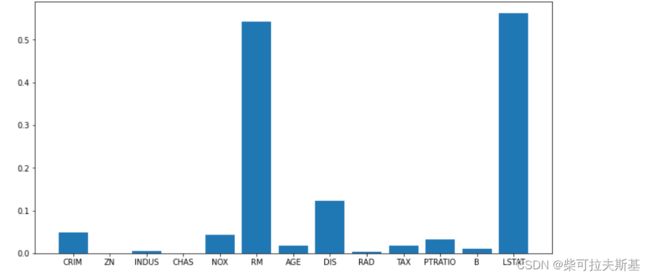
测试特征值的顺序对各个特征的影响
这里我们使用随机森林模型来拟合,使用permutation_importance方法来计算排列重要性,进行10次顺序的打乱
from sklearn.ensemble import ExtraTreesRegressor
from sklearn.inspection import permutation_importance
clf = RandomForestRegressor().fit(data.data, data.target)
result = permutation_importance(clf, data.data, data.target, n_repeats=10,
                                random_state=0)
result.importances_mean
plt.figure(figsize=(12, 6))
plt.bar(range(data.data.shape[1]), result.importances_mean)
_ = plt.xticks(range(data.data.shape[1]), data.feature_names)
基于模型的特征筛选
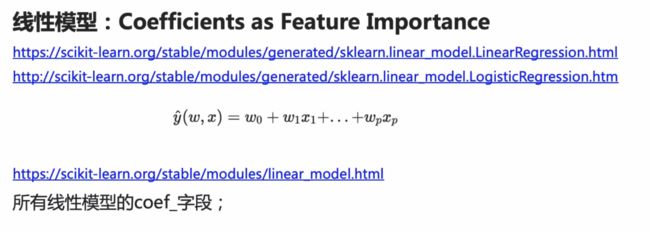
通过线性模型中的权重w来判断特征的重要性

通过树模型中的FeatureImportance来衡量特征的重要性
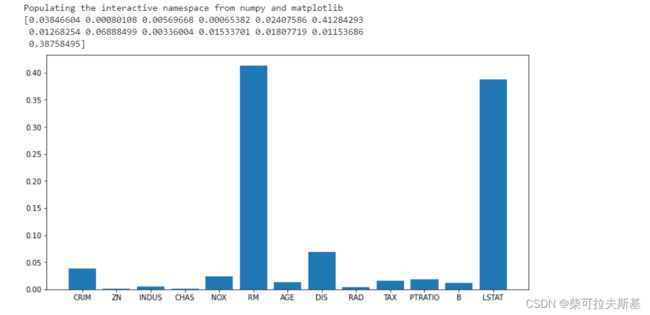
我们以波士顿房价信息为例,使用随机森林来拟合,查看一下各个特征的重要性
%pylab inline
import numpy as np
from sklearn.ensemble import RandomForestRegressor

from sklearn.datasets import load_boston
data = load_boston()

rf = RandomForestRegressor()
rf.fit(data.data, data.target);
print(rf.feature_importances_)

plt.figure(figsize=(12, 6))
plt.bar(range(1, 14), rf.feature_importances_)
_ = plt.xticks(range(1, 14), data.feature_names)
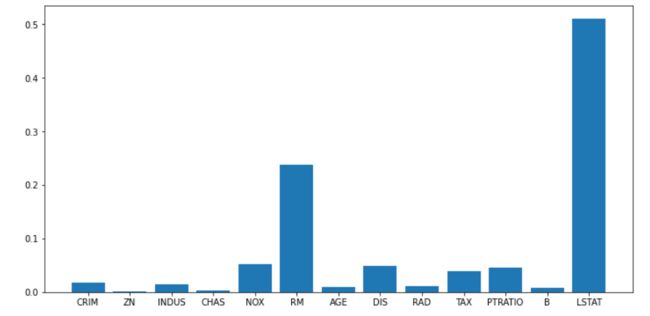
使用lightgbm拟合:
import numpy as np
from lightgbm import LGBMRegressor
data = load_boston()

clf = LGBMRegressor()
clf.fit(data.data, data.target)

plt.figure(figsize=(12, 6))
plt.bar(range(1, 14), clf.feature_importances_)
_ = plt.xticks(range(1, 14), data.feature_names)
import numpy as np
from xgboost import XGBRegressor
data = load_boston()

clf = XGBRegressor()
clf.fit(data.data, data.target)

plt.figure(figsize=(12, 6))
plt.bar(range(1, 14), clf.feature_importances_)
_ = plt.xticks(range(1, 14), data.feature_names)
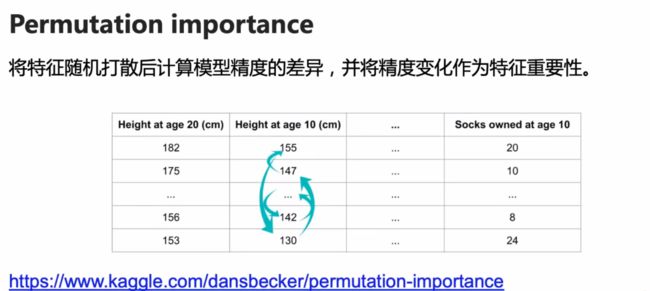
假如某一特征十分重要,打乱该特征的顺序后,它的精度也会下降很多
首先我们需要定义一个函数,先打乱标签,再来计算特征的重要性
# 对数据集计算特征重要性
#
def get_feature_importances(data, target, feaure_name, shuffle, seed=None):

    # Shuffle target if required
    y = target.copy()
    if shuffle:
        np.random.shuffle(y)

    clf = RandomForestRegressor() # 使用随机森林模型计算特征重要性
    clf.fit(data, y)
    imp_df = pd.DataFrame()
    imp_df["feature"] = feaure_name
    imp_df["importance_gain"] = clf.feature_importances_

    return imp_df
记录当前状态下特征的重要性
# 记录正常标签的下特征的重要性
actual_imp_df = get_feature_importances(data.data, data.target, data.feature_names, False)
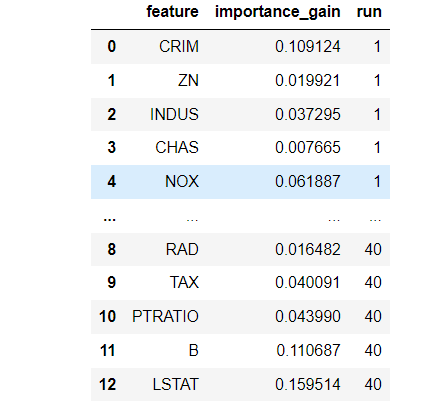
将打乱40次标签的结果进行拼接
null_imp_df = pd.DataFrame()
nb_runs = 40
import time
start = time.time()
dsp = ''
for i in range(nb_runs):
    # Get current run importances

    imp_df = get_feature_importances(data.data, data.target, data.feature_names, True)
    imp_df['run'] = i + 1

    # Concat the latest importances with the old ones
    null_imp_df = pd.concat([null_imp_df, imp_df], axis=0)

    # Erase previous message
    for l in range(len(dsp)):
        print('\b', end='', flush=True)
    # Display current run and time used
    spent = (time.time() - start) / 60
    dsp = 'Done with %4d of %4d (Spent %5.1f min)' % (i + 1, nb_runs, spent)
    print(dsp)
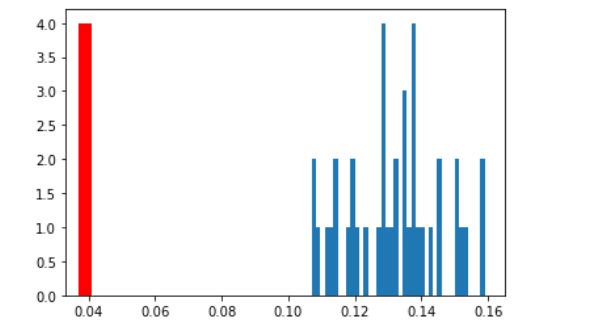
分别对结果进行绘图:
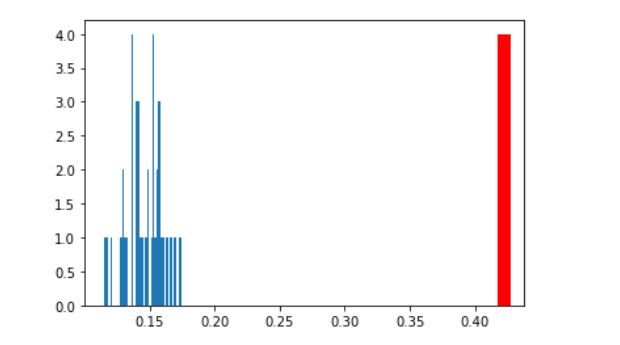
feat = 'RM'
ax = plt.hist(null_imp_df[null_imp_df['feature'] == feat]['importance_gain'], bins=nb_runs)

plt.vlines(x=actual_imp_df.loc[actual_imp_df['feature'] == feat, 'importance_gain'].mean(),
               ymin=0, ymax=np.max(ax[0]), color='r',linewidth=10, label='Real Target')
feat = 'CRIM'
ax = plt.hist(null_imp_df[null_imp_df['feature'] == feat]['importance_gain'], bins=nb_runs)
plt.vlines(x=actual_imp_df.loc[actual_imp_df['feature'] == feat, 'importance_gain'].mean(),
               ymin=0, ymax=np.max(ax[0]), color='r',linewidth=10, label='Real Target')
上面两幅图可以看出,RM原始特征重要性远大于打乱后的特征重要性;而CRIM则相反
由此可知,RM的特征相对来说更加重要
null_imp_df


