《Python 计算机视觉编程》学习笔记(一)
《Python计算机视觉编程》
文章目录
- 前言
- 第 1 章 基本的图像操作和处理
-
- 引言
- 1.1 PIL: Python图像处理类库
-
- 图像读取、显示、显示对应灰度图
- 更改图像格式(后缀)
- 创建缩略图
- 复制和粘贴图像区域
- 调整尺寸和旋转
- 1.2 Matplotlib
-
- 绘制图像、 点和线
- 图像轮廓和直方图
- 交互式标注
- 1.3 NumPy
-
- 图像数组表示
- 灰度变换
- 直方图均衡化
- 图像的主成分分析( PCA)
- 1.4 SciPy
-
- 图像模糊
- 图像导数
- 形态学: 对象计数
- 一些有用的SciPy模块
-
- 读写.mat文件
- 以图像形式保存数组
- 1.5 高级示例: 图像去噪
-
-
- ROF模型
-
- 1.6小结
前言
计算机视觉是一门对图像中信息进行自动提取的学科。
计算机视觉有时试图模拟人类视觉,有时使用数据和统计方法,而有时几何是解决问题的关键。
第 1 章 基本的图像操作和处理
引言
1.1 PIL: Python图像处理类库
PIL( Python Imaging Library Python,图像处理类库)提供了通用的图像处理功能,以及大量有用的基本图像操作。
图像读取、显示、显示对应灰度图
from PIL import Image
from time import *

def main():
    # 读取一幅图像
    pil_im = Image.open('empire.jpg')
    # 读取一幅图像,并将其转换成灰度图像,
    pil_imL = Image.open('empire.jpg').convert('L')
    pil_im.show()
    pil_imL.show()

    return

if __name__ == '__main__':

    timeStart = time()
    main()
    timeOver = time()
    print("program running time is :",timeOver - timeStart)
原图如下:

程序运行后输出结果如下:

一张为正常彩色图片,一张为转换后的灰度图片。
我使用的Python版本为3.8所以书中的代码没法直接使用,需要调整一下。
更改图像格式(后缀)
def changeFormat():
   	"""
	    函数功能:修改图像格式
	    参数说明:无
	    函数返回:无
    """

    filelist = get_imlist(r"D:\python\exercise_data\ComputerVision\ch01\figure")
    # 遍历整个文件夹查找出路径中符合条件的图像文件
    for infile in filelist:
        # 对原图像文件的格式进行修改
        outfile = os.path.splitext(infile)[0] + '.png'
        # 判断是否修改成功,成功则进行save()方法
        if infile !=outfile:
            try:
                Image.open(infile).save(outfile)
            except IOError:
                print("cannot convert",infile)
    return
def main():

    # readAndShow()
    changeFormat()

    return

if __name__ == '__main__':

    timeStart = time()
    main()
    timeOver = time()
    print("program running time is :",timeOver - timeStart)
创建缩略图
def thumbnail():
    """
        函数功能:生成缩略图
        参数说明:无
        函数返回:无
    """
    op_image = Image.open(r'./figure/empire.jpg')

    plt.subplot(121)
    plt.imshow(op_image)
    plt.title("original")
    # 输出原图
    op_image.thumbnail((128, 128))
    #图像缩略处理,指定大小为128*128
    plt.subplot(122)
    plt.imshow(op_image)
    plt.title("result")

    plt.show()

    return
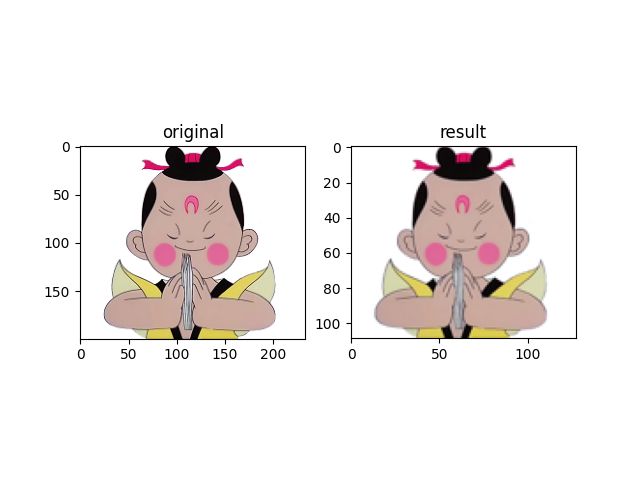
对比上图,不难发现缩略后的图片看起来比较模糊,而且坐标尺寸也小于原图。
复制和粘贴图像区域
def copyAndPaste(op_image):
    """
        函数功能:复制粘贴一幅图片中的部分内容
        参数说明:op_image__已打开的图片
        函数返回:无
    """

    box = (50, 50, 200, 200)
    # 元组给出裁剪区域
    re_img = op_image.crop(box)
    # 利用crop方法进行图片裁剪
    axes = subplot(121)
    imshow(op_image), title("original")

    subplot(122)
    imshow(re_img), title("result")
    show()
    return

def main():
    op_image = Image.open(r'./figure/empire.jpg')

    # readAndShow()
    # changeFormat()
    # thumbnail()
    copyAndPaste(op_image)

    return
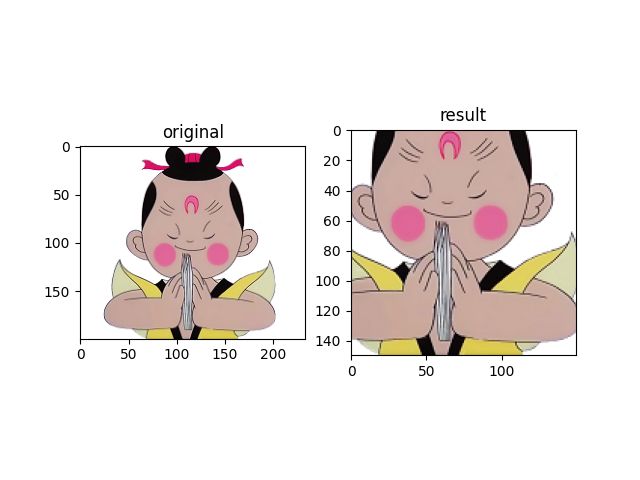
上图可以看到输出结果为原图的部分,对比坐标就是 (50, 50,200, 200) 四条线包围的部分。
调整尺寸和旋转
def adjustAndRotate(or_image):
    """
        函数功能:调整图片尺寸和旋转
        参数说明:or_image__已打开的图片
        函数返回:无
    """

    size = (128,128)

    # resize()用以调整图片的大小,参数为元组
    out_image1 = or_image.resize(size)

    # rotate()用以对图像进行旋转,参数为(0-360)
    out_image2 = or_image.rotate(180)

    subplot(131)
    imshow(or_image), title('original')

    subplot(132)
    imshow(out_image1), title('resize')

    subplot(133)
    imshow(out_image2), title('rotate')

    show()

    return
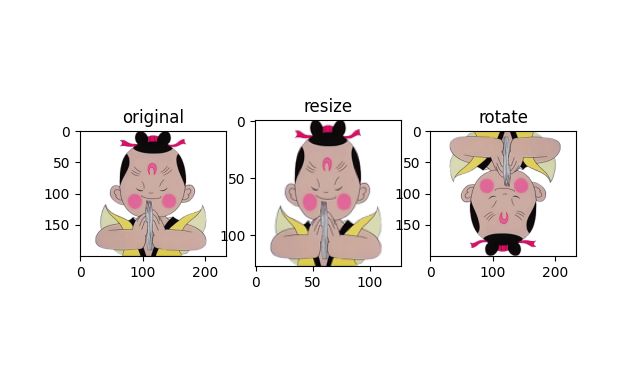
上图分别展示的是原图、调整了尺寸的图像,可以看到坐标有差异。最后是将图片旋转了90度后的图片。
1.2 Matplotlib
Matplotlib是个很好的类库,具有比 PIL 更强大的绘图功能。
绘制图像、 点和线
def plotPointAndLine(or_image):
    """
    函数功能:在绘制的图片上绘制线
    参数说明:or_image__已打开的图片
    函数返回:无
    """
    # 将图像转换为数组
    img = array(or_image)

    imshow(img)

    x = [10, 50, 100, 200]
    y = [20, 50, 150, 180]
    # 根据给出的坐标绘制红色点
    plot(x, y, "r*")
    # 绘制连接4个点的线
    plot(x[:4], y[:4])
    title('plotting')
    show()

    return
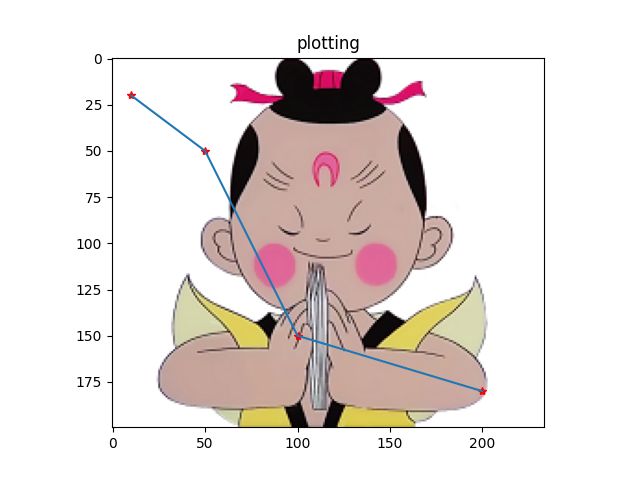
如上图所示,底图是“蛋生”,蛋生上的线条就是我们绘制的线条。
加了坐标轴看起来可能不舒服,我们就使用 axis(‘off’)来关闭坐标轴。
 # 将图像转换为数组
 img = array(or_image)
 imshow(img)
 x = [10, 50, 100, 200]
 y = [20, 50, 150, 180]
 # 根据给出的坐标绘制红色点
 plot(x, y, "r*")
 # 绘制连接4个点的线
 plot(x[:4], y[:4])
 title('plotting')
 axis('off')
 show()
使用还是之前的代码,增加一行就可以。输出结果如下:

此时照片就不含有坐标轴。
图像轮廓和直方图
def outlineAndHistogram(fileName):
    """
    函数功能:绘制图像轮廓和直方图
    参数说明:fileName__图像存储路径
    函数返回:无
    """

    # 读取图像至数组中,并将其转为灰度图像
    im = array(Image.open(fileName).convert('L'))
    re_im = Image.open(fileName)

    subplot(131)
    imshow(re_im), title('original')

    subplot(132)
    gray()
    # 不使用颜色信息
    contour(im, origin='image')
    # 在原点的左上角显示轮廓图像
    axis('off')
    axis('equal')

    subplot(133)
    # 直方图绘制
    # flatten() 方法将任意数组按照行优先准则转换成一维数组。
    hist(im.flatten(), 128)
    show()
    return
输出如下:
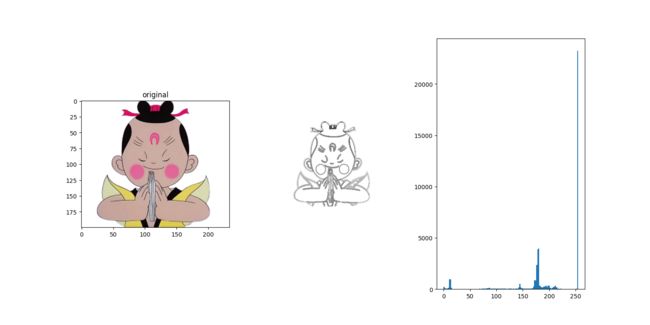
最左侧的是原图,中间的是原图对应的轮廓线,我们可以清晰的看到。最右侧的是图像对饮过得直方图的统计。可以大致得到图像灰度值的分部。
交互式标注
def markPoint(fileName):
    """
    函数功能:给出点击点的坐标
    参数说明:fileName__图像存储路径
    函数返回:无
    """
    im = array(Image.open(fileName))
    imshow(im)
    while(True):
        print("please click 3 points")
        x = ginput(3)
        print("you click:", x)
        matData = mat(x)

        # 这里取得是列所以要转
        axis_x = matData[:,0]
        axis_y = matData[:,1]

        # [item[i] for item in a]

        plot(axis_x.flatten(), axis_y.flatten(), "o")
        # 三个点的横坐标过近时,就退出
        pointDistance = axis_x[0][0]-axis_x[1][0]+axis_x[2][0]-axis_x[1][0]
        if pointDistance < 100:
            print('quit :',pointDistance)
            break
    show()
    return
输出结果如下:

图像上三个桔绿蓝的点是我们点点击的位置,程序输出的位置为:
[(74.50865800865802, 69.19696969696969), (142.04112554112555, 95.17099567099567), (83.59956709956711, 121.57792207792207)]
目测一下坐标是对的上的。
1.3 NumPy
Numpy是非常有名的 Python 科学计算工具包,其中包含了大量有用的思想,比如数组对象(用来表示向量、矩阵、图像等)以及线性代数函数。
图像数组表示
def imageArray(fileName):
    """
    函数功能:图像数组表示
    参数说明:fileName__图像存储路径
    函数返回:无
    """
    img0 = array(Image.open(fileName))
    print(img0.shape, img0.dtype)
    img = array(Image.open(fileName).convert('RGB'))
    # RGB
    print(img.shape, img.dtype)
    img1 = array(Image.open(fileName).convert('1'))
    # 二值图像非0即1,故数据类型为bool型
    print(img1.shape, img1.dtype)
    img2 = array(Image.open(fileName).convert('L'))
    # 灰度图,灰度值在0-255之间,且为设定其数据类型,array自动判定为uint8型
    print(img2.shape, img2.dtype)
    img3 = array(Image.open(fileName).convert('L'), 'f')
    # 灰度图,‘f’设定其数据类型为float类型,故显示为float32
    print(img3.shape, img3.dtype)

    return
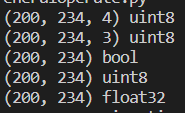
输出与注释一致。就是将图片信息按照我们的要求读取出来后,存储到一个数组中,彩色图像是三维数组,因为包含RGB三色。灰度图像就是二维数组。每一个点代表图像中的每一个像素点。所以我们访问图片数组就是在访问每一个像素点。
灰度变换
def grayChange(fileName):
    """
    函数功能:图像灰度变换
    参数说明:fileName__图像存储路径
    函数返回:无
    """
    or_img = array(Image.open(fileName))
    # 灰度变换
    gr_img = array(Image.open(fileName).convert('L'))
    # 对灰度图进行反相处理
    gr_img1 = 255 - gr_img
    # 将图像的像素转变到100-200区间
    gr_img2 = (100.0/255) * gr_img + 100
    # 将灰度图像的像素求平方
    gr_img3 = 255.0 * (gr_img/255.0)**2

    subplot(231)
    imshow(or_img), title('origin')

    subplot(232)
    gray()
    imshow(gr_img), title('gray')

    subplot(233)
    gray()
    imshow(gr_img1), title('gray_re')

    subplot(234)
    gray()
    imshow(gr_img2), title('gray(100-200)')

    subplot(235)
    imshow(gr_img3), title('gray**2')
    show()

    return
输出如下:

如上图所示,展示的为从原图变换后得到的各种灰度图。按从左往右,从上往下的顺序,原图之后是灰度图,直接调用程序中的转换函数得到。接下来是反相,可以看到在灰度图中暗的部分现在变成了亮色,而原本亮的地方这里变成了黑色。接下来是对灰度值进行了一个归一化,变化到100-200范围内,可以发现图片的对比度有了提升,原本暗的地方更暗,亮的地方也更亮。最后一个是对灰度值进行了平方操作,整体图像更加偏暗了。
直方图均衡化
直方图均衡化是指将一幅图像的灰度直方图变平,使变换后的图像中每个灰度值的分布概率都相同。在对图像做进一步处理之前,直方图均衡化通常是对图像灰度值进行归一化的一个非常好的方法,并且可以增强图像的对比度。之前的灰度变换中将灰度值变到100-200就能看到。
直方图均衡化的变换函数是图像中像素值的累积分布函数( cumulative distribution function, 简写为 cdf,将像素值的范围映射到目标范围的归一化操作)。
def histequal(fileName):
    """
    函数功能:直方图均衡化
    参数说明:fileName__图像存储路径
    函数返回:无
    """
    img = array(Image.open(fileName).convert('L'))
    img2, cdf = histeq(img)

    subplot(231)
    hist(img.flatten(), 128)

    subplot(234)
    gray()
    imshow(img), title('gray')

    subplot(233)
    hist(img2.flatten(), 128)

    subplot(232)
    gray()
    plot(cdf, 'b-')

    subplot(236)
    gray()
    imshow(img2), title('gray_ch')
    show()

    return
左侧为原始图像和直方图,中间图为灰度变换函数,右侧为直方图均衡化后的图像和相应直方图。明显差异就是均衡过后的图像对比度变大。
图像平均操作是减少图像噪声的一种简单方式,通常用于艺术特效。
图像的主成分分析( PCA)
PCA( Principal Component Analysis,主成分分析)是一个非常有用的降维技巧。它可以在使用尽可能少维数的前提下,尽量多地保持训练数据的信息
这部分可以参考《机器学习实战》利用PCA来简化数据这里面有PCA更详细的说明。区别在于我们现在在分析图片,而里面是对于矩阵的处理。
1.4 SciPy
SciPy是建立在 NumPy 基础上,用于数值运算的开源工具包。SciPy 提供很多高效的操作,可以实现数值积分、优化、统计、信号处理,以及对我们来说最重要的图像处理功能。
图像模糊
图像的高斯模糊是非常经典的图像卷积例子。本质上,图像模糊就是将(灰度)图像 I 和一个高斯核进行卷积操作:
其中 * 表示卷积操作; Gσ 是标准差为 σ 的二维高斯核,定义为 :
I σ = I ∗ G σ \boldsymbol{I}_{\sigma}=\boldsymbol{I} * G_{\sigma} Iσ=I∗Gσ
其中 * 表示卷积操作; G σ G_σ Gσ 是标准差为 σ 的二维高斯核,定义为 :
G σ = 1 2 π σ e − ( x 2 + y 2 ) / 2 σ 2 G_{\sigma}=\frac{1}{2 \pi \sigma} \mathrm{e}^{-\left(x^{2}+y^{2}\right) / 2 \sigma^{2}} Gσ=2πσ1e−(x2+y2)/2σ2
def dimImage(fileName):
    """
    函数功能:直方图均衡化
    参数说明:fileName__图像存储路径
    函数返回:无
    """
    # 灰度图像的模糊处理
    img = array(Image.open(fileName).convert('L'))
    img_re0 = filters.gaussian_filter(img, 2)
    img_re1 = filters.gaussian_filter(img, 5)
    img_re2 = filters.gaussian_filter(img, 10)

    # 彩色图像的模糊处理
    img_or = array(Image.open(fileName))

    img_or2 = zeros(img_or.shape)

    # guassian_filter() 函数的最后一个参数表示标准差
    img_or2= filters.gaussian_filter(img_or, 1)

    img_or2 = uint8(img_or2)

    subplot(231)
    imshow(img_or), title('original')

    subplot(233)
    imshow(img_or2), title('rgb——1')

    subplot(234)
    gray()
    imshow(img_re1), title('gray——2')

    subplot(235)
    gray()
    imshow(img_re2), title('gray——5')

    subplot(236)
    gray()
    imshow(img_re2), title('gray——10')

    show()
输出如下:
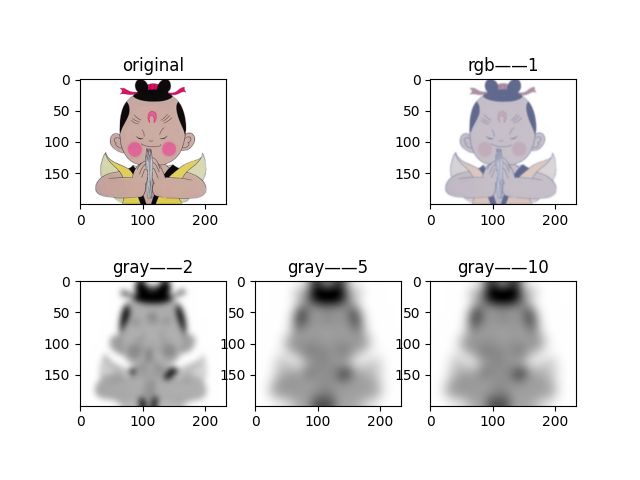
从上图可知随着 σ 的增加,一幅图像被模糊的程度越大。σ越大,处理后的图像细节丢失越多。
图像导数
在很多应用中图像强度的变化情况是非常重要的信息。强度的变化可以用灰度图像 I I I(对于彩色图像,通常对每个颜色通道分别计算导数)的x和y方向导数 I x I_x Ix和 I y I_y Iy进行描述。图像的梯度向量为 ∇ I = [ I x , I y ] T \nabla \boldsymbol{I}=\left[\boldsymbol{I}_{x}, \boldsymbol{I}_{y}\right]^{T} ∇I=[Ix,Iy]T 。梯度有两个重要的属性,一是梯度的大小: ∣ ∇ I ∣ = I x 2 + I y 2 |\nabla \boldsymbol{I}|=\sqrt{\boldsymbol{I}_{x}^{2}+\boldsymbol{I}_{y}^{2}} ∣∇I∣=Ix2+Iy2它描述了图像强度变化的强弱,一是梯度的角度:
α = arctan 2 ( I y , I x ) \alpha=\arctan 2\left(\boldsymbol{I}_{y}, \boldsymbol{I}_{x}\right) α=arctan2(Iy,Ix)
描述了图像中在每个点(像素)上强度变化最大的方向。
我们可以用离散近似的方式来计算图像的导数。图像导数大多数可以通过卷积简单地实现: I x = I ∗ D x 和 I y = I ∗ D y \boldsymbol{I}_{x}=\boldsymbol{I} * D_{x} \text { 和 } \boldsymbol{I}_{y}=\boldsymbol{I} * D_{y} Ix=I∗Dx 和 Iy=I∗Dy
对于 D x D_x Dx和 D y D_y Dy ,通常选择 Prewitt 滤波器:
D x = [ − 1 0 1 − 1 0 1 − 1 0 1 ] 和 D y = [ − 1 − 1 − 1 0 0 0 1 1 1 ] D_{x}=\left[\begin{array}{lll} -1 & 0 & 1 \\ -1 & 0 & 1 \\ -1 & 0 & 1 \end{array}\right] \text { 和 } D_{y}=\left[\begin{array}{rrr} -1 & -1 & -1 \\ 0 & 0 & 0 \\ 1 & 1 & 1 \end{array}\right] Dx=⎣ ⎡−1−1−1000111⎦ ⎤ 和 Dy=⎣ ⎡−101−101−101⎦ ⎤
或者 Sobel 滤波器: D x = [ − 1 0 1 − 2 0 2 − 1 0 1 ] 和 D y = [ − 1 − 2 − 1 0 0 0 1 2 1 ] D_{x}=\left[\begin{array}{lll} -1 & 0 & 1 \\ -2 & 0 & 2 \\ -1 & 0 & 1 \end{array}\right] \text { 和 } D_{y}=\left[\begin{array}{ccc} -1 & -2 & -1 \\ 0 & 0 & 0 \\ 1 & 2 & 1 \end{array}\right] Dx=⎣ ⎡−1−2−1000121⎦ ⎤ 和 Dy=⎣ ⎡−101−202−101⎦ ⎤
def representativeFilters(fileName):
    """
    函数功能:典型滤波
    参数说明:fileName__图像存储路径
    函数返回:无
    """

    img = array(Image.open(fileName).convert('L'))
    # Sobel滤波器
    img_x = zeros(img.shape)
    # sobel() 函数的第二个参数表示选择 x 或者 y 方向导数,第三个参数保存输出的变量。
    imgX = filters.sobel(img, 1, img_x)
    img_y = zeros(img.shape)
    imgY = filters.sobel(img, 0, img_y)
    # 梯度
    magnitude = sqrt(img_x**2+img_y**2)
    subplot(221)
    imshow(img, cmap='gray'), title('original')
    subplot(222)
    imshow(imgX, cmap='gray'), title('x')
    subplot(223)
    imshow(imgY, cmap='gray'), title('y')
    subplot(224)
    imshow(magnitude, cmap='gray'), title('magnitude')
    show()

    return
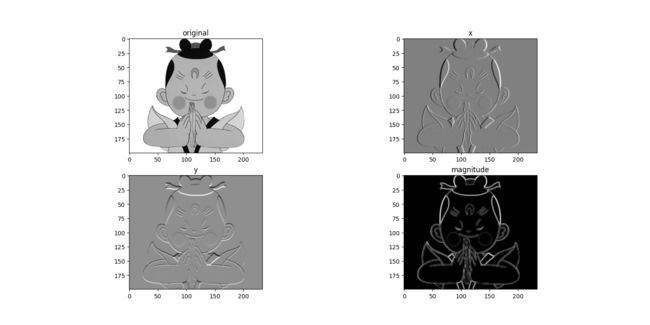
上图从左往右从上往下依次为原始灰度图像;x方向导数图像;y方向导数图像;梯度大小图像。在两个导数图像中,正导数显示为亮的像素,负导数显示为暗的像素。灰色区域表示导数的值接近于零。
可以看到亮的地方大多为有明显对比色差的地方。
为了在图像噪声方面更稳健,以及在任意尺度上计算导数,我们可以使用高斯导数滤波器: I x = I ∗ G σ x 和 I y = I ∗ G σ y \boldsymbol{I}_{x}=\boldsymbol{I}^{*} G_{\sigma x} \text { 和 } \boldsymbol{I}_{y}=\boldsymbol{I}^{*} G_{\sigma y} Ix=I∗Gσx 和 Iy=I∗Gσy
G σ x G_σx Gσx 和 G σ y G_σy Gσy表示 G σ G_σ Gσ在 x 和 y 方向上的导数, G σ G_σ Gσ 为标准差为 σ 的高斯函数。
def gaussian(img, sigma):
    """
    函数功能:高斯滤波
    参数说明:img__图像
             sigma__高斯滤波参数
    函数返回:无
    """
    img_x = zeros(img.shape)
    imgx = filters.gaussian_filter(img, (sigma, sigma),(0, 1), img_x)
    img_y = zeros(img.shape)
    imgy = filters.gaussian_filter(img, (sigma, sigma),(1, 0), img_y)
    magnitude = sqrt(img_x ** 2 + img_y ** 2)
    return imgx, imgy, magnitude


def guassianFilter(fileName):
    """
    函数功能:高斯滤波对比
    参数说明:fileName__图像存储路径
    函数返回:无
    """
    img_or = array(Image.open(fileName).convert('L'))
    gray()
    imgx1, imgy1, magnitude1 = gaussian(img_or, 2)
    imgx2, imgy2, magnitude2 = gaussian(img_or, 5)
    imgx3, imgy3, magnitude3 = gaussian(img_or, 10)
    subplot(341)
    imshow(img_or), title('a'), axis('off')
    subplot(342)
    imshow(imgx1), title('b'), axis('off')
    subplot(343)
    imshow(imgx2), title('c'), axis('off')
    subplot(344)
    imshow(imgx3), title('d'), axis('off')
    subplot(345)
    imshow(img_or), title(''), axis('off')
    subplot(346)
    imshow(imgy1), title(''), axis('off')
    subplot(347)
    imshow(imgy2), title(''), axis('off')
    subplot(348)
    imshow(imgy3), title(''), axis('off')
    subplot(349)
    imshow(img_or), title(''), axis('off')
    subplot(3, 4, 10)
    imshow(magnitude1), title(''), axis('off')
    subplot(3, 4, 11)
    imshow(magnitude2), title(''), axis('off')
    subplot(3, 4, 12)
    imshow(magnitude3), title(''), axis('off')
    show()
    return
输出如下:

使用高斯导数计算图像导数: x 导数图像(上), y 导数图像(中),以及梯度大小图像(下);( a)为原始灰度图像,( b)为使用 σ=2 的高斯导数滤波器处理后的图像,( c)为使用 σ=5 的高斯导数滤波器处理后的图像,( d)为使用 σ=10 的高斯导数滤波器处理后的图像
形态学: 对象计数
形态学(或数学形态学)是度量和分析基本形状的图像处理方法的基本框架与集合。形态学通常用于处理二值图像,但是也能够用于灰度图像。 二值图像是指图像的每个像素只能取两个值,通常是 0 和 1。二值图像通常是,在计算物体的数目,或者度量其大小时,对一幅图像进行阈值化后的结果。
def binaryImage(fileName):
    """
    函数功能:二值图像
    参数说明:fileName__图像存储路径
    函数返回:无
    """
    img = array(Image.open(fileName).convert('L'))
    gray()

    subplot(221)
    imshow(img), title('original')
    img = 1*(img < 128)
    # ndimage.measurements.label(input, structure=None, output=None)
    # 输入一个数组,数组中非0值被认为是目标区域,0值是背景区域
    # 输出:label:一个被已经分好连通域的label图像:
    # num_feartures:统计一共有多少种连通分量的数量,例如数字5代表一共有5种,ID分别是1,2,3,4,5
    labels, nbr_objects = measurements.label(img)
    print("number of objects:", nbr_objects)

    subplot(222)
    imshow(labels), title('the picture after label')
    # binary_opening() 函数的第二个参数指定一个数组结构元素。该数组表示以一个像素为中心时,
    # 使用哪些相邻像素。在这种情况下,我们在 y 方向上使用 9 个像素(上面 4 个像素、像素本身、下面 4 个像素),
    # 在 x 方向上使用 5 个像素。
    # iterations 决定执行该操作的次数。
    img_open = morphology.binary_opening(img, ones((9, 5)), iterations=2)

    subplot(223)
    imshow(img_open), title('open')
    labels_open, nbr_objects_open = measurements.label(img_open)
    print("number of objects:",nbr_objects_open)

    subplot(224)
    imshow(labels_open), title('result')
    show()
    return
一些有用的SciPy模块
读写.mat文件
Matlab的 .mat 文件格式存储,那么可以使用 scipy.io 模块进行读取
data = scipy.io.loadmat('test.mat')
data 对象包含一个字典,字典中的键对应于保存在原始 .mat 文件中的变量名。由于这些变量是数组格式的,因此可以很方便地保存到 .mat 文件中。你仅需创建一个字典(其中要包含你想要保存的所有变量),然后使用savemat() 函数:
data = {}
data['x'] = x
scipy.io.savemat('test.mat',data)
以图像形式保存数组
因为我们需要对图像进行操作,并且需要使用数组对象来做运算,所以将数组直接保存为图像文件非常有用。imsave() 函数可以从 scipy.misc 模块中载入。要将数组 im 保存到文件中,可以使用
下面的命令:
from scipy.misc import imsave
imsave('test.jpg',im)
#该脚本返回一个 512× 512 的灰度图像数组。
lena = scipy.misc.lena()
1.5 高级示例: 图像去噪
图像去噪是在去除图像噪声的同时,尽可能地保留图像细节和结构的处理技术。我们这里使用 ROF( Rudin-Osher-Fatemi) 去噪模型。ROF 模型具有很好的性质:使处理后的图像更平滑,同时保持图像边缘和结构信息。
ROF模型
一幅(灰度)图像 I I I的全变差(Total Variation,TV)定义为梯度范数之和。在连续表示的情况下,全变差表示为: J ( I ) = ∫ ∣ ∇ I ∣ d x J(\boldsymbol{I})=\int|\nabla \boldsymbol{I}| \mathrm{d} \mathbf{x} J(I)=∫∣∇I∣dx
在离散表示的情况下,全变差表示为:
J ( I ) = ∑ x ∣ ∇ I ∣ J(\boldsymbol{I})=\sum_{\mathbf{x}}|\nabla \boldsymbol{I}| J(I)=x∑∣∇I∣
其中,上面的式子是在所有图像坐标 x=[x, y] 上取和。
在 Chambolle 提出的 ROF 模型里,目标函数为寻找降噪后的图像 U,使下式最小: min U ∥ I − U ∥ 2 + 2 λ J ( U ) \min _{U}\|\boldsymbol{I}-\boldsymbol{U}\|^{2}+2 \lambda J(\boldsymbol{U}) Umin∥I−U∥2+2λJ(U)
其中范数|| I − U I-U I−U || 是去噪后图像 U 和原始图像 I I I差异的度量。也就是说,本质上该模型使去噪后的图像像素值“平坦”变化,但是在图像区域的边缘上,允许去噪后的图像像素值“跳跃”变化。
ROF模型去噪代码实现:
def imageFilter(fileName):
    """
    函数功能:图像去噪
    参数说明:fileName__图像存储路径
    函数返回:无
    """

    img = array(Image.open(fileName).convert('L'))
    gray()
    # 添加噪声
    # 括号里的参数要换成和图片一样大小的。
    img = img + 30*standard_normal((200,234))

    U, T = denoise(img, img)

    G = filters.gaussian_filter(img, 5)
    subplot(131)
    imshow(img), title('original'),axis('off')
    subplot(132)
    imshow(U), title('rof'),axis('off')
    subplot(133)
    imshow(G), title('gaussian'),axis('off')

    show()

    return
输出如下:

对比rof滤波和告诉滤波。rof整体图像虽然也是糊的,但是他的边缘信息保留的比较突出。对比高斯滤波整个图形都是模糊的。
1.6小结
本章内容很杂,介绍图像读取、显示、局部操作、保存、滤波等等基本操作。虽然繁多但是都是最基本的操作。是我们后续进行对图片进一步处理的基础。
本章用到的代码(我使用的Python是3.8的,有需要自取):
链接:https://pan.baidu.com/s/1SjJn4a6P7GgpvKS0uXqRhQ?pwd=jbmf
提取码:jbmf

