【机器学习kaggle赛事】泰坦尼克号生存预测
写在前面
回顾这个项目的基本流程:
1、查看数据集,合并训练集测试集以一起进行数据清洗
2、数据清洗:查看数据集空缺值,并填充空缺值
3、探索性可视化:通过透视表和图表,探究各个特征与label(需要预测的值)的相关性,若有相关性则保留。
4、特征工程:
- 若特征为离散型特征(类别型特征)(Name,Pclass,Embarked,Sex等),则进行独热编码,若特征为连续型数值(Fare,Age),则对特征数值进行分组,并对不同组别进行赋值,再进行Ont_hot编码处理
- 属性几乎相同的多个特征(如SibSp: 乘客在船上的兄妹姐妹数/配偶数,Parch: 乘客在船上的父母数/子女数都属于亲人),在分别探究其与label的相关性决定保留后,可以将它们重组为新的特征。
4、特征选择:通过相关系数来选择
数据集情况查看
将训练数据与测试数据连接起来,以便一起进行数据清洗。
import numpy as np
import pandas as pd
import matplotlib.pyplot as plt
import seaborn as sns

train = pd.read_csv('train.csv')
test = pd.read_csv('test.csv')

    # 这里需要注意的是,如果没有后面的ignore_index=True
    #那么index的值在连接后的这个新数据中是不连续的 继续从 0开始,如果要按照index删除一行数据,可能会发现多删一条。
full = pd.concat([train, test], ignore_index=True)
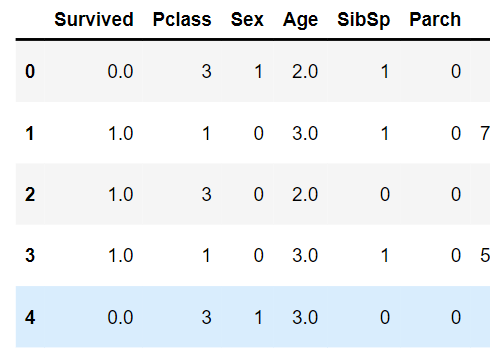
full.head()  # 默认显示5行
PassengerId: 乘客ID;
Survived: 生存情况,0代表不幸遇难,1代表存活;
Pclass: 仓位等级,1为一等舱,2为二等舱,3为三等舱;
Name: 乘客姓名;
Sex: 性别;
Age: 年龄;
SibSp: 乘客在船上的兄妹姐妹数/配偶数(即同代直系亲属数);
Parch: 乘客在船上的父母数/子女数(即不同代直系亲属数);
Ticket: 船票编号;
Fare: 船票价格;
Cabin: 客舱号;
Embarked: 登船港口(S: Southampton; C: Cherbourg Q: Queenstown)
#查看字符型数据情况:
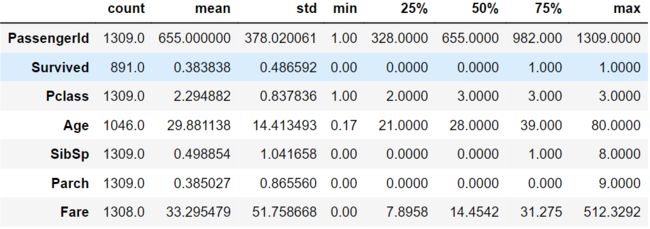
full.describe(include=['O'])
full.describe().T
#describe()函数只能查看数据类型的描述统计信息,无法查看类似字符类型的信息。
#故需用info()函数进一步查看每一列的数据信息。
full.info()数据清洗
print(full.isnull().sum()) # 查看数据的缺失情况
PassengerId       0
Survived        418
Pclass            0
Name              0
Sex               0
Age             263
SibSp             0
Parch             0
Ticket            0
Fare              1
Cabin          1014
Embarked          2
dtype: int64
缺失值 Age 263, Fare 1 ,Cabin 1014, Embarked 2
Embarked:
分类数据,使用最常见的类别取代,用众数填充。
#用众数填补Embarked
#查看众数
full.Embarked.mode()
full['Embarked'].fillna('S',inplace=True)
Fare
船票费用是类别数据,但是不同客舱的票价不同 ,用Fare空缺所在的客舱号的票价中位数来填充
#填补Fare空缺值,用Pclass==3的客舱票价的中位数来填充
full[full.Fare.isnull()]#查看Fare缺失值的信息,获得Pclass
full.Fare.fillna(full[full.Pclass==3]['Fare'].median(),inplace=True)
Age
用中位数来填充年龄
如果是数值类型,使用平均值或者中位数进行填充
#年龄(Age) 最小值为0.17,不存在0值,其数据缺失率为263/1309=20.09%,由于Age的平均数与中位数接近,故选择平均值作为缺失项的填充值。
full.Age.fillna(full.Age.mean(),inplace = True)
# full['Age']=full['Age'].fillna(full['Age'].mean())
full.Age.describe()
'''count    1309.000000
mean       29.881138
std        12.883193
min         0.170000
25%        22.000000
50%        29.881138
75%        35.000000
max        80.000000
Name: Age, dtype: float64'''
Cabin
- 1,用U来填充,表示unkown
字符串类型,按照实际情况填写,无法追踪的信息,用”Unknow”填充。处理Cabin缺失值 U代表Unknow
full['Cabin'] = full['Cabin'].fillna('U')- 2缺失个数:
687 超过75%的数据缺失,故不打算填补。考虑以Cabin是否缺失来构建一个新特征,看是否对生存有影响。若没有影响,则删除该列
full.Cabin.isnull().sum()
#1014

#创造新特征Cabin_exist,判断Cabin与Survived的相关性,相关性不大则删除
full['Cabin_exist'] = full['Cabin'].map(lambda x:"Yes" if type(x)==str else "No")# 判断类型是否相等
full[["Cabin_exist", "Survived"]].groupby("Cabin_exist",as_index=False).mean()
| Cabin_exist | Survived | |
|---|---|---|
| 0 | No | 0.299854 |
| 1 | Yes | 0.666667 |
full =full.drop('Cabin_exist',axis = 1)
full.head()

#将字符转换为数值
full['Cabin_exist'] = full['Cabin'].map(lambda x: 1 if type(x)==str else 0)
full = full.drop('Cabin',axis = 1)
full.head()

# full.loc[full.Cabin.notnull(),'Cabin'] = 1
# full.loc[full.Cabin.isnull(),'Cabin'] = 0
# full.Cabin.isnull().sum()#验证填充效果

sns.barplot(x="Cabin_exist",y="Survived",data=full)
full.isnull().sum()
#数据处理完毕

full.head()
特征工程
1,探究Sex与Survived的相关性
'''======================================================特征工程========================================================================'''
#1,探究Sex与Survived的相关性
full[['Sex','Survived']].groupby('Sex',as_index = False).mean().sort_values('Survived',ascending = False)
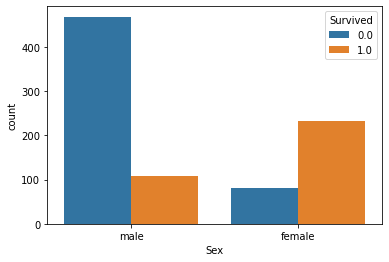
sns.countplot(x = 'Sex',hue = 'Survived',data =full)
#Sex(性别),将字符映射到字符
sex_dict = {'male': 1,'female':0}
full['Sex'] = full['Sex'].map(sex_dict)
full['Sex'].head()
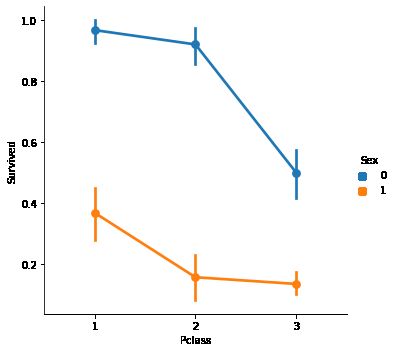
full[["Pclass","Sex","Survived"]].groupby(["Pclass","Sex"],as_index=False).mean().sort_values(by="Survived",ascending=False)
#两维变量关系图
sns.factorplot(x="Pclass",y="Survived",hue="Sex",data=full)2,探究Pcalss与Survived的关联性
 #2,探究Pcalss与Survived的关联性,相关性较高
full[["Pclass","Survived"]].groupby(["Pclass"],as_index = False).mean().sort_values(by="Survived",ascending=False)
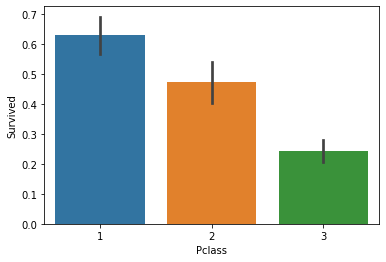
sns.barplot(x="Pclass",y="Survived",data=full)
可以看出,相关性较高,保留特征Pclass
#将客舱类型进行独热编码
PclassDf = pd.get_dummies(full['Pclass'],prefix = 'Pclass')
PclassDf.head()
#将编码后的客舱特征与原数据合并
full = pd.concat([full,PclassDf],axis = 1)
full.head()
#删除Pclass
ful = full.drop('Pclass',axis = 1)
full.head()
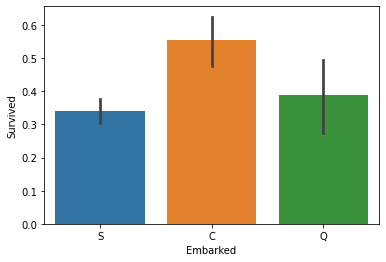
3,Embarked:不同的上船地点对生存率是否有影响
full[["Embarked","Survived"]].groupby("Embarked",as_index=False).count().sort_values("Survived",ascending=False)
sns.barplot(x="Embarked",y="Survived",data=full)
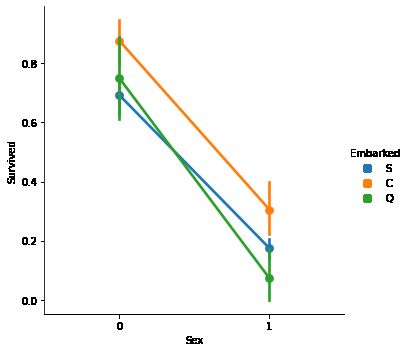
sns.factorplot(x="Sex",y="Survived",hue="Embarked",data=full)
full[["Sex","Survived","Embarked"]].groupby(["Sex","Embarked"],as_index=False).count().sort_values("Survived",ascending=False)
"""S口岸,登船人数644,女性乘客占比46%;C口岸,登船人数168,女性占比接近77%;
Q口岸,登船人数77,女性占比接近88%。
前面已知女性生存率明显高于男性生存率,所以上述问题可能由性别因素引起。"""#对Embarked进行独热编码
EmbarkedDf = pd.get_dummies(full['Embarked'],prefix = 'Embarked')
EmbarkedDf.head()
# 将EmbarkedDf的特征添加至full数据集
full = pd.concat([full,EmbarkedDf],axis = 1)#按列插入数据
full.head()
# 因为已经使用登船港口(Embarked)进行了one-hot编码产生了它的虚拟变量(dummy variables)
# 所以这里把登船港口(Embarked)删掉
full = full.drop('Embarked',axis = 1)
full.head() 4,Name与Survived的相关性
从name里提取title(头衔),地位高的人在灾难里会更有可能获得救援从而得以存活
def getTitle(Name):
    s1 = Name.split(',')[1]#Braund, Mr. Owen Harris	分割完取第二个元素Mr. Owen Harris
    s2 = s1.split('.')[0]#得到Mr
    return s2.strip( ) #strip() 方法用于移除字符串头尾指定的字符(这里是空格)
full['Title'] = full['Name'].map(getTitle)#将getTitle映射给Name  得到Title
full['Title'].value_counts()

full.drop('Name',axis = 1,inplace  = True)
full.head()
将头衔分为五类:
- Officer:政府官员;
- Royalty:王室(皇室);
- Mr:已婚男士;
- Mrs:已婚妇女;
- Miss:年轻未婚女子;
- Master:有技能的人/教师
title_dict={"Capt":"Officer","Col":"Officer","Major":"Officer","Jonkheer":"Royalty","Don":"Royalty","Sir":"Royalty","Dr":"Officer","Rev":"Officer"
            ,"the Countess":"Royalty","Dona":"Royalty","Mme":"Mrs","Mlle":"Miss","Ms":"Mrs","Mr" :"Mr","Mrs" :"Mrs","Miss" :"Miss"
            ,"Master" :"Master", "Lady" : "Royalty"}
full['Title']=full['Title'].map(title_dict)#将title字典映射给name
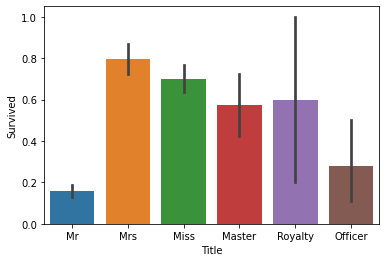
full.head()- title跟Sex有联系,联合起来分析
pd.crosstab(full.Title,full.Sex)#透视表
#探索title与生存的关系
full[["Title","Survived"]].groupby("Title",as_index=False).mean().sort_values("Survived",ascending=False)

sns.barplot(x="Title",y="Survived",data=full)
full['Title'].value_counts()
Mr         757
Miss       262
Mrs        200
Master      61
Officer     23
Royalty      6
Name: Title, dtype: int64
#独热编码
TitleDf = pd.get_dummies(full['Title'],prefix = 'Title')
#添加进full
full = pd.concat([full,TitleDf],axis = 1)
full.head()
#删除不需要的列
full = full.drop(['Title'],axis = 1)
full.head()
5,Cabin与Survived之间的相关性
#客场号的类别值是首字母,因此我们提取客舱号的首字母为特征
# full['Cabin'] = full['Cabin'].map(lambda x : x[0])
# full['Cabin'].value_counts
# full['Cabin']=full['Cabin'].map(lambda x:x[0])
# full['Cabin'].value_counts()
"""因为之前用处理过,所以不再提取首字母,如果用u来填充的话,可以用这种方法"""
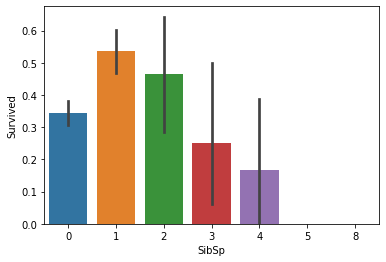
6,探究孤身一人和有家人陪伴的生存率(SibSp,Parch)
full[['SibSp','Survived']].groupby(['SibSp'],as_index = False).mean().sort_values('Survived',ascending = False)
sns.barplot(x = 'SibSp',y = 'Survived',data = full)
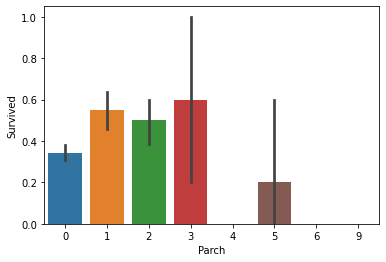
full[["Parch","Survived"]].groupby("Parch",as_index=False).mean().sort_values("Survived",ascending=False)
sns.barplot(x = 'Parch',y = 'Survived',data = full)可以看出SibSp,Parch 跟Survived 有相关联系,所以用SibSp,Parch构建家庭人数和家庭类别的新特征Alone,family_small,family_big
# 构建家庭人数和家庭类别的新特征
full['family'] = full['Parch'] + full['SibSp'] + 1#Parch,SibSp为0时,只有自己一个人,+1
full['Alone'] = np.where(full['family'] == 1,1,0)

full['family_small'] = np.where((full['family']>=2) & (full['family']<=4),1,0)
full['family_big'] = np.where(full['family']>=5,1,0)
full.head()
探究家庭与存活率的关系 证实孤身一人存活率不高
#探究家庭与存活率的关系  证实孤身一人存活率不高
full[['family','Survived']].groupby('family',as_index = False).mean().sort_values('Survived',ascending = False)
sns.barplot(x = 'family',y = 'Survived',data = full)

#孤身一人对生存率是否有影响
full[["Alone","Survived"]].groupby("Alone",as_index = False).mean().sort_values("Survived",ascending=False)
sns.barplot(x="Alone",y="Survived",data=full)

full = full.drop('family',axis = 1)
sns.factorplot(x="Pclass",y="Survived",hue="Alone",data=full)7、探究年龄Age与Survived的相关性
#查看Age的分布情况
sns.violinplot(y="Age",data=full)
#查看生存与死亡乘客的年龄分布
sns.violinplot(y="Age",x="Survived",data=full)
#将年龄分为五组
full['AgeCut'] = pd.cut(full.Age,5)#要用full['AgeCut'],而不是full.AgeCut,这样AgeCut才会在Index里
full.AgeCut.value_counts().sort_index()

full[['AgeCut','Survived']].groupby('AgeCut',as_index = False).mean().sort_values('Survived',ascending = False)
(0.0902, 16.136]    134
(16.136, 32.102]    787
(32.102, 48.068]    269
(48.068, 64.034]    106
(64.034, 80.0]       13
Name: AgeCut, dtype: int64
根据各个分段,重新给Age赋值并进行独热编码
#根据各个分段,重新给Age赋值
full.loc[full.Age <= 16.136,'Age'] = 1
full.loc[(full.Age > 16.136)&(full.Age <=32.102),'Age'] = 2
full.loc[(full.Age > 32.102)&(full.Age <=48.068),'Age'] = 3
full.loc[(full.Age > 48.068)&(full.Age <=64.034),'Age'] = 4
full.loc[full.Age > 64.034,'Age'] = 5
full.head()

AgeDf = pd.get_dummies(full['Age'],prefix =' Age')
full = pd.concat([full,AgeDf],axis = 1)
full = full.drop(['Age','AgeCut'],axis = 1)
full.head()
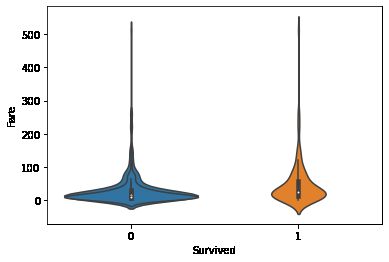
8、Fare与Survived之间的相关性
sns.violinplot(y="Fare",data=train)
#对比生死乘客的票价
sns.violinplot(y="Fare",x="Survived",data=train)
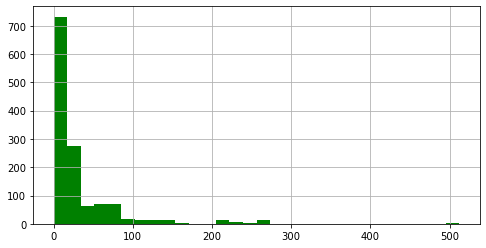
# 当然这里也可以用seaborn的displot进行绘制,但是displot的纵坐标是比率,hist的纵坐标是实际个数count;
# figsize调整画布大小
full['Fare'].hist(color='green', bins=30, figsize=(8,4))
#分组
full['FareCut'] = pd.cut(full.Fare,5)
full.FareCut.value_counts().sort_index()
# full.head()

full[['FareCut','Survived']].groupby('FareCut',as_index = False).mean().sort_values('Survived',ascending = False)
#重新赋值
full.loc[full.Fare<=7.854,'Fare']=1
full.loc[(full.Fare>7.854)&(full.Fare<=10.5),'Fare']=2
full.loc[(full.Fare>10.5)&(full.Fare<=21.558),'Fare']=3
full.loc[(full.Fare>21.558)&(full.Fare<=41.579),'Fare']=4
full.loc[full.Fare>41.579,'Fare']=5
full.head()

#进行独热编码
FareDf = pd.get_dummies(full['Fare'],prefix = 'Fare')
full = pd.concat([full,FareDf],axis = 1)
full = full.drop(['Fare','FareCut'],axis = 1)
full.head()

full = full.drop(['SibSp','Parch','Pclass'],axis = 1)
full.head()
特征选择
"""=============================================特征选择和特征降维========================================================="""
full.info()


corr_df=full.corr()
corr_df

#用图形直观查看线性相关系数
plt.figure(figsize=(16,16))
plt.title("Pearson Correlation of Features")
sns.heatmap(corr_df,linewidths=0.1,square=True,linecolor="white",annot=True,cmap='YlGnBu',vmin=-1,vmax=1)

corr_df['Survived'].sort_values(ascending = False)
Survived 1.000000 Title_Mrs 0.344935 Title_Miss 0.332795 Cabin_exist 0.316912 Pclass_1 0.285904 family_small 0.279855 Fare_5.0 0.266217 Embarked_C 0.168240 Age_1.0 0.121485 Pclass_2 0.093349 Title_Master 0.085221 Fare_4.0 0.058052 Fare_3.0 0.043153 Title_Royalty 0.033391 Age_4.0 0.030350 Age_3.0 0.021711 Embarked_Q 0.003650 Title_Officer -0.031316 Age_5.0 -0.067344 Age_2.0 -0.097245 family_big -0.125147 Embarked_S -0.149683 Fare_1.0 -0.164287 Fare_2.0 -0.198067 Alone -0.203367 Pclass_3 -0.322308 Sex -0.543351 Title_Mr -0.549199 Name: Survived, dtype: float64
构建包含最终选择特征的数据集
最终选择特征如下:
full_x=pd.concat([TitleDf,PclassDf,EmbarkedDf,FareDf,AgeDf,full['Sex'],full['family_small'],full['Cabin_exist']
                  ,full['family_big'],full['Alone']],axis=1)
full_x.head()
分割训练数据和测试数据
#前891行为原始训练数据
source_x=full_x.loc[0:890,:]#提取特征值
source_y=full.loc[0:890,'Survived']#提取标签值
#后418行是test,预测数据
pred_x=full_x.loc[891:,:]
source_x.shape#(891, 23)
source_y.shape#(891,)
pred_x.shape#(418, 23)
构建训练集和数据集
#训练数据集和测试数据集,按照二八原则分为训练数据和测试数据,其中80%为训练数据
from sklearn.model_selection import train_test_split
x_train,x_test,y_train,y_test =train_test_split(source_x,source_y,train_size=0.8)
print('训练数据集特征:{0},训练数据集标签:{1}'.format(x_train.shape,y_train.shape))
print('测试数据集特征:{0},测试数据集标签:{1}'.format(x_test.shape,y_test.shape))


#训练数据集特征:(712, 27),训练数据集标签:(712,)
#测试数据集特征:(179, 27),测试数据集标签:(179,)
#对x_train,x_test进行标准化
from sklearn.preprocessing import StandardScaler
sc = StandardScaler()
x_train_std=sc.fit_transform(x_train)
x_test_std=sc.transform(x_test)不同模型对比
from sklearn.model_selection import cross_val_score

from sklearn.neighbors import KNeighborsClassifier
from sklearn.naive_bayes import GaussianNB
from sklearn.tree import DecisionTreeClassifier
from sklearn.ensemble import RandomForestClassifier
from sklearn.ensemble import GradientBoostingClassifier
from sklearn.svm import SVC

models=[KNeighborsClassifier(),GaussianNB(),DecisionTreeClassifier(),RandomForestClassifier(),
       GradientBoostingClassifier(),SVC()]

# 计算各模型得分
names=['KNN','NB','Tree','RF','GDBT','SVM']
for name, model in zip(names,models):
    score=cross_val_score(model,Xa,y,cv=5)
    print("{}:{},{}".format(name,score.mean(),score))
KNN:0.8159374803841566,[0.81564246 0.76404494 0.84269663 0.81460674 0.84269663]
NB:0.7385412089636557,[0.69832402 0.74719101 0.82022472 0.57303371 0.85393258]
Tree:0.8069612704789405,[0.80446927 0.76404494 0.85393258 0.79775281 0.81460674]
RF:0.8125666938673028,[0.81564246 0.75842697 0.8258427  0.82022472 0.84269663]
GDBT:0.8092147385600402,[0.79888268 0.7752809  0.83146067 0.78651685 0.85393258]
SVM:0.821542903772519,[0.82681564 0.80337079 0.8258427  0.78651685 0.86516854]
# 使用标准化的数据 scaled data
names=['KNN','NB','Tree','RF','GDBT','SVM']
for name, model in zip(names,models):
    score=cross_val_score(model,X_std,y,cv=5)
    print("{}:{},{}".format(name,score.mean(),score))
KNN:0.8204569706860838,[0.79329609 0.76404494 0.87640449 0.82022472 0.84831461] NB:0.7216872763793861,[0.69832402 0.74719101 0.82022472 0.48876404 0.85393258] Tree:0.8092084614901763,[0.80446927 0.76404494 0.84831461 0.79775281 0.83146067] RF:0.8226727763480006,[0.82122905 0.76966292 0.85955056 0.81460674 0.84831461] GDBT:0.8103383340656581,[0.79888268 0.7752809 0.83146067 0.78651685 0.85955056] SVM:0.8170610758897746,[0.81564246 0.80337079 0.8258427 0.78089888 0.85955056]
通过决策树看各个特征的重要性
clf = DecisionTreeClassifier(criterion = 'entropy',random_state = 30,splitter = 'random')
clf.fit(x_train_std,y_train)
score = clf.score(x_test_std,y_test)
score


fi=pd.DataFrame({'importance':clf.feature_importances_},index=X.columns)
fi.sort_values('importance',ascending=False)
fi.sort_values('importance',ascending=False).plot.bar(figsize=(11,7))
plt.xticks(rotation=30)
plt.title('Feature Importance',size='x-large')
from sklearn.model_selection import GridSearchCV

param_grid={'n_neighbors':[1,2,3,4,5,6,7,8,9]}
grid_search=GridSearchCV(KNeighborsClassifier(),param_grid,cv=5)

grid_search.fit(x_train_std,y_train)

grid_search.best_params_,grid_search.best_score_
#LogisticRegression
param_grid={'C':[0.01,0.1,1,10]}
grid_search=GridSearchCV(LogisticRegression(),param_grid,cv=5)
grid_search.fit(x_train_std,y_train)
grid_search.best_params_,grid_search.best_score_
# second round grid search
param_grid={'C':[0.04,0.06,0.08,0.1,0.12,0.14]}
grid_search=GridSearchCV(LogisticRegression(),param_grid,cv=5)
grid_search.fit(x_train_std,y_train)
grid_search.best_params_,grid_search.best_score_#Support Vector Machine
param_grid={'C':[0.01,0.1,1,10],'gamma':[0.01,0.1,1,10]}
grid_search=GridSearchCV(SVC(),param_grid,cv=5)
grid_search.fit(x_train_std,y_train)
grid_search.best_params_,grid_search.best_score_
#second round grid search
param_grid={'C':[2,4,6,8,10,12,14],'gamma':[0.008,0.01,0.012,0.015,0.02]}
grid_search=GridSearchCV(SVC(),param_grid,cv=5)
grid_search.fit(x_train_std,y_train)
grid_search.best_params_,grid_search.best_score_#Gradient Boosting Decision Tree
param_grid={'n_estimators':[30,50,80,120,200],'learning_rate':[0.05,0.1,0.5,1],'max_depth':[1,2,3,4,5]}
grid_search=GridSearchCV(GradientBoostingClassifier(),param_grid,cv=5)
grid_search.fit(x_train_std,y_train)
grid_search.best_params_,grid_search.best_score_
#second round search
param_grid={'n_estimators':[100,120,140,160],'learning_rate':[0.05,0.08,0.1,0.12],'max_depth':[3,4]}
grid_search=GridSearchCV(GradientBoostingClassifier(),param_grid,cv=5)
grid_search.fit(x_train_std,y_train)
grid_search.best_params_,grid_search.best_score_模型训练
#逻辑回归
from sklearn.linear_model import LogisticRegression
model1 = LogisticRegression()
model1.fit(x_train_std,y_train)

LogisticRegression(C=1.0, class_weight=None, dual=False, fit_intercept=True,
              intercept_scaling=1, max_iter=100, multi_class='ovr', n_jobs=1,
              penalty='l2', random_state=None, solver='liblinear', tol=0.0001,
              verbose=0, warm_start=False)

#在测试集上得出模型正确率
model1.score(x_test_std,y_test)

0.8212290502793296


pred1 = model1.predict(x_test)
score1 = model1.score(x_train,y_train)
score1


#使用训练得到的模型对pred_x的生存情况进行预测
pred_x_std=sc.fit_transform(pred_x)
pred_y=model1.predict(pred_x_std)
pred_y
泰坦尼克号生存预测 (Logistic and KNN)
kaggle 泰坦尼克号生存预测——六种算法模型实现与比较
GDBT特征重要性可视化
fit_transform,fit,transform区别和作用详解
sklearn中的cross_val_score()函数参数
train_test_split用法
pandas 读取或者选择某几列 模型调参利器 gridSearchCV(网格搜索)

