RNA 26. SCI文章中基于转录组数据的基因调控网络推断 (GENIE3)
点击关注,桓峰基因
桓峰基因公众号推出转录组分析和临床预测模型教程,有需要生信的老师可以联系我们!首选看下转录分析教程整理如下:
RNA 1. 基因表达那些事–基于 GEO
RNA 2. SCI文章中基于GEO的差异表达基因之 limma
RNA 3. SCI 文章中基于T CGA 差异表达基因之 DESeq2
RNA 4. SCI 文章中基于TCGA 差异表达之 edgeR
RNA 5. SCI 文章中差异基因表达之 MA 图
RNA 6. 差异基因表达之-- 火山图 (volcano)
RNA 7. SCI 文章中的基因表达——主成分分析 (PCA)
RNA 8. SCI文章中差异基因表达–热图 (heatmap)
RNA 9. SCI 文章中基因表达之 GO 注释
RNA 10. SCI 文章中基因表达富集之–KEGG
RNA 11. SCI 文章中基因表达富集之 GSEA
RNA 12. SCI 文章中肿瘤免疫浸润计算方法之 CIBERSORT
RNA 13. SCI 文章中差异表达基因之 WGCNA
RNA 14. SCI 文章中差异表达基因之 蛋白互作网络 (PPI)
RNA 15. SCI 文章中的融合基因之 FusionGDB2
RNA 16. SCI 文章中的融合基因之可视化
RNA 17. SCI 文章中的筛选 Hub 基因 (Hub genes)
RNA 18. SCI 文章中基因集变异分析 GSVA
RNA 19. SCI 文章中无监督聚类法 (ConsensusClusterPlus)
RNA 20. SCI 文章中单样本免疫浸润分析 (ssGSEA)
RNA 21. SCI 文章中单基因富集分析
RNA 22. SCI 文章中基于表达估计恶性肿瘤组织的基质细胞和免疫细胞(ESTIMATE)
RNA 23. SCI文章中表达基因模型的风险因子关联图(ggrisk)
RNA 24. SCI文章中基于TCGA的免疫浸润细胞分析 (TIMER)
RNA 25. SCI文章中估计组织浸润免疫细胞和基质细胞群的群体丰度(MCP-counter)
RNA 26. SCI文章中基于转录组数据的基因调控网络推断 (GENIE3)
临床预测模型整理如下:
Topic 1. 临床标志物生信分析常规思路
Topic 2. 生存分析之 Kaplan-Meier
Topic 3. SCI文章第一张表格–基线表格
Topic 4. 临床预测模型构建 Logistic 回归
Topic 5. 样本量确定及分割
Topic 6 计数变量泊松回归
Topic 7. 临床预测模型–Cox回归
Topic 8. 临床预测模型-Lasso回归
Topic 9. SCI 文章第二张表—单因素回归分析表
Topic 10. 单因素 Logistic 回归分析—单因素分析表格
Topic 11. SCI中多元变量筛选—单/多因素表
Topic 12 临床预测模型—列线表 (Nomogram)
Topic 13. 临床预测模型—一致性指数 (C-index)
Topic 14. 临床预测模型之校准曲线 (Calibration curve)
Topic 15. 临床预测模型之决策曲线 (DCA)
Topic 16. 临床预测模型之接收者操作特征曲线 (ROC)
Topic 17. 临床预测模型之缺失值识别及可视化
Topic 18. 临床预测模型之缺失值插补方法
今天介绍一下基于转录组数据的基因调控网络推断,这里面除了举个简单的例子,还列举一个单细胞转录组的数据,进行基因调控网络推断,效果还是不错的,这样就能够把我们的单细胞数据与bulk的数据结合起来,查缺补漏,使得数据上更加完整,更有说服力!!!
前 言
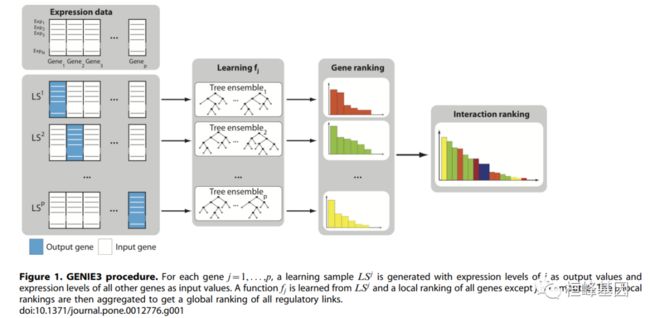
计算系统生物学中迫在眉睫的开放问题之一是利用高通量基因组数据(特别是基因表达数据)阐明遗传调控网络(GRNs)的拓扑结构的 逆向工程评估和方法对话(DREAM)挑战旨在评估GRN推理算法在模拟数据基准上的成功程度。一种新的GRN推理算法GENIE3,该算法在DREAM4 In silica多因子挑战中表现最好。GENIE3将p个基因间调控网络的预测分解为p个不同的回归问题。在每个回归问题中,利用基于树的集成方法Random Forests或Extra-Trees,从所有其他基因(输入基因)的表达模式中预测其中一个基因(目标基因)的表达模式。输入基因在预测靶基因表达模式中的重要性被视为假定的调控环节的指示。假设的调控链接被聚合到所有基因上,提供一个相互作用的排序,从这个排序可以重建整个网络。除了在DREAM4 In silica多因子挑战模拟数据中表现良好外,还表明 GENIE3在破译大肠杆菌基因调节网络方面优于现有算法。它没有对基因调控的本质做任何假设,可以处理组合和非线性的相互作用,产生定向GRN,快速和可扩展。总之,提出了一种新的GRN推理算法,该算法在合成和真实基因表达数据上都表现良好。该算法基于树的集成方法的特征选择,简单而通用,适用于其他类型的基因组数据和交互。
软件包安装
if (!require("BiocManager", quietly = TRUE))
  install.packages("BiocManager")

BiocManager::install("GENIE3")
例子实操
数据我们采用GENIE3给出来的例子,另外我们采用 单细胞转录组的数据集 pbmc 尝试分析基于单细胞转录组数据的基因调控网络的构建。
GENIE3例子
简单构造一个表达数据集
exprMatr <- matrix(sample(1:10, 100, replace = TRUE), nrow = 20)
rownames(exprMatr) <- paste("Gene", 1:20, sep = "")
colnames(exprMatr) <- paste("Sample", 1:5, sep = "")
head(exprMatr)
##       Sample1 Sample2 Sample3 Sample4 Sample5
## Gene1       4       9       5       1       8
## Gene2       6       3      10       5       5
## Gene3       2       2       3       6       7
## Gene4       5       5       2       4       7
## Gene5       1       8       2       1       1
## Gene6       8       2       7       7       3
treeMethod: Tree-based method used. Must be either “RF” for Random Forests (default) or “ET” for Extra-Trees.
在做基因调控网络分析时有两种方法可以选择:RF, ET,默认是 RF。
进行基因调控网络的分析
library(GENIE3)
set.seed(123)  # For reproducibility of results
weightMat <- GENIE3(exprMatr)
dim(weightMat)
## [1] 20 20
weightMat[1:5, 1:5]
##            Gene1       Gene2      Gene3      Gene4       Gene5
## Gene1 0.00000000 0.044491854 0.02449400 0.06013293 0.112097046
## Gene2 0.03646480 0.000000000 0.02942083 0.07192433 0.129756000
## Gene3 0.02743010 0.008567765 0.00000000 0.05837880 0.013269916
## Gene4 0.04856294 0.121335689 0.05750308 0.00000000 0.004207474
## Gene5 0.04370138 0.032089715 0.02260877 0.01166890 0.000000000
设置候选基因:
# Genes that are used as candidate regulators
regulators <- c(2, 4, 7)
# Or alternatively:
regulators <- c("Gene2", "Gene4", "Gene7")
weightMat <- GENIE3(exprMatr, regulators=regulators)
regulatorsList <- list("Gene1"=rownames(exprMatr)[1:10],
                       "Gene2"=rownames(exprMatr)[10:20],
                       "Gene20"=rownames(exprMatr)[15:20])
set.seed(123)
weightList <- GENIE3(exprMatr, nCores=1, targets=names(regulatorsList), regulators=regulatorsList, returnMatrix=FALSE)
选用 ET 方法计算:
# Use Extra-Trees (ET) method
# 7 randomly chosen candidate regulators at each node of a tree
# 5 trees per ensemble
weightMat <- GENIE3(exprMatr, treeMethod="ET", K=7, nTrees=50)
head(weightMat)


##            Gene1       Gene2       Gene3       Gene4      Gene5      Gene6
## Gene1 0.00000000 0.003047264 0.031212121 0.011919192 0.09888889 0.23666667
## Gene2 0.04398058 0.000000000 0.028939394 0.050858586 0.08549283 0.04578767
## Gene3 0.02697411 0.020870647 0.000000000 0.040580808 0.01430108 0.01815068
## Gene4 0.01642395 0.163868159 0.088939394 0.000000000 0.06030466 0.05730594
## Gene5 0.01677994 0.075410448 0.045151515 0.003787879 0.00000000 0.07142694
## Gene6 0.23944175 0.047164179 0.009545455 0.009090909 0.07493728 0.00000000
##             Gene7       Gene8       Gene9      Gene10      Gene11      Gene12
## Gene1 0.018822844 0.032118644 0.007031250 0.010097324 0.054166667 0.006493506
## Gene2 0.031235431 0.076292373 0.011979167 0.014251825 0.177222222 0.024567100
## Gene3 0.060081585 0.070621469 0.007890625 0.190681265 0.006666667 0.016428571
## Gene4 0.009026807 0.029131356 0.021562500 0.116465937 0.145000000 0.012694805
## Gene5 0.007167832 0.169258475 0.105729167 0.006739659 0.013333333 0.014404762
## Gene6 0.001456876 0.002542373 0.024218750 0.000000000 0.031111111 0.007142857
##            Gene13      Gene14     Gene15      Gene16     Gene17     Gene18
## Gene1 0.124664352 0.006725146 0.02627148 0.016343042 0.05244624 0.03888889
## Gene2 0.006018519 0.115730994 0.07525773 0.013122977 0.04456989 0.01861111
## Gene3 0.039479167 0.013742690 0.02482818 0.005315534 0.01247312 0.04722222
## Gene4 0.032557870 0.039605263 0.03470790 0.017467638 0.02643369 0.04000000
## Gene5 0.006944444 0.034327485 0.25359107 0.008171521 0.18548387 0.02555556
## Gene6 0.018865741 0.003070175 0.07048110 0.020161812 0.01462366 0.01944444
##           Gene19       Gene20
## Gene1 0.08717172 0.0376548673
## Gene2 0.09570076 0.0121681416
## Gene3 0.15281566 0.0987020649
## Gene4 0.05696970 0.1382448378
## Gene5 0.03516414 0.0002212389
## Gene6 0.09481061 0.0234070796
获取top link
上面得到的是所有候选基因的可能调控网络,是一个非常大的表。如果你的基因list有几百个基因,你会得到十几万或者几十万的link,很难从中获得有效信息。这时你可以选择只获取top link,即最有可能的调控关系网络。
set.seed(123)  # For reproducibility of results
weightMat <- GENIE3(exprMatr, nCores = 4, verbose = TRUE)
linkList <- getLinkList(weightMat)
dim(linkList)
## [1] 380   3
head(linkList)
##   regulatoryGene targetGene    weight
## 1         Gene16     Gene18 0.2289570
## 2          Gene1      Gene6 0.2188915
## 3          Gene7     Gene18 0.1903439
## 4          Gene2     Gene19 0.1902978
## 5         Gene20     Gene13 0.1741122
## 6          Gene6      Gene1 0.1707038
linkList <- getLinkList(weightMat, reportMax = 5)
linkList <- getLinkList(weightMat, threshold = 0.1)
单细胞转录组 pbmc
# install.packages('pbmc3k.SeuratData', repos='http://seurat.nygenome.org/',
# type = 'source')
library(pbmc3k.SeuratData)
library(Seurat)
data("pbmc")
pbmc <- pbmc3k.final
levels(Idents(pbmc))
## [1] "Naive CD4 T"  "Memory CD4 T" "CD14+ Mono"   "B"            "CD8 T"
## [6] "FCGR3A+ Mono" "NK"           "DC"           "Platelet"
我们这里选择一个细胞类型为“Memory CD4 T”的相关的基因,并提取表达矩阵:
单细胞基因调控网络分析:
set.seed(1314)  # For reproducibility of results
weightMat <- GENIE3(exprMatr, nCores = 4)  # with the default parameters
weightMat[1:5, 1:5]
##              LDHB     MALAT1     EEF1A1       CCR7       TPT1
## MALAT1 0.04333745 0.00000000 0.14770305 0.04201807 0.07073973
## EEF1A1 0.04337260 0.08230214 0.00000000 0.02626972 0.03591088
## CCR7   0.01151539 0.02685912 0.01375829 0.00000000 0.01048274
## TPT1   0.03177815 0.04102548 0.04016091 0.02505163 0.00000000
## CD3D   0.03271693 0.02794367 0.01997983 0.02297784 0.02406677
基因调控网络可视化
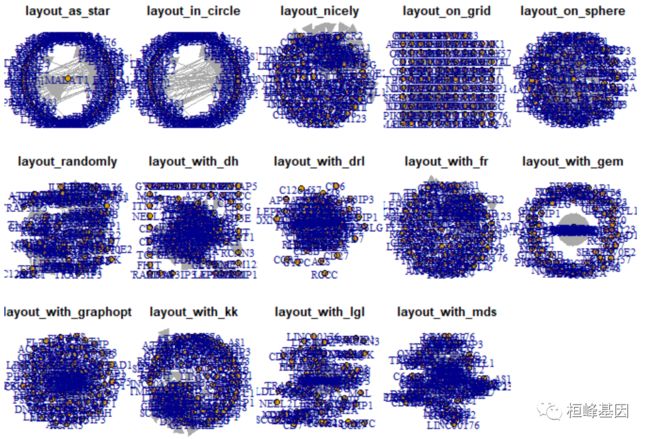
多个布局的可视化调节网络
library(igraph)
weightMat[which(weightMat < 0.04)] = 0
net1 <- graph_from_incidence_matrix(weightMat)

layouts <- grep("^layout_", ls("package:igraph"), value = TRUE)[-1]
# Remove layouts that do not apply to our graph.
layouts <- layouts[!grepl("bipartite|merge|norm|sugiyama|tree", layouts)]

layouts <- c("layout_as_star", "layout_in_circle", "layout_nicely", "layout_on_grid",
    "layout_on_sphere", "layout_randomly", "layout_with_dh", "layout_with_drl", "layout_with_fr",
    "layout_with_gem", "layout_with_graphopt", "layout_with_kk", "layout_with_lgl",
    "layout_with_mds")
layouts
##  [1] "layout_as_star"       "layout_in_circle"     "layout_nicely"
##  [4] "layout_on_grid"       "layout_on_sphere"     "layout_randomly"
##  [7] "layout_with_dh"       "layout_with_drl"      "layout_with_fr"
## [10] "layout_with_gem"      "layout_with_graphopt" "layout_with_kk"
## [13] "layout_with_lgl"      "layout_with_mds"


length(layouts)
## [1] 14
par(mfrow = c(3, 5), mar = c(1, 1, 1, 1))
for (layout in layouts) {
    print(layout)
    l <- do.call(layout, list(net1))
    plot(net1, edge.arrow.mode = 1, layout = l, main = layout)
}
## [1] "layout_as_star"
## [1] "layout_in_circle"
## [1] "layout_nicely"
## [1] "layout_on_grid"
## [1] "layout_on_sphere"
## [1] "layout_randomly"
## [1] "layout_with_dh"
## [1] "layout_with_drl"
## [1] "layout_with_fr"
## [1] "layout_with_gem"
## [1] "layout_with_graphopt"
## [1] "layout_with_kk"
## [1] "layout_with_lgl"
## [1] "layout_with_mds"
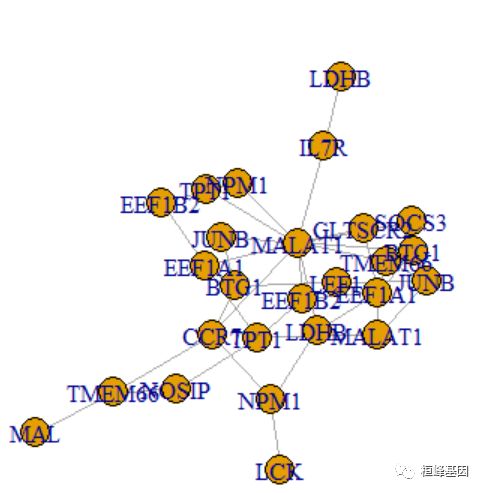
在我们的过滤中,许多基因与其他基因没有任何的链接,可能是没有什么调控关系,我们想看哪些基因是有调控关系的。
V(net1)[igraph::degree(net1) > 1]
## + 26/118 vertices, named, from ec4a27c:
##  [1] MALAT1  EEF1A1  TPT1    NPM1    EEF1B2  JUNB    TMEM66  BTG1    LDHB
## [10] LDHB    MALAT1  EEF1A1  CCR7    TPT1    NPM1    NOSIP   LEF1    EEF1B2
## [19] JUNB    TMEM66  GLTSCR2 BTG1    IL7R    MAL     LCK     SOCS3

plot(induced_subgraph(net1, V(net1)[igraph::degree(net1) > 1]))
GENIE3 考虑到很多童鞋操作网络可能会有困难,就安排了一个函数根据给定的阈值删选
linkList <- getLinkList(weightMat, reportMax = 10)
linkList <- getLinkList(weightMat, threshold = 0.01)
head(linkList)
##   regulatoryGene targetGene     weight
## 1         MALAT1     EEF1A1 0.14770305
## 2         EEF1A1     MALAT1 0.08230214
## 3           BTG1       JUNB 0.07229212
## 4         MALAT1       TPT1 0.07073973
## 5           JUNB       BTG1 0.06944210
## 6         MALAT1     EEF1B2 0.06485446
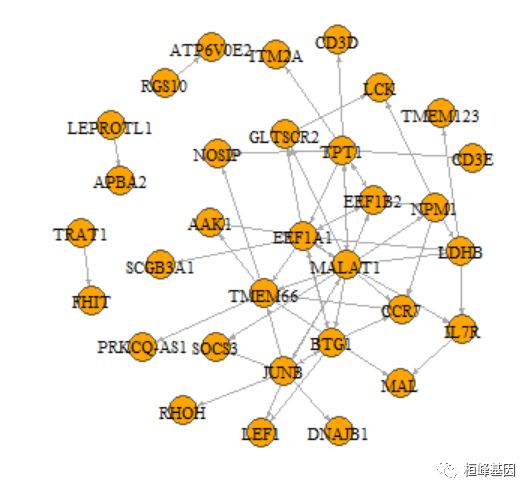
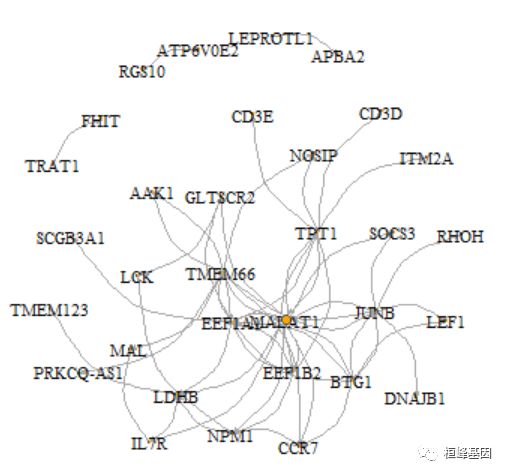
这个格式当然也是可以用igraph来构建网络的。
net <- graph_from_data_frame(linkList)
plot(net, edge.arrow.size = 0.2, edge.curved = 0, vertex.color = "orange", vertex.frame.color = "#555555",
    vertex.label.color = "black", vertex.label.cex = 0.7)
我们把表达量信息画在网络图上:
avexp <- AverageExpression(cd4nt, features = names(V(net)), slot = "data")
V(net)$size <- abs(scale(avexp$RNA))
E(net)$width <- E(net)$weight * 10
plot(net, edge.arrow.size = 0.2, edge.curved = 0.5, vertex.color = "orange", vertex.frame.color = "#555555",
    vertex.label.color = "black", vertex.label.cex = 0.7)
我们这期主要介绍基于转录组数据的基因调控网络推断 (GENIE3)。目前单细胞测序的费用也在降低,单细胞系列可算是目前的测序神器,有这方面需求的老师,联系桓峰基因,提供最高端的科研服务!
桓峰基因,铸造成功的您!
未来桓峰基因公众号将不间断的推出单细胞系列生信分析教程,
敬请期待!!
有想进生信交流群的老师可以扫最后一个二维码加微信,备注“单位+姓名+目的”,有些想发广告的就免打扰吧,还得费力气把你踢出去!
References:
-
Aibar, Sara, et al. 2017. “SCENIC: Single-Cell Regulatory Network Inference and Clustering.” Nature Methods 14 (october): 1083–6. doi:10.1038/nmeth.4463.
-
Huynh-Thu VA, Irrthum A, Wehenkel L, Geurts P (2010) Inferring Regulatory Networks from Expression Data Using Tree-Based Methods. PLoS ONE 5(9): e12776.

