NNDL 实验三 线性模型
目录
-
- 2.2 实现一个简单的线性模型
-
- 引言
- 2.2.1 数据集构建
- 2.2.2模型构建
- 2.2.3损失函数
- 2.2.4 模型优化
- 2.2.5模型训练
- 2.2.6模型评估
- 2.3多项式回归
-
- 2.3.1数据集构建
- 2.3.2模型构建与训练
- 2.3.3模型评估
- Runner类介绍
- 2.5 基于线性回归的波士顿房价预测
-
- 2.5.1数据清洗
-
- 2.5.1.1 数据清洗
- 2.5.1.2 数据集划分
- 2.5.1.2 特征工程
- 2.5.2 模型构建
- 2.5.3完善Runner类
- 2.5.4模型训练
- 2.5.5模型测试
- 2.5.6模型预测
- 收获
2.2 实现一个简单的线性模型
引言
下面列举的代码,是本人为了理解基础的同时温故机器学习中线性模型的知识,没有引入现成的函数,是从底层一步一步写起的。,而多项式回归中,我就直接用引用pytorch中的方,有点懒,所以只把一维线性模型的底层代码写了。
这篇博客pytorch实现线性模型中是我的比认为较简单torch实现线性模型。.大家可以看看。下面开始正题
2.2.1 数据集构建
使用 y = w x + b + ϵ y=wx+b+\epsilon y=wx+b+ϵ构造一维的数据集合。其 中 ϵ \epsilon ϵ是高斯误差项。 x 、 b x、b x、b为使用高斯分布生成的自变量张量, w w w为给定的参数, y y y为生成的含噪声的变量。
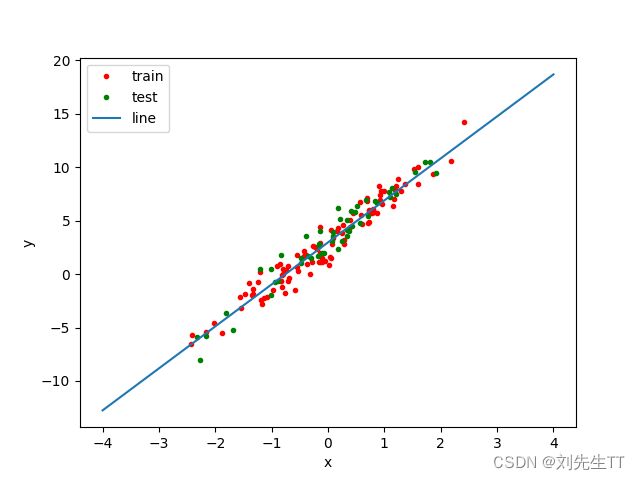
构造一个小的回归数据集:生成 150 个带噪音的样本,其中 100 个训练样本,50 个测试样本,并打印出训练数据的可视化分布。如下图

代码如下
import torch
import matplotlib.pyplot as plt
'''
input:w,b,num---->给定权重w,偏移量b,num样本数目
            type:tensor,int...float,int
output:x,y
    生成的自变量x,因变量y
target:creat a data about linear model
'''
def create_data(w,b,num):
    #生成自变量x
    x = torch.normal(0,1,(num,len(w)))
    #生成标准的线性模型
    y = torch.matmul(x,w)+b
    #添加噪声
    y = y+torch.normal(0,0.001,y.shape)
    return x,y
#创建数据集
data_x,data_y = create_data(torch.tensor([2.0,3.0,5.0]),2,150)
#分割训练集和测试集
data_x_train,data_y_train = data_x[0:100],data_y[0:100]
data_x_test,data_y_test = data_x[100:150],data_y[100:150]
'''生成图像'''

#生成图形1
plt.figure(1)
#描绘数据
plt.plot(data_x_train,data_y_train,'.r',data_x_test,data_y_test,'.g')
plt.show()
2.2.2模型构建
线性模型的定义为(就是一个普通的线性函数,不过是向量形式的: y = w T x + b y=w^{T}x+b y=wTx+b(其中 x x x为输入的n维向量, w w w为给定的参数)
'''
线性模型w,b为给定的参数
target:create the date of the linear model
返回值为x,y
'''
def create_data(w,b,num):
    #生成自变量x
    x = torch.normal(0,1,(num,len(w)))
    #生成标准的线性模型
    y = torch.matmul(x,w)+b
    #添加噪声
    y = y+torch.normal(0,0.001,y.shape)
    return x,y
2.2.3损失函数
ζ ( y , y ^ ) = 1 2 N ∣ ∣ y − y ^ ∣ ∣ 2 = 1 2 N ∣ ∣ X w + b − y ∣ ∣ 2 \zeta(y,\hat{y})=\frac{1}{2N}||y-\hat{y}||^{2}=\frac{1}{2N}||Xw+b-y||^{2} ζ(y,y^)=2N1∣∣y−y^∣∣2=2N1∣∣Xw+b−y∣∣2
y y y为实际的数据值 y ^ \hat{y} y^为预测的数据值
- 为什么使用二次方?答:为了防止误差计算中正负相抵。
- 既然为了防止正负相抵,为什么不使用绝对值? 答:因为绝对值数学性质较差,不易求导。
- 代码中为什么没有除2合理吗?答:在机器学习中除2,是因为了求导约去2,为了计算方便,现在计算机计算速度飞快,不除2得到的才是更加准确的结果
'''
input:y_real,y_predict---->真实值集合,预测值集合
                    type:list,list
output:error---->误差
tatget:calc the error betweeen the real and prdiction
'''
def loss(y_real,y_predict):
    return np.sum(np.pow(np.subtract(y_real-y_predict),2))/2*len(y_real)
 '''
    error: tensor(124983.3594)
 '''

损失函数可不仅仅只有均方误差,还有0-1损失函数,对数损失函数等等好多,要多做测试。
2.2.4 模型优化
经验风险最小化 拟合参数θ的一个方法是求解目标函数使训练误差最小。 这个过程被称作 经验风险最小化(ERM-empirical risk minimization) ,它是简化的机器学习模型,逻辑回归和支持向量机可以看作为这个非凸优化问题的凸性近似。
理论是枯燥的,下面举一个即将要用到的具体的例子,开开胃。
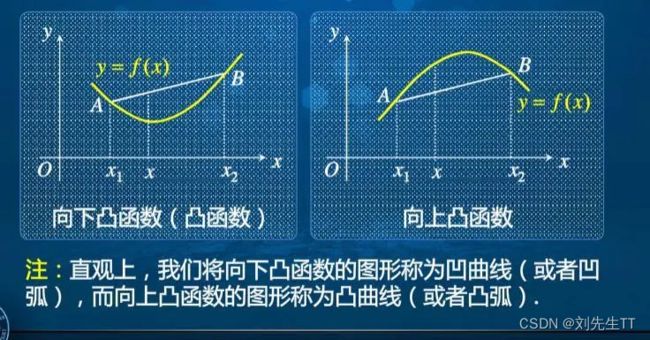
损失函数为最小二乘法,通过常识来说,模型优化就是使得误差最小,而在数学上面,对于下凸函数,只需要导数等于0即可,你说巧不巧,均方误差正好是下凸函数,所以我们需要仅仅需要求的梯度,使梯度等于0,便得到的回归参数 w ^ , b ^ \hat{w},\hat{b} w^,b^的解析解,是不是很棒。
看代码看累了,就来了解下上凸函数和下凸函数吧。数学的魅力是无穷的
这里我们对 w , b w,b w,b求导使其等于0,得出 w , b w,b w,b的解析解。
求线性回归模型a的算法
- 对w求导
- ∂ ζ ( y , y ^ ) ∂ w = ( X − x ‾ T ) T ( ( X − x ‾ ) w − ( y − y ‾ ) ) ( 2 ) \frac{\partial\zeta(y,\hat{y})}{\partial{w}}=(X-\overline{x}^{T})^{T}((X-\overline{x})w-(y-\overline{y}))(2) ∂w∂ζ(y,y^)=(X−xT)T((X−x)w−(y−y))(2)
- 令式(2)等于0
- 得出 w ∗ = ( ( X − x ‾ ) ( X − x ‾ ) − 1 ) ( ( X − x − T ) w − ( y − y ‾ ) ) w^{*}=((X-\overline{x})(X-\overline{x})^{-1})((X-x^{-T})w-(y-\overline{y})) w∗=((X−x)(X−x)−1)((X−x−T)w−(y−y))
求线性回归b的算法
- ∂ ζ ( y , y ^ ) ∂ b = 1 T ( X w + b − y ) ( 1 ) \frac{\partial\zeta(y,\hat{y})}{\partial{b}}=1^{T}(Xw+b-y) (1) ∂b∂ζ(y,y^)=1T(Xw+b−y)(1)
- 令式(1)等于0
- 得 b ^ = y ‾ − x ‾ T w \hat{b}=\overline{y}-\overline{x}^{T}w b^=y−xTw
#求得最优解析解进行优化,输入lambda参数,和x,y进行迭代求解
def optimizer(x,y,r_lambda):
    x_mean = torch.mean(x)
    tmp = (x-x_mean.T)
    y_mean = torch.mean(y)
    w = torch.matmul(torch.matmul(torch.inverse(torch.matmul(tmp.T,tmp)),tmp.T),(y-y_mean))
    b = y_mean-torch.matmul(x_mean.unsqueeze(0),w)
    return w,b
测试利用经验误差最小化模拟参数 w , b w,b w,b得到的图形。

1.问: 为什么省略了 1 N \frac{1}{N} N1不影响效果?
因为 1 N \frac{1}{N} N1是一个常数,常数会影响数值的大小,不会影响数值的方向,因此更不会影响数值的相关性,这点数值的大小可以通过认为的学习率设置进行调整。所以不会影响效果。
2.2. 什么是最小二乘法 ( Least Square Method , LSM )
所谓的最小二乘法(generalized least squares)是一种数学优化技术,它通过最小化误差的平方和找到一组数据的最佳函数匹配。 最小二乘法是用最简的方法求得一些绝对不可知的真值,而令误差平方之和为最小。 最小二乘法通常用于曲线拟合。很多其他的优化问题也可通过最小化能量或最大化熵用最小二乘形式表达。
比如从最简单的一次函数 y = k x + b y=kx+b y=kx+b讲起已知坐标轴上有些点(1.1,2.0),(2.1,3.2),(3,4.0),(4,6),(5.1,6.0),求经过这些点的图象的一次函数关系式。当然这条直线不可能经过每一个点,我们只要做到5个点到这条直线的距离的平方和最小即可,这这就需要用到最小二乘法的思想.然后就用线性拟合来求。
拓展:当放松一下,最小二乘法的历史
1801年,意大利天文学家朱赛普·皮亚齐发现了第一颗小行星谷神星。经过40天的跟踪观测后,由于谷神星运行至太阳背后,使得皮亚齐失去了谷神星的位置。随后全世界的科学家利用皮亚齐的观测数据开始寻找谷神星,但是根据大多数人计算的结果来寻找谷神星都没有结果。时年24岁的高斯也计算了谷神星的轨道。奥地利天文学家海因里希·奥尔伯斯根据高斯计算出来的轨道重新发现了谷神星。
高斯使用的最小二乘法的方法发表于1809年他的著作《天体运动论》中。
法国科学家勒让德于1806年独立发现“最小二乘法”。但因不为时人所知而默默无闻。
2.2.5模型训练
小黑板:模型训练的步骤
- 生成数据集
- 模型构建
- 模型训练
- 模型评估
通过生成的数据集,损失函数,和优化器计算出线性模型中的参数
import torch
import numpy as np
import matplotlib.pyplot as plt
'''
input:w,b,num---->给定权重w,偏移量b,num样本数目
            type:tensor,int...float,int
output:x,y
    生成的自变量x,因变量y
target:creat a data about linear model
'''
def create_data(w,b,num):
    #生成自变量x
    x = torch.normal(0,1,(num,len(w)))
    #生成标准的线性模型
    y = torch.matmul(x,w)+b
    #添加噪声
    y = y+torch.normal(0,1,y.shape)
    return x,y
'''

input:y_real,y_predict---->真实值集合,预测值集合
                    type:list,list
output:error---->误差
tatget:calc the error betweeen the real and prdiction using the min 2 cheng
'''
def loss(y_real,y_predict):
    return torch.sum(torch.subtract(y_real,y_predict)*torch.subtract(y_real,y_predict)/2*len(y_real))
'''
求得最优解析解进行优化
'''
def optimizer(x,y,r_lambda):
    x_mean = torch.mean(x)
    tmp = (x-x_mean.T)
    y_mean = torch.mean(y)
    w = torch.matmul(torch.matmul(torch.inverse(torch.matmul(tmp.T,tmp)),tmp.T),(y-y_mean))
    b = y_mean-torch.matmul(x_mean.unsqueeze(0),w)
    return w,b

if __name__ =="__main__":
	#数据集的数目,正则化系数
	n = 150;
	z = 1;
    # 创建数据集
    data_x, data_y = create_data(torch.tensor([4.0]), 3, n)
    # 分割训练集和测试集
    data_x_train, data_y_train = data_x[0:round((2/3)*n)], data_y[0:round((2/3)*n)]
    data_x_test, data_y_test = data_x[round((2/3)*n):n], data_y[round((2/3)*n):n]
    # 构造一个简单的样例进行测试
    w = torch.tensor([2.0])
    b = 2;
    w,b = optimizer(data_x_train,data_y_train,1);
    '''生成图像'''
    # 生成图形1
    plt.figure(1)
    # 描绘数据
    plt.plot(data_x_train, data_y_train, '.r', data_x_test, data_y_test, '.g')
    x = torch.linspace(-4,4,100)
    y = x*w+b
    plt.plot(x,y)
    plt.xlabel("x")
    plt.ylabel("y")
    plt.legend(["train","test","line"])
    plt.show()
    print("==========训练完成============")
    print("估计出来的参数w:{0},b:{1}".format(w,b))
    print("训练集上的误差{0}".format(loss(data_y_train,torch.matmul(data_x_train,w)+b)))
    print("测试集上的误差{0}".format(loss(data_y_test,torch.matmul(data_x_test,w)+b)))
'''==========训练完成============
估计出来的参数w:tensor([4.1229]),b:3.0065484046936035
训练集上的误差5113.0166015625
测试集上的误差1234.0970458984375'''
2.2.6模型评估
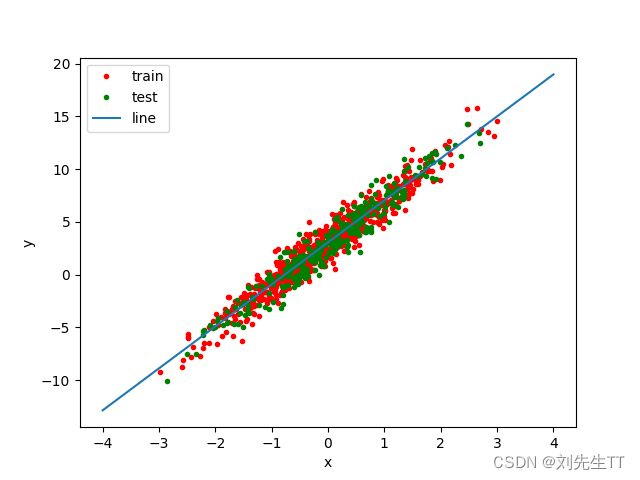
- 调整模型的数目到1000,
  #数据集的数目,正则化系数
  n = 5000;	'''<====这里发生了变化'''
  z = 1;
  # 创建数据集
  data_x, data_y = create_data(torch.tensor([4.0]), 3, n)
  # 分割训练集和测试集
  data_x_train, data_y_train = data_x[0:round((2/3)*n)], data_y[0:round((2/3)*n)]
  data_x_test, data_y_test = data_x[round((2/3)*n):n], data_y[round((2/3)*n):n]
  '''
  ''
 ==========训练完成============
估计出来的参数w:tensor([3.9826]),b:3.052729845046997
训练集上的误差256413.53125
测试集上的误差48983.78515625
  '''
解释一下误差为什么会变大,是因为整体数据变多了,但是误差均值和方差均会变小,测试样本增多,会更加准确,所以单个个体的误差会减小
- 调整正则化系数
	#数据集的数目,正则化系数
   n = 5000;
   z = 0.5;	'''<====这里发生了变化'''
   # 创建数据集
   data_x, data_y = create_data(torch.tensor([4.0]), 3, n)
   # 分割训练集和测试集
   data_x_train, data_y_train = data_x[0:round((2/3)*n)], data_y[0:round((2/3)*n)]
   data_x_test, data_y_test = data_x[round((2/3)*n):n], data_y[round((2/3)*n):n]
   '''
      ==========训练完成============
估计出来的参数w:tensor([3.9153]),b:3.0420732498168945
训练集上的误差5004.54296875
测试集上的误差1536.957763671875
   '''
正则化系数是为了防止过拟合,由图可知,改变正则化系数拟合出的直线变化不是很大,可知拟合效果良好
2.3多项式回归
f ( x ; w ) = w 1 x 2 + w 2 x 2 + . . . + w M x M + b = w T ϕ ( x ) + b f(x;w)=w_{1}x^{2}+w_{2}x^{2}+...+w_{M}x^{M}+b=w^{T}\phi(x)+b f(x;w)=w1x2+w2x2+...+wMxM+b=wTϕ(x)+b
其中 M M M为多项式的阶数, w w w为多项式的系数。
ϕ \phi ϕ为多项式基函数,将原始特征 x x x映射为M维向量。当 M M M=0时, f ( x ; w ) = b f(x;w)=b f(x;w)=b
2.3.1数据集构建
构建训练和测试数据,其中:
训练数样本 15 个,测试样本 10 个,高斯噪声标准差为 0.1,自变量范围为 (0,1)。
def creatData(num,w,b):
    data_x = torch.rand((num,2))
    for i in range(0,len(data_x)):
        data_x[:,1] = data_x[:,0]*data_x[:,0]
    data_y = torch.matmul(data_x,w)+b
    data_y = data_y
    return data_x,data_y
    # 生成数据
func = sin
interval = (0,1)
train_num = 15
test_num = 10
noise = 0.5 #0.1
X_train, y_train = create_toy_data(func=func, interval=interval, sample_num=train_num, noise = noise)
X_test, y_test = create_toy_data(func=func, interval=interval, sample_num=test_num, noise = noise)

X_underlying = paddle.linspace(interval[0],interval[1],num=100)
y_underlying = sin(X_underlying)

# 绘制图像
plt.rcParams['figure.figsize'] = (8.0, 6.0)
plt.scatter(X_train, y_train, facecolor="none", edgecolor='#e4007f', s=50, label="train data")
#plt.scatter(X_test, y_test, facecolor="none", edgecolor="r", s=50, label="test data")
plt.plot(X_underlying, y_underlying, c='#000000', label=r"$\sin(2\pi x)$")
plt.legend(fontsize='x-large')
plt.savefig('ml-vis2.pdf')
plt.show()
2.3.2模型构建与训练
构建如下模型 y = w 1 x 1 1 + . . . . w n x 1 n + b y = w_{1}x_{1}^{1}+....w_{n}x_{1}^{n}+b y=w1x11+....wnx1n+b,通过观察可知是由线性模型进行转变得到的,所以我们可以使用pytorch线性模型拟合的函数torch.nn.linear进行拟合.构建模型,通过均方误差来衡量训练误差、测试误差以及在没有噪音的加入下sin函数值与多项式回归值之间的误差,更加真实地反映拟合结果。多项式分布阶数从0到8进行遍历。
'''多项式回归'''
import torch
import numpy as np
import matplotlib.pyplot as plt
'''
    画图
'''
def draw_tarin(x_train,y_train):
    plt.figure(1)
    plt.plot(x_train[:,0], y_train, "r.")
    plt.xlabel("x")
    plt.ylabel("y")
    plt.legend(['train'])
def draw_pred(x_pred,y_pred):
    plt.figure(1)
    plt.plot(x_pred, y_pred, "g.")
    plt.xlabel("x")
    plt.ylabel("y")
    plt.legend(['pred'])

def draw(isPred=False,x_train=None,y_train=None,x_pred=None,y_pred=None):
    draw_tarin(x_train,y_train)
    if(isPred):
        draw_pred(x_pred,y_pred)
        plt.legend(['train','pred'])
    plt.show()
'''
构造数据集
input:
 -num:数据集的个数
 -w:权重
 -b:为常系数
output:
 -data_x:数据集,自变量
 _data_y:数据集,因变量
'''
def creatData(num,w,b):
    data_x = torch.rand((num,2))
    for i in range(0,len(data_x)):
        data_x[:,1] = data_x[:,0]*data_x[:,0]
    data_y = torch.matmul(data_x,w)+b
    data_y = data_y
    return data_x,data_y


'''
    建立线性模型
    input:
     -N表示多项式的阶数
'''
class Classification(torch.nn.Module):
    def __init__(self):
        super(Classification,self).__init__()
        self.poly = torch.nn.Linear(2,1)
        """
        输入矩阵               weight     bias     target
        ------------------------------------------------
        [[x₁²  x₁]                            y₁
         [x₂²  x₂]      [[w₁]                 y₂
         [x₃²  x₃]   x   [w₂]]  +  [b]   =    y3
       ------------------------------------------------
        """
    def forward(self,x):

        return self.poly(x)

if __name__ == '__main__':
    #训练次数
    epoch = 50
    # 定义一个函数
    w_target = torch.tensor([-2.0,1.0])
    b_target = torch.tensor([0.21])
    func = 'f(x) = {:.2f} + {:.2f} * x + {:.2f} * x^2'.format(b_target[0], w_target[0], w_target[1])
    print("生成的多项式函数为:", func)
    data_x,data_y = creatData(25,w_target,b_target)
    print(data_x[0,0])
    data_x_train,data_y_train = data_x[0:15,:],data_y[0:15];
    data_x_target,data_y_target = data_x[15:25,:],data_y[15:25];
    model = Classification();
    #均方误差
    loss = torch.nn.MSELoss()
    #优化器选用随机梯度下降的方法
    optimizer = torch.optim.SGD(model.parameters(),0.05)
    #初始化迭代器
    optimizer.zero_grad()
    #反向传播
    for i in range(0,epoch):
        if(epoch%10==0):
            output = model(data_x_train);
            lossNum = loss(output,data_y_train)
            lossNum.backward()
            optimizer.step()
            optimizer.zero_grad()
            print('[---------{}/{}--------------]  Loss = {}'.format(i+1,epoch,lossNum.data))
2.3.3模型评估
# 训练误差和测试误差
training_errors = []
test_errors = []
distribution_errors = []

# 遍历多项式阶数
for i in range(9):
    model = Linear(i)

    X_train_transformed = polynomial_basis_function(X_train.reshape([-1,1]), i)
    X_test_transformed = polynomial_basis_function(X_test.reshape([-1,1]), i)
    X_underlying_transformed = polynomial_basis_function(X_underlying.reshape([-1,1]), i)

    optimizer_lsm(model,X_train_transformed,y_train.reshape([-1,1]))

    y_train_pred = model(X_train_transformed).squeeze()
    y_test_pred = model(X_test_transformed).squeeze()
    y_underlying_pred = model(X_underlying_transformed).squeeze()

    train_mse = mean_squared_error(y_true=y_train, y_pred=y_train_pred).item()
    training_errors.append(train_mse)

    test_mse = mean_squared_error(y_true=y_test, y_pred=y_test_pred).item()
    test_errors.append(test_mse)

    #distribution_mse = mean_squared_error(y_true=y_underlying, y_pred=y_underlying_pred).item()
    #distribution_errors.append(distribution_mse)

print ("train errors: \n",training_errors)
print ("test errors: \n",test_errors)
#print ("distribution errors: \n", distribution_errors)

# 绘制图片
plt.rcParams['figure.figsize'] = (8.0, 6.0)
plt.plot(training_errors, '-.', mfc="none", mec='#e4007f', ms=10, c='#e4007f', label="Training")
plt.plot(test_errors, '--', mfc="none", mec='#f19ec2', ms=10, c='#f19ec2', label="Test")
#plt.plot(distribution_errors, '-', mfc="none", mec="#3D3D3F", ms=10, c="#3D3D3F", label="Distribution")
plt.legend(fontsize='x-large')
plt.xlabel("degree")
plt.ylabel("MSE")
plt.savefig('ml-mse-error.pdf')
plt.show()
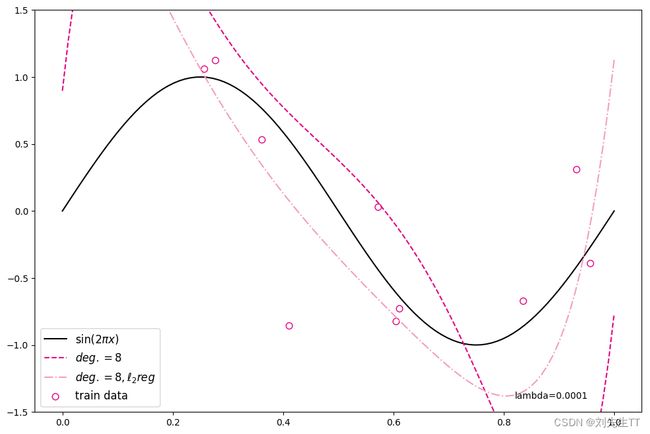
当阶数较低的时候,模型的表示能力有限,训练误差和测试误差都很高,代表模型欠拟合;
当阶数较高的时候,模型表示能力强,但将训练数据中的噪声也作为特征进行学习,一般情况下训练误差继续降低而测试误差显著升高,代表模型过拟合。
此处多项式阶数大于等于5时,训练误差并没有下降,尤其是在多项式阶数为7时,训练误差变得非常大,请思考原因?提示:请从幂函数特性角度思考。
对于模型过拟合的情况,可以引入正则化方法,通过向误差函数中添加一个惩罚项来避免系数倾向于较大的取值。下面加入l2正则化项,查看拟合结果
degree = 8 # 多项式阶数
reg_lambda = 0.0001 # 正则化系数

X_train_transformed = polynomial_basis_function(X_train.reshape([-1,1]), degree)
X_test_transformed = polynomial_basis_function(X_test.reshape([-1,1]), degree)
X_underlying_transformed = polynomial_basis_function(X_underlying.reshape([-1,1]), degree)

model = Linear(degree)

optimizer_lsm(model,X_train_transformed,y_train.reshape([-1,1]))

y_test_pred=model(X_test_transformed).squeeze()
y_underlying_pred=model(X_underlying_transformed).squeeze()

model_reg = Linear(degree)

optimizer_lsm(model_reg,X_train_transformed,y_train.reshape([-1,1]),reg_lambda=reg_lambda)

y_test_pred_reg=model_reg(X_test_transformed).squeeze()
y_underlying_pred_reg=model_reg(X_underlying_transformed).squeeze()

mse = mean_squared_error(y_true = y_test, y_pred = y_test_pred).item()
print("mse:",mse)
mes_reg = mean_squared_error(y_true = y_test, y_pred = y_test_pred_reg).item()
print("mse_with_l2_reg:",mes_reg)

# 绘制图像
plt.scatter(X_train, y_train, facecolor="none", edgecolor="#e4007f", s=50, label="train data")
plt.plot(X_underlying, y_underlying, c='#000000', label=r"$\sin(2\pi x)$")
plt.plot(X_underlying, y_underlying_pred, c='#e4007f', linestyle="--", label="$deg. = 8$")
plt.plot(X_underlying, y_underlying_pred_reg, c='#f19ec2', linestyle="-.", label="$deg. = 8, \ell_2 reg$")
plt.ylim(-1.5, 1.5)
plt.annotate("lambda={}".format(reg_lambda), xy=(0.82, -1.4))
plt.legend(fontsize='large')
plt.savefig('ml-vis4.pdf')
plt.show()
要用其他的损失函数和优化器计算一下效果哦
Runner类介绍
根据模型的产生流程,Runner类的成员函数定义如下:
- init 函数:实例化Runner类时默认调用,需要传入模型、损失函数、优化器和评价指标等;
- train函数:完成模型训练,指定模型训练需要的训练集和验证集;
- evaluate函数:通过对训练好的模型进行评价,在验证集或测试集上查看模型训练效果;
- predict函数:选取一条数据对训练好的模型进行预测;
- save_model函数:模型在训练过程和训练结束后需要进行保存;
- load_model函数:调用加载之前保存的模型。
class Runner(object):
    def __init__(self, model, optimizer, loss_fn, metric):
        self.model = model         # 模型
        self.optimizer = optimizer # 优化器
        self.loss_fn = loss_fn     # 损失函数
        self.metric = metric       # 评估指标

    # 模型训练
    def train(self, train_dataset, dev_dataset=None, **kwargs):
        pass

    # 模型评价
    def evaluate(self, data_set, **kwargs):
        pass

    # 模型预测
    def predict(self, x, **kwargs):
        pass

    # 模型保存
    def save_model(self, save_path):
        pass

    # 模型加载
    def load_model(self, model_path):
        pass
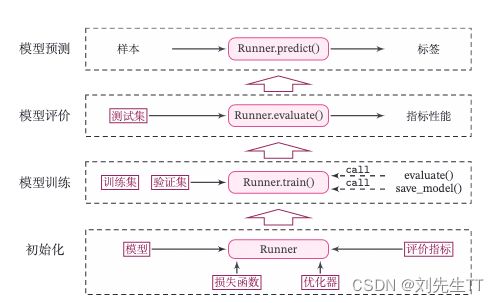
Runner类的流程如图2.8所示,可以分为 4 个阶段:
- 初始化阶段:传入模型、损失函数、优化器和评价指标。
- 模型训练阶段:基于训练集调用train()函数训练模型,基于验证集通过evaluate()函数验证模型。通过save_model()函数保存模型。
- 模型评价阶段:基于测试集通过evaluate()函数得到指标性能。
- 模型预测阶段:给定样本,通过predict()函数得到该样本标签。
2.5 基于线性回归的波士顿房价预测
目的:使用线性回归来对马萨诸塞州波士顿郊区的房屋进行预测。
2.5.1数据清洗
2.5.1.1 数据清洗
读取数据
#读取数据集
data_boston_house_prices = pd.read_csv('boston_house_prices.csv')
检查是否存在异常值
data_boston_house_prices .isna().sum()
可知不存在异常值,如果异常值,参考实验一
使用数据的均值处理离散值
#使用均值处理缺失值
input = input.fillna(input.mean())
处理异常值
output = pd.get_dummies(output,dummy_na=True)
总代码
import pandas as pd
import torch
#读取数据集
data_boston_house_prices = pd.read_csv('boston_house_prices.csv')
#读取输出
input_boston_house_prices,output_boston_house_prices = data_boston_house_prices.iloc[:,0:12],data_boston_house_prices.iloc[:,12]
#处理缺失值
input_boston_house_prices,output_boston_house_prices = input_boston_house_prices.fillna(input_boston_house_prices.mean()),output_boston_house_prices.fillna(output_boston_house_prices.mean())
另一种检测
import matplotlib.pyplot as plt # 可视化工具

# 箱线图查看异常值分布
def boxplot(data, fig_name):
    # 绘制每个属性的箱线图
    data_col = list(data.columns)

    # 连续画几个图片
    plt.figure(figsize=(5, 5), dpi=300)
    # 子图调整
    plt.subplots_adjust(wspace=0.6)
    # 每个特征画一个箱线图
    for i, col_name in enumerate(data_col):
        plt.subplot(3, 5, i+1)
        # 画箱线图
        plt.boxplot(data[col_name],
                    showmeans=True,
                    meanprops={"markersize":1,"marker":"D","markeredgecolor":'#f19ec2'}, # 均值的属性
                    medianprops={"color":'#e4007f'}, # 中位数线的属性
                    whiskerprops={"color":'#e4007f', "linewidth":0.4, 'linestyle':"--"},
                    flierprops={"markersize":0.4},
                    )
        # 图名
        plt.title(col_name, fontdict={"size":5}, pad=2)
        # y方向刻度
        plt.yticks(fontsize=4, rotation=90)
        plt.tick_params(pad=0.5)
        # x方向刻度
        plt.xticks([])
    plt.savefig(fig_name)
    plt.show()

boxplot(data, 'ml-vis5.pdf')
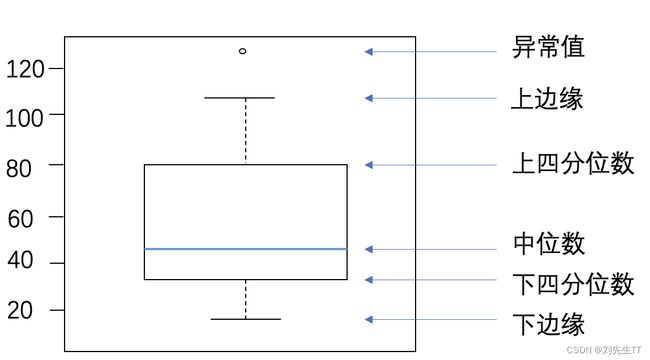
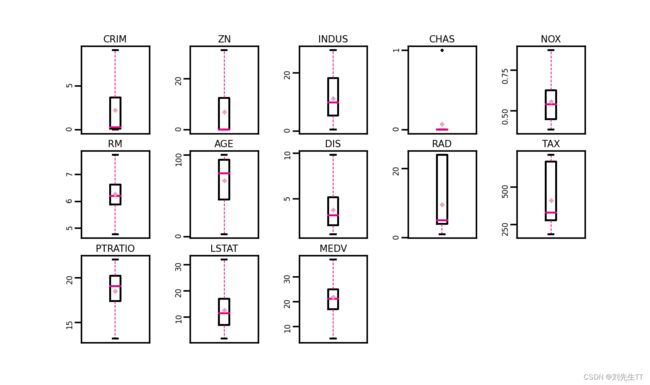
通过箱线图我们可以得出大部分数据良好均在上下边缘内,但例如RM这种变量仍存在大量的异常值,使用临界值将这些异常值替换.
data = data_price_boston
# 四分位处理异常值
num_features=data.select_dtypes(exclude=['object','bool']).columns.tolist()

for feature in num_features:
    if feature =='CHAS':
        continue

    Q1  = data[feature].quantile(q=0.25) # 下四分位
    Q3  = data[feature].quantile(q=0.75) # 上四分位

    IQR = Q3-Q1
    top = Q3+1.5*IQR # 最大估计值
    bot = Q1-1.5*IQR # 最小估计值
    values=data[feature].values
    values[values > top] = top # 临界值取代噪声
    values[values < bot] = bot # 临界值取代噪声
    data[feature] = values.astype(data[feature].dtypes)

# 再次查看箱线图,异常值已被临界值替换(数据量较多或本身异常值较少时,箱线图展示会不容易体现出来)
boxplot(data, 'ml-vis6.pdf')
观察图形可知,各个变量均不存在异常值
2.5.1.2 数据集划分
最后一列为房价,前面为放假影响因素,据此分割数据集,并将数据集分为训练集和测试集合,由于模型简单,不考虑验证集
# 划分训练集和测试集
def train_test_split(X, y, train_percent=0.8):
    n = len(X)
    shuffled_indices = paddle.randperm(n) # 返回一个数值在0到n-1、随机排列的1-D Tensor
    train_set_size = int(n*train_percent)
    train_indices = shuffled_indices[:train_set_size]
    test_indices = shuffled_indices[train_set_size:]

    X = X.values
    y = y.values

    X_train=X[train_indices]
    y_train = y[train_indices]

    X_test = X[test_indices]
    y_test = y[test_indices]

    return X_train, X_test, y_train, y_test


X = data.drop(['MEDV'], axis=1)
y = data['MEDV']

X_train, X_test, y_train, y_test = train_test_split(X,y)# X_train每一行是个样本,shape[N,D]
2.5.1.2 特征工程
房价影响因素中有些数据可能是相关性比较大,对房价的影响程度相同,这时候可以整合到一个影响因素中.这时候我们可以使用Spss软件进行分析,这里为了简便.我就不引入了.具体流程可以看使用spss做各种相关性分析的方法和步骤
由于不同单位的量纲不同,这里我们进行归一化来去量纲处理
#转换为张量
X_train = torch.as_tensor(X_train,dtype=torch.float32)
X_test = torch.as_tensor(X_test,dtype=torch.float32)
y_train = torch.as_tensor(y_train,dtype=torch.float32)
y_test = torch.as_tensor(y_test,dtype=torch.float32)

X_min = torch.min(X_train,axis=0)
X_max = torch.max(X_train,axis=0)
#进行去量纲操作
X_train = (X_train-X_min.values)/(X_max.values-X_min.values)
X_test  = (X_test-X_min.values)/(X_max.values-X_min.values)

# 训练集构造
train_dataset=(X_train,y_train)
# 测试集构造
test_dataset=(X_test,y_test)
2.5.2 模型构建
因为有12变量影响房价,所以我们需要12个权重w和一个偏移量b来进行预测.
模型: y = w 1 x 1 + . . . . w 12 x 12 + b y=w_{1}x_{1}+....w_{12}x^{12}+b y=w1x1+....w12x12+b
from op impoer Linear
# 模型实例化
input_size = 12
model=Linear(input_size)
2.5.3完善Runner类
误差函数使用均方误差
from torch.nn import MSELoss
mse_loss = MSELoss()
Runner类的完善
import  os
class Runner(object):
    class Runner(object):
        def __init__(self, model, optimizer, loss_fn, metric):
            # 优化器和损失函数为None,不再关注

            # 模型
            self.model = model
            # 评估指标
            self.metric = metric
            # 优化器
            self.optimizer = optimizer

        def train(self, dataset, reg_lambda, model_dir):
            X, y = dataset
            self.optimizer(self.model, X, y, reg_lambda)

            # 保存模型
            self.save_model(model_dir)

        def evaluate(self, dataset, **kwargs):
            X, y = dataset

            y_pred = self.model(X)
            result = self.metric(y_pred, y)

            return result

        def predict(self, X, **kwargs):
            return self.model(X)

        def save_model(self, model_dir):
            if not os.path.exists(model_dir):
                os.makedirs(model_dir)

            params_saved_path = os.path.join(model_dir, 'params.pdtensor')
            torch.save(model.params, params_saved_path)

        def load_model(self, model_dir):
            params_saved_path = os.path.join(model_dir, 'params.pdtensor')
            self.model.params = torch.load(params_saved_path)

    optimizer = optimizer_lsm

    # 实例化Runner
    runner = Runner(model, optimizer=optimizer, loss_fn=None, metric=mse_loss)
2.5.4模型训练
# 模型保存文件夹
saved_dir = models'

# 启动训练
runner.train(train_dataset,reg_lambda=0,model_dir=saved_dir)
打印出权重
# 实例化Runner
runner = Runner(model, optimizer=optimizer, loss_fn=None, metric=mse_loss)
# 模型保存文件夹
saved_dir = '/models'
# 启动训练
runner.train(train_dataset, reg_lambda=0, model_dir=saved_dir)
columns_list = data.columns.to_list()
weights = runner.model.params['w'].tolist()
b = runner.model.params['b'].item()

for i in range(len(weights)):
    print(columns_list[i],"weight:",weights[i])

print("b:",b)
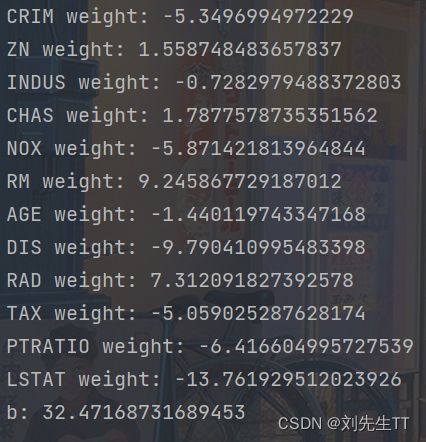
结果分析:从输出结果看,CRIM、PTRATIO等的权重为负数,表示该镇的人均犯罪率与房价负相关,学生与教师比例越大,房价越低。RAD和CHAS等为正,表示到径向公路的可达性指数越高,房价越高;临近Charles River房价高。
2.5.5模型测试
# 加载模型权重
runner.load_model(saved_dir)
mse = runner.evaluate(test_dataset)
print('MSE:', mse.item())
![]()
2.5.6模型预测
runner.load_model(saved_dir)
pred = runner.predict(X_test[:1])
print("真实房价:",y_test[:1].item())
print("预测的房价:",pred.item())
问题1:使用类实现机器学习模型的基本要素有什么优点?
- 将代码封装成类,接近人的思维,更容易使人理解。
- 可以复用,如果代码出错,只需更改类中的代码即可
- 提高效率,不用写冗余代码
- 可以装牛,体现python面向对象编程的特点

问题2:算子op、优化器opitimizer放在单独的文件中,主程序在使用时调用该文件。这样做有什么优点? - 算法中的分而治之思想,将不同代码存放到单独文件,便于归纳整理,同时处理起来方便,如果都放到一起,不仅查找不方便,而且代码过长,容易引起烦躁。
- 调用算子的时候就不用每次再写代码了,直接Import一下就好了。修改也方便。
问题3:线性回归通常使用平方损失函数,能否使用交叉熵损失函数?为什么?
在回答这道问题之前,我真不是很懂这两个损失函数之前的具体区别,还好现在是大数据时代,去网上搜了搜。所以说学习东西,不在乎数量,在于质量。
交叉熵损失中有激活函数sigmoid,最后得出来是判断某一个样本训练成功的概率,而不是与实际值之间的举例,所以交叉熵更适合分类任务,不适合回归。平方损失函数是实际值与目标值之间的误差,更关注得是二者之间得距离,所以更适合线性回归。均方误差求解比交叉熵求解更方便。
收获
这次实验写了半天,难度增加了,第一次用类进行编程,体会到了类的好处,自己写了一维的线性回归底层代码,就写了好多,而pytorch就仅仅用了几行代码就训练好了,且兼容性更强。了解到了不同损失函数之间的异同,为自己以后训练网络的选择准则多增一份知识,积少成多。同时在计算一维线性函数求导的时候温习了数学知识,所谓温故而知新,学过的不忘,才能更好的了解到新知识,不会丢了西瓜捡芝麻。除了第一个代码是自己从头到尾写下来的,其余的还是要借鉴老师的代码,共同努力,一起进步!!

