Matplotlib绘制折线图,条形图,柱状图,面积图
Matplotlib绘制折线图,条形图,柱状图,面积图
- 一.折线图
-
- 实例1,绘制未来15天内的最高气温和最低气温
- 二.绘制柱形图或者堆积柱形图
-
- 1. 绘制一个具有两组形状的柱状图
- 2.绘制堆积柱状图
- 3.绘制带有误差棒的柱形图
- 实例分析:2013-2019年淘宝和天猫平台的GMV
- 三.绘制条形图
-
- 1.绘制多组条形图
- 2.绘制堆叠条形图
- 3.添加误差棒
- 实例:各商品种类的网购替代率
- 四.绘制堆积面积图
-
- 实例:物流公司物流费用统计
matplotlib的参数配置:http://t.csdn.cn/TiI79
一.折线图
使用pyplot的plot()函数绘制折线图.plot函数的语法格式如下:
plot(x,y,fmt,scalex=True,scaley=True,data=None,label=None)
- x:表示x轴的数据
- y:表示y轴的数据
- fmt:表示快速设置线条样式的格式字符串
- label:表示应用图例的标签文本
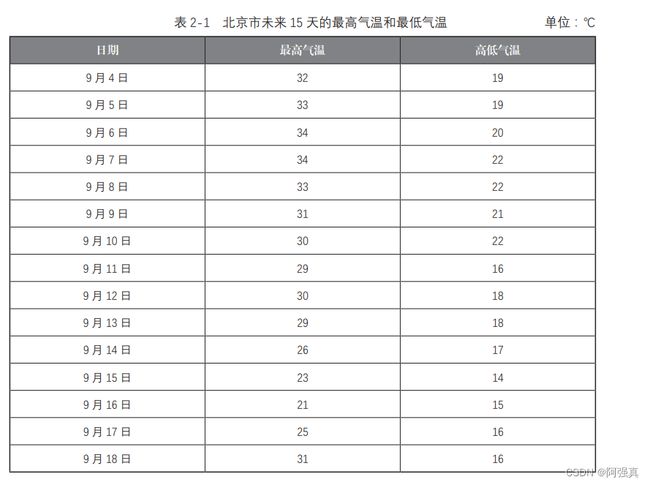
实例1,绘制未来15天内的最高气温和最低气温
根据上表的数据,将日期这一列作为x轴的数据,将最高气温和最低气温两列的数据作为y轴的数据,具体代码如下:
import matplotlib.pyplot as plt
import numpy as np
x = np.arange(4, 19)
y_max = np.array([32, 33, 34, 34, 33, 31, 30, 29, 30, 29, 26, 23, 21, 25, 31])
y_min = np.array([19, 19, 20, 22, 22, 21, 22, 16, 18, 18, 17, 14, 15, 16, 16])
# 绘制折线图
plt.plot(x, y_max,color="m")
plt.plot(x, y_min,color='r')
plt.grid()
plt.show()
以上代码首先导入了 matplotlib.pyplot 和 numpy 模块,分别将这两个模块重命名为 plt 和 np,其次将表中的数据分别作为 x 轴和 y 轴的数据,然后连续两次调用 plot() 函数分别绘 制了两条折线,最后调用 show() 函数进行展示
图 中,x 轴代表日期,y 轴代表温度,位于上方的紫色折线和下方的红色折线分别 代表最高温度和最低温度。由图 2-1 可知,北京市未来 15 天的最高气温和最低气温都呈现 逐步下降后反弹的趋势
二.绘制柱形图或者堆积柱形图
使用 pyplot 的 bar() 函数可以快速绘制柱形图或堆积柱形图。bar() 函数的语法格式如下所示 :
bar(x, height, width=0.8, bottom=None, align='center',
 data=None, tick_label=None, xerr=None, yerr=None,
 error_kw=None)
该函数常用参数的含义如下。
- x :表示柱形的 x 坐标值。
- height :表示柱形的高度。
- width :表示柱形的宽度,默认为 0.8。
- bottom :表示柱形底部的 y 坐标值,默认为 0。
- align :表示柱形的对齐方式,有 ‘center’ 和 ‘edge’ 两个取值,其中 ‘center’ 表示将柱形与 刻度线居中对齐 ;‘edge’ 表示将柱形的左边与刻度线对齐。
- tick_label :表示柱形对应的刻度标签。
- xerr,yerr :若未设为 None,则需要为柱形图添加水平 / 垂直误差棒。
- error_kw :表示误差棒的属性字典,字典的键对应 errorbar() 函数的关键字参数
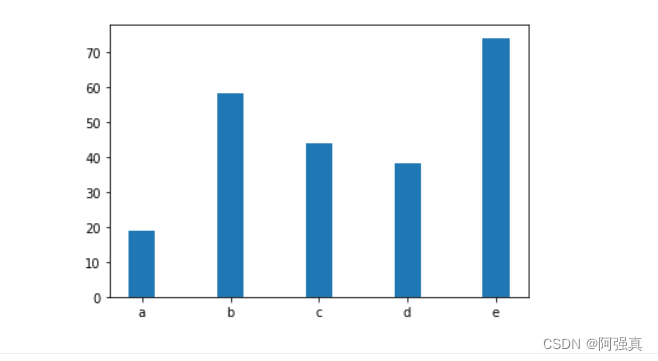
示例代码:
import numpy as np
import matplotlib.pyplot as plt
x=np.arange(5)#生成array([0, 1, 2, 3, 4])
y=np.array([19,58,44,38,74])
# 设置柱形的宽度
bar_width=0.3
# 绘制柱形图
plt.bar(x,y,tick_label=["a",'b','c','d','e'],width=bar_width)
plt.show()
1. 绘制一个具有两组形状的柱状图
import numpy as np
import matplotlib.pyplot as plt
x=np.arange(5)#生成array([0, 1, 2, 3, 4])
y1=np.array([19,58,44,38,74])
y2=np.array([38,59,64,78,54])
# 设置柱形的宽度
bar_width=0.3
# 绘制柱形图
plt.bar(x,y,tick_label=["a",'b','c','d','e'],width=bar_width)
plt.bar(x+bar_width,y2,width=bar_width)
plt.show()
[外链图片转存失败,源站可能有防盗链机制,建议将图片保存下来直接上传(img-mYgp949R-1664604503133)(image-20221001131914204.png)]
2.绘制堆积柱状图
在使用 pyplot 的 bar() 函数绘制图表时,可以通过给 bottom 参数传值的方式控制柱形的 y 值,使后绘制的柱形位于先绘制的柱形的上方。例如,使用 bar() 函数绘制由两组柱形堆叠而 成的堆积柱形图,代码如下。
import numpy as np
import matplotlib.pyplot as plt
x=np.arange(5)#生成array([0, 1, 2, 3, 4])
y1=np.array([19,58,44,38,74])
y2=np.array([38,59,64,78,54])
# 设置柱形的宽度
bar_width=0.3
# 绘制柱形图
plt.bar(x,y,tick_label=["a",'b','c','d','e'],width=bar_width)
plt.bar(x,y2,bottom=y1,width=bar_width)#把y1放在底部
plt.show()
3.绘制带有误差棒的柱形图
import numpy as np
import matplotlib.pyplot as plt
x=np.arange(5)#生成array([0, 1, 2, 3, 4])
y1=np.array([19,58,44,38,74])
y2=np.array([38,59,64,78,54])
# 设置柱形的宽度
bar_width=0.3
# 这里是误差
error=[2,1,2.5,3,4]
# 绘制柱形图
plt.bar(x,y,tick_label=["a",'b','c','d','e'],width=bar_width)
plt.bar(x,y2,bottom=y1,width=bar_width,yerr=error)#把y1放在底部
plt.show()
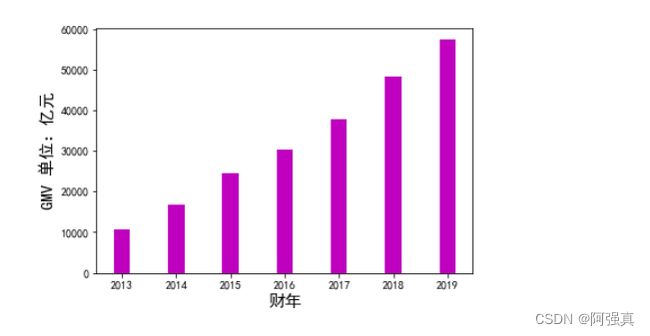
实例分析:2013-2019年淘宝和天猫平台的GMV
随着互联网与电子商务的快速发展,人们的消费模式发生了翻天覆地的变化,越来越多 的消费者选择网络购物。阿里巴巴集团作为中国电商的引领者,其旗下的淘宝和天猫是深 受消费者欢迎的网购平台。据阿里巴巴集团财务统计,2013—2019 财年淘宝和天猫平台的 GMV(Gross Merchandise Volume,一定时间内的成交总额)如下表所示
import matplotlib.pyplot as plt
# 支持中文
plt.rcParams['font.sans-serif'] = ['SimHei']  # 用来正常显示中文标签
plt.rcParams['axes.unicode_minus'] = False  # 用来正常显示负号
import numpy as np
import matplotlib.pyplot as plt
x=np.array([2013,2014,2015,2016,2017,2018,2019])
y=np.array([10770,16880,24440,30290,37670,48200,57270])
# 设置柱形的宽度
bar_width=0.3
# 设置标签
plt.xlabel("财年",size=15)
plt.ylabel("GMV 单位:亿元",size=15,rotation=90)
# 绘制柱形图
plt.bar(x,y,width=bar_width,color='m')
plt.show()
三.绘制条形图
使用 pyplot 的 barh() 函数可以快速绘制条形图或堆积条形图,barh() 函数的语法格式如下所示 :
barh(y, width, height=0.8, left=None, align='center')
该函数常用参数的含义如下。
- y :表示条形的 y 坐标值。
- width :表示条形的宽度,默认值为 0.8。
- height :表示条形的高度。
- left :条形左侧的 x 坐标,默认为 0
- align :表示柱形的对齐方式,有 ‘center’ 和 ‘edge’ 两个取值,其中 ‘center’ 表示将柱形与 刻度线居中对齐 ;‘edge’ 表示将柱形的左边与刻度线对齐。
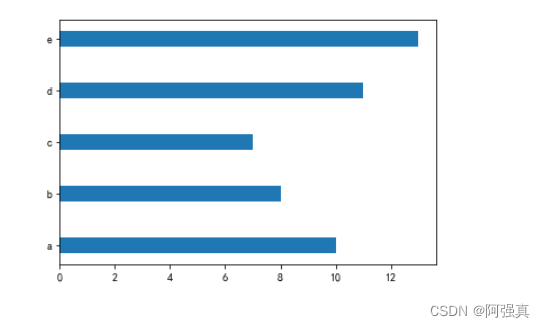
简单条形图:
import numpy as np
import matplotlib.pyplot as plt
y = np.arange(5)
x1 = np.array([10, 8, 7, 11, 13])
# 条形的高度
bar_height = 0.3
# 绘制条形图
plt.barh(y, x1, tick_label=['a', 'b', 'c', 'd', 'e'], height=bar_height)
plt.show()
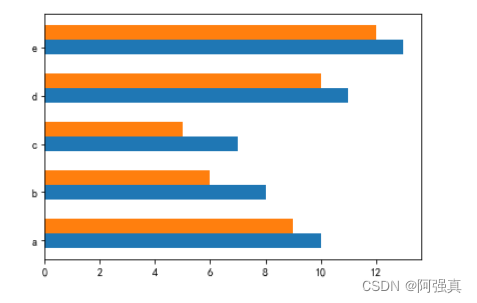
1.绘制多组条形图
y = np.arange(5)
x1 = np.array([10, 8, 7, 11, 13])
x2 = np.array([9, 6, 5, 10, 12])
# 条形的高度
bar_height = 0.3
# 根据多组数据绘制条形图
plt.barh(y, x1, tick_label=['a', 'b', 'c', 'd', 'e'], height=bar_height)
plt.barh(y+bar_height, x2, height=bar_height)
plt.show()
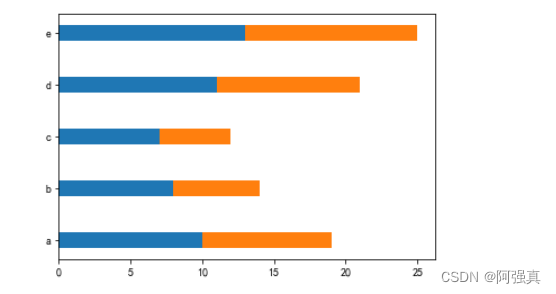
2.绘制堆叠条形图
plt.barh(y, x1, tick_label=['a', 'b', 'c', 'd', 'e'], height=bar_height)
plt.barh(y, x2, left=x1, height=bar_height)
plt.show()
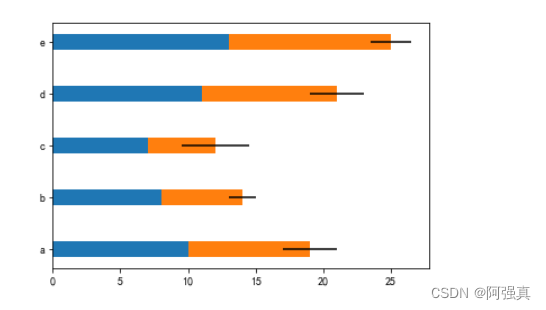
3.添加误差棒
error = [2, 1, 2.5, 2, 1.5]
plt.barh(y, x1, tick_label=['a', 'b', 'c', 'd', 'e'], height=bar_height)
plt.barh(y, x2, left=x1, height=bar_height, xerr=error)
plt.show()
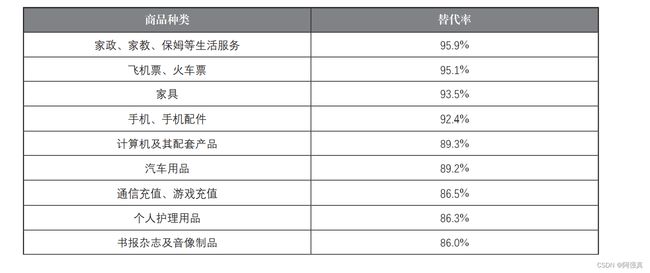
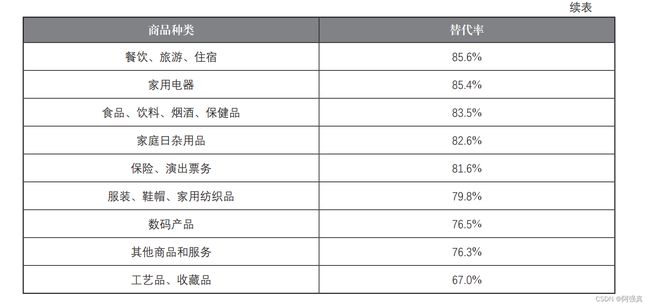
实例:各商品种类的网购替代率
如今已进入信息时代,网络购物已经成为人们日常生活的一部分,改变着人们的消费模 式和习惯,成为拉动居民消费的重要渠道。因此,研究网购消费对于研判经济形势、促进经 济转型升级有着重要的意义。2018 年国家统计局北京调查总队从网购活跃的人群中抽取了 771 个样本,并根据这些样本测算用户网购替代率(网购用户线上消费对线下消费的替代比 率)的情况,具体如下表所示:
import matplotlib.pyplot as plt
import numpy as np

# 显示中文
plt.rcParams['font.sans-serif'] = ['SimHei']
plt.rcParams['axes.unicode_minus'] = False
x = np.array([0.959, 0.951, 0.935, 0.924, 0.893,
              0.892, 0.865, 0.863, 0.860, 0.856,
              0.854, 0.835, 0.826, 0.816, 0.798,
              0.765, 0.763, 0.67])
y = np.arange(1, 19)
labels = [" 家政、家教、保姆等生活服务 ", " 飞机票、火车票 ", " 家具 ", " 手机、手机配件 ",
          " 计算机及其配套产品 ", " 汽车用品 ", " 通信充值、 游戏充值 ", " 个人护理用品 ",
          " 书报杂志及音像制品 ", " 餐饮、 旅游、 住宿 ", " 家用电器 ",
          " 食品、 饮料、 烟酒、 保健品 ", " 家庭日杂用品 ", " 保险、 演出票务 ",
          " 服装、鞋帽、家用纺织品 ", " 数码产品 ", " 其他商品和服务 ", " 工艺品、收藏品 "]
# 绘制条形图
plt.barh(y, x, tick_label=labels, align="center", height=0.6)
plt.show()
四.绘制堆积面积图
使用 pyplot 的 stackplot() 函数可以快速绘制堆积面积图,stackplot() 函数的语法格式如下 所示 :
stackplot(x, y, labels=(), baseline='zero', data=None, *args, **kwargs)
该函数常用参数的含义如下。
- x :表示 x 轴的数据,可以是一维数组。
- y :表示 y 轴的数据,可以是二维数组或一维数组序列。
- labels :表示每组折线及填充区域的标签。
- baseline :表示计算基线的方法,包括 ‘zero’、‘sym’、‘wiggle’ 和 ‘weighted_wiggle’。其中, ‘zero’ 表示恒定零基线,即简单的堆积图 ;‘sym’ 表示对称于零基线 ;‘wiggle’ 表示最小化平方 斜率的总和 ;‘weighted_wiggle’ 表示执行相同的操作,但权重用于说明每层的大小
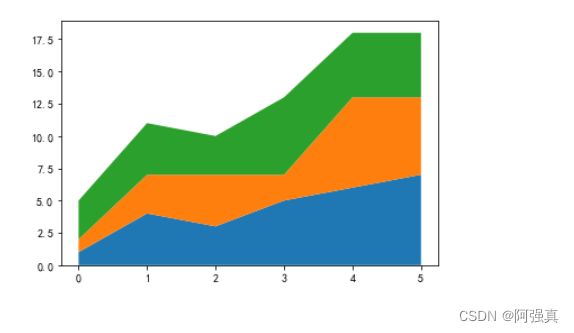
例如,使用 stackplot() 函数绘制由 3 条折线及下方填充区域堆叠的堆积面积图,代码如下
import numpy as np
import matplotlib.pyplot as plt
x = np.arange(6)
y1 = np.array([1,4,3,5,6,7])
y2 = np.array([1,3,4,2,7,6])
y3 = np.array([3,4,3,6,5,5])
# 绘制堆积面积图
plt.stackplot(x, y1, y2, y3)
plt.show()
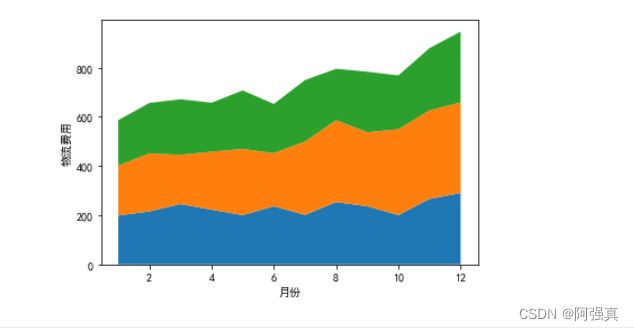
实例:物流公司物流费用统计
import numpy as np
plt.rcParams['font.sans-serif'] = ['SimHei']
plt.rcParams['axes.unicode_minus'] = False
import matplotlib.pyplot as plt
x = np.arange(1, 13)
y_a = np.array([198, 215, 245, 222, 200, 236, 201, 253, 236, 200, 266, 290])
y_b = np.array([203, 236, 200, 236, 269, 216, 298, 333, 301, 349, 360, 368])
y_c = np.array([185, 205, 226, 199, 238, 200, 250, 209, 246, 219, 253, 288])
plt.xlabel("月份")
plt.ylabel("物流费用")
# 绘制堆积面积图
plt.stackplot(x, y_a, y_b, y_c)
plt.show()
参考链接:Matplotlib — Visualization with Python
参考书籍:Python数据可视化%20(黑马程序员
