集成算法-随机森林与案例实战-泰坦尼克获救预测
集成算法-随机森林
Ensemble learning
目的:让机器学习效果更好,单个不行,群殴走起
Bagging:训练多个分类器取平均 f ( x ) = 1 / M ∑ m = 1 M f m ( x ) f(x)=1 / M \sum_{m=1}^{M} f_{m}(x) f(x)=1/M∑m=1Mfm(x)
Boosting:从弱学习器开始加强,通过加权来进行训练 F m ( x ) = F m − 1 ( x ) + argmin h ∑ i = 1 n L ( y i , F m − 1 ( x i ) + h ( x i ) ) F_{m}(x)=F_{m-1}(x)+\operatorname{argmin}_{h} \sum_{i=1}^{n} L\left(y_{i}, F_{m-1}\left(x_{i}\right)+h\left(x_{i}\right)\right) Fm(x)=Fm−1(x)+argminh∑i=1nL(yi,Fm−1(xi)+h(xi)) (加入一棵树,要比原来强)
Stacking:聚合多个分类或回归模型(可以分阶段来做)
Bagging模型
全称: bootstrap aggregation(说白了就是并行训练一堆分类器)
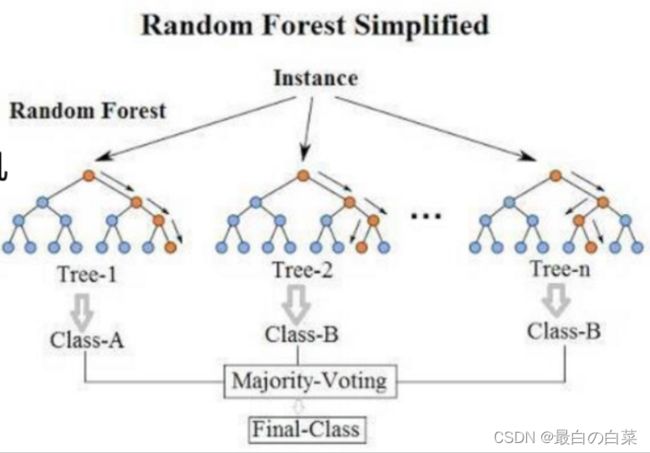
最典型的代表就是随机森林啦;森林:很多个决策树并行放在一起;随机:数据采样随机,特征选择随机
随机森林
构造树模型:
由于二重随机性,使得每个树基本上都不会一样,最终的结果也会不一样。
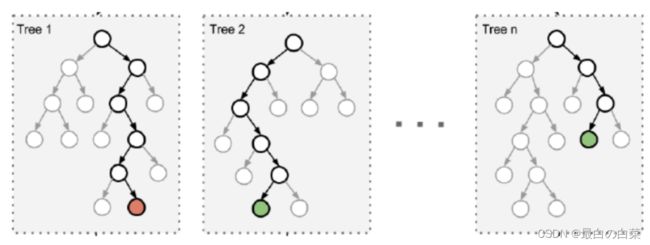
树模型:
之所以要进行随机,是要保证泛化能力,如果树都一样,那就没意义了!
随机森林优势
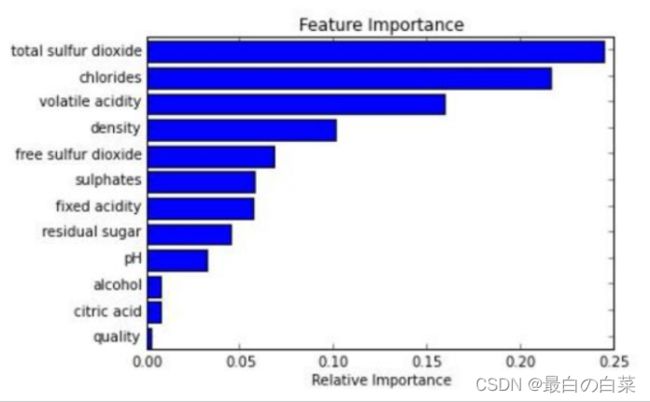
它能够处理很高维度(feature很多)的数据,并且不用做特征选择;在训练完后,它能够给出哪些feature比较重要;容易做成并行化方法,速度比较快;可以进行可视化展示,便于分析。
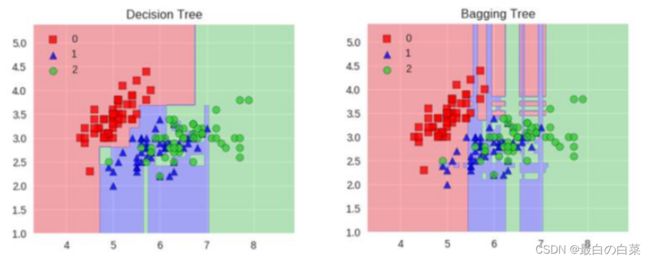
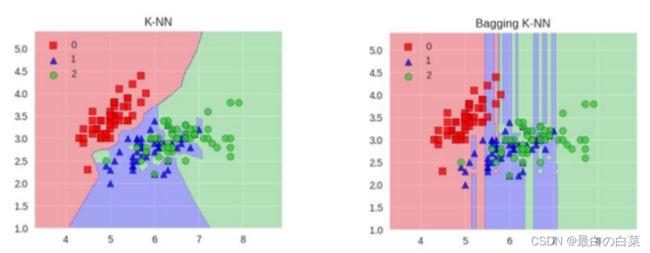
KNN模型:
KNN就不太适合,因为很难去随机让泛化能力变强!所以基础模型用树模型就可以!
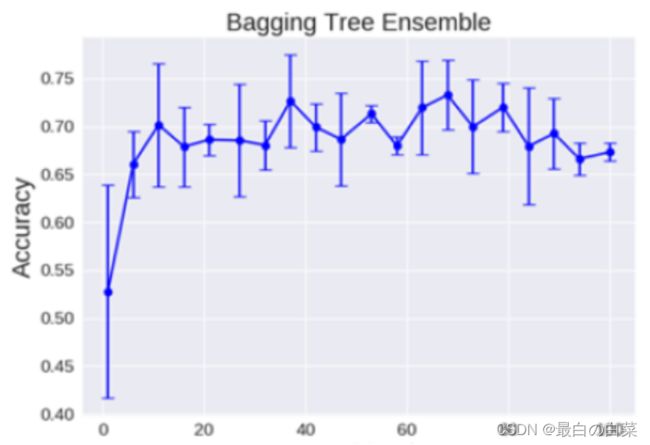
树模型:
理论上越多的树效果会越好,但实际上基本超过一定数量就差不多上下浮动了
Boosting模型
典型代表:AdaBoost, Xgboost
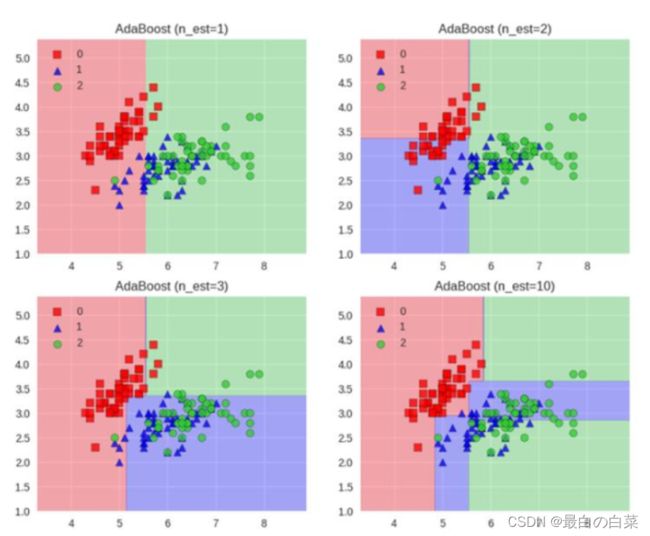
Adaboost会根据前一次的分类效果调整数据权重
解释:如果某一个数据在这次分错了,那么在下一次我就会给它更大的权重
最终的结果:每个分类器根据自身的准确性来确定各自的权重,再合体
Adaboost工作流程:每一次切一刀!最终合在一起。弱分类器这就升级了!
Stacking模型
堆叠:很暴力,拿来一堆直接上(各种分类器都来了)
可以堆叠各种各样的分类器(KNN,SVM,RF等等)
分阶段:第一阶段得出各自结果,第二阶段再用前一阶段结果训练
为了刷结果,不择手段!
堆叠在一起确实能使得准确率提升,但是速度是个问题。
集成算法是竞赛与论文神器,当我们更关注于结果时不妨来试试!
案例实战-泰坦尼克获救预测
import pandas #ipython notebook
titanic = pandas.read_csv("titanic_train.csv")
titanic.head(5)
# print (titanic.describe())
# age有些数据缺失,需要填充缺失值;用均值填充
titanic["Age"] = titanic["Age"].fillna(titanic["Age"].median())
print(titanic.describe())
   PassengerId    Survived      Pclass         Age       SibSp  \
count   891.000000  891.000000  891.000000  891.000000  891.000000
mean    446.000000    0.383838    2.308642   29.361582    0.523008
std     257.353842    0.486592    0.836071   13.019697    1.102743
min       1.000000    0.000000    1.000000    0.420000    0.000000
25%     223.500000    0.000000    2.000000   22.000000    0.000000
50%     446.000000    0.000000    3.000000   28.000000    0.000000
75%     668.500000    1.000000    3.000000   35.000000    1.000000
max     891.000000    1.000000    3.000000   80.000000    8.000000

            Parch        Fare
count  891.000000  891.000000
mean     0.381594   32.204208
std      0.806057   49.693429
min      0.000000    0.000000
25%      0.000000    7.910400
50%      0.000000   14.454200
75%      0.000000   31.000000
max      6.000000  512.329200
# 有些量不是数值,比如性别,就无法用数据显示;所以把字符的量映射成数值
print(titanic["Sex"].unique())

# Replace all the occurences of male with the number 0.
titanic.loc[titanic["Sex"] == "male", "Sex"] = 0
titanic.loc[titanic["Sex"] == "female", "Sex"] = 1
[‘male’ ‘female’]
print(titanic["Embarked"].unique())
# 还有一种nan缺失值,需要填充;不是数值就没法用均值填充;那么就谁最多就填充哪个
titanic["Embarked"] = titanic["Embarked"].fillna('S')
titanic.loc[titanic["Embarked"] == "S", "Embarked"] = 0
titanic.loc[titanic["Embarked"] == "C", "Embarked"] = 1
titanic.loc[titanic["Embarked"] == "Q", "Embarked"] = 2
[‘S’ ‘C’ ‘Q’ nan]
# Import the linear regression class
# 线性回归算法
from sklearn.linear_model import LinearRegression
# Sklearn also has a helper that makes it easy to do cross validation
from sklearn.model_selection import KFold

# The columns we'll use to predict the target
predictors = ["Pclass", "Sex", "Age", "SibSp", "Parch", "Fare", "Embarked"]

# Initialize our algorithm class
alg = LinearRegression()
# Generate cross validation folds for the titanic dataset.  It return the row indices corresponding to train and test.
# We set random_state to ensure we get the same splits every time we run this.
# 为Titanic数据集生成交叉验证折叠。它返回与训练和测试相对应的行索引
# 样本平均分成3份,3折交叉验证
kf = KFold(n_splits=3, shuffle=True, random_state=1)

# 交叉验证 划分训练集 验证集
predictions = []
for train, test in kf.split(titanic[predictions]):
    # The predictors we're using the train the algorithm.  Note how we only take the rows in the train folds.
    train_predictors = (titanic[predictors].iloc[train,:])
    # The target we're using to train the algorithm.
    train_target = titanic["Survived"].iloc[train]
    # Training the algorithm using the predictors and target.
    alg.fit(train_predictors, train_target)
    # We can now make predictions on the test fold
    test_predictions = alg.predict(titanic[predictors].iloc[test,:])
    predictions.append(test_predictions)
import numpy as np

# The predictions are in three separate numpy arrays. Concatenate them into one.
# We concatenate them on asix 0, as they only have one axis.
predictions = np.concatenate(predictions,axis=0)

# Map predictions to outcomes (only possible outcomes are 1 and 0)
predictions[predictions > .5] = 1  # 映射成分类结果 计算准确率
predictions[predictions <= .5] = 0

# 注意这一行与源代码有出入
accuracy = sum(predictions==titanic['Survived'])/len(predictions)

# 验证集的准确率
print(accuracy)
0.5342312008978676
# 逻辑回归
from sklearn import model_selection
from sklearn.linear_model import LogisticRegression
# Initialize our algorithm
alg = LogisticRegression(random_state=1)
# Compute the accuracy score for all the cross validation folds.  (much simpler than what we did before!)
scores = model_selection.cross_val_score(alg, titanic[predictors], titanic["Survived"], cv=3)
# Take the mean of the scores (because we have one for each fold)
print(scores.mean())
0.7957351290684623
titanic_test = pandas.read_csv("test.csv")
# 同样进行数据转换
titanic_test["Age"] = titanic_test["Age"].fillna(titanic["Age"].median())
titanic_test["Fare"] = titanic_test["Fare"].fillna(titanic_test["Fare"].median())
titanic_test.loc[titanic_test["Sex"] == "male", "Sex"] = 0
titanic_test.loc[titanic_test["Sex"] == "female", "Sex"] = 1
titanic_test["Embarked"] = titanic_test["Embarked"].fillna("S")

titanic_test.loc[titanic_test["Embarked"] == "S", "Embarked"] = 0
titanic_test.loc[titanic_test["Embarked"] == "C", "Embarked"] = 1
titanic_test.loc[titanic_test["Embarked"] == "Q", "Embarked"] = 2
# 使用随机森林模型
from sklearn import model_selection
from sklearn.ensemble import RandomForestClassifier

# 选择特征
predictors = ["Pclass", "Sex", "Age", "SibSp", "Parch", "Fare", "Embarked"]

# Initialize our algorithm with the default paramters
# n_estimators is the number of trees we want to make
# min_samples_split is the minimum number of rows we need to make a split
# min_samples_leaf is the minimum number of samples we can have at the place where a tree branch ends (the bottom points of the tree)
# n_estimators这个参数是指构造几棵树;min_samples_split最小的切分点;min_samples_leaf叶子节点最小的个数
alg = RandomForestClassifier(random_state=1, n_estimators=10, min_samples_split=2, min_samples_leaf=1)
# Compute the accuracy score for all the cross validation folds.  (much simpler than what we did before!)
# 交叉验证
kf = model_selection.KFold(n_splits=3, shuffle=True, random_state=1)
# 得到的分值
scores = model_selection.cross_val_score(alg, titanic[predictors], titanic["Survived"], cv=kf)

# Take the mean of the scores (because we have one for each fold)
# 取平均值
print(scores.mean())
0.7957351290684626
# 优化模型;调节参数
alg = RandomForestClassifier(random_state=1, n_estimators=100, min_samples_split=4, min_samples_leaf=2)
# Compute the accuracy score for all the cross validation folds.  (much simpler than what we did before!)
kf = model_selection.KFold(n_splits=3, shuffle=True, random_state=1)
scores = model_selection.cross_val_score(alg, titanic[predictors], titanic["Survived"], cv=kf)

# Take the mean of the scores (because we have one for each fold)
print(scores.mean())
0.8215488215488215
# 优化达到瓶颈;额外增加特征
# Generating a familysize column
titanic["FamilySize"] = titanic["SibSp"] + titanic["Parch"]

# The .apply method generates a new series
# 假设名字长度与逃生有关
titanic["NameLength"] = titanic["Name"].apply(lambda x: len(x))
# 名字里面有些称呼。。将称谓进行特征提取
import re

# A function to get the title from a name.
def get_title(name):
    # Use a regular expression to search for a title.  Titles always consist of capital and lowercase letters, and end with a period.
    title_search = re.search(' ([A-Za-z]+)\.', name)
    # If the title exists, extract and return it.
    if title_search:
        return title_search.group(1)
    return ""

# Get all the titles and print how often each one occurs.
titles = titanic["Name"].apply(get_title)
print(pandas.value_counts(titles))

# Map each title to an integer.  Some titles are very rare, and are compressed into the same codes as other titles.
title_mapping = {"Mr": 1, "Miss": 2, "Mrs": 3, "Master": 4, "Dr": 5, "Rev": 6, "Major": 7, "Col": 7, "Mlle": 8, "Mme": 8, "Don": 9, "Lady": 10, "Countess": 10, "Jonkheer": 10, "Sir": 9, "Capt": 7, "Ms": 2}
for k,v in title_mapping.items():
    titles[titles == k] = v

# Verify that we converted everything.
print(pandas.value_counts(titles))

# Add in the title column.
titanic["Title"] = titles
Mr          517
Miss        182
Mrs         125
Master       40
Dr            7
Rev           6
Mlle          2
Col           2
Major         2
Lady          1
Mme           1
Jonkheer      1
Countess      1
Capt          1
Don           1
Ms            1
Sir           1
Name: Name, dtype: int64
1     517
2     183
3     125
4      40
5       7
6       6
7       5
10      3
8       3
9       2
Name: Name, dtype: int64
# 选择最有价值的特征
import numpy as np
from sklearn.feature_selection import SelectKBest, f_classif
import matplotlib.pyplot as plt
predictors = ["Pclass", "Sex", "Age", "SibSp", "Parch", "Fare", "Embarked", "FamilySize", "Title", "NameLength"]

# Perform feature selection
selector = SelectKBest(f_classif, k=5)
selector.fit(titanic[predictors], titanic["Survived"])

# Get the raw p-values for each feature, and transform from p-values into scores
scores = -np.log10(selector.pvalues_)

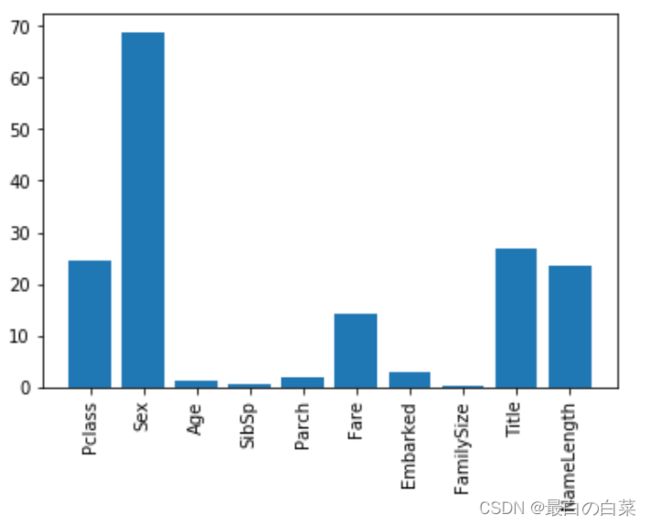
# Plot the scores.  See how "Pclass", "Sex", "Title", and "Fare" are the best?
plt.bar(range(len(predictors)), scores)
plt.xticks(range(len(predictors)), predictors, rotation='vertical')
plt.show()

# Pick only the four best features.
predictors = ["Pclass", "Sex", "Fare", "Title"]

alg = RandomForestClassifier(random_state=1, n_estimators=50, min_samples_split=8, min_samples_leaf=4)
# 不同的分类器集成在一起
from sklearn.ensemble import GradientBoostingClassifier
import numpy as np

# The algorithms we want to ensemble.
# We're using the more linear predictors for the logistic regression, and everything with the gradient boosting classifier.
algorithms = [
    [GradientBoostingClassifier(random_state=1, n_estimators=25, max_depth=3), ["Pclass", "Sex", "Age", "Fare", "Embarked", "FamilySize", "Title",]],
    [LogisticRegression(random_state=1), ["Pclass", "Sex", "Fare", "FamilySize", "Title", "Age", "Embarked"]]
]

# Initialize the cross validation folds
kf = KFold(n_splits=3, shuffle=True, random_state=1)

predictions = []
for train, test in kf.split(titanic[predictions]):
    train_target = titanic["Survived"].iloc[train]
    full_test_predictions = []
    # Make predictions for each algorithm on each fold
    for alg, predictors in algorithms:
        # Fit the algorithm on the training data.
        alg.fit(titanic[predictors].iloc[train,:], train_target)
        # Select and predict on the test fold.
        # The .astype(float) is necessary to convert the dataframe to all floats and avoid an sklearn error.
        test_predictions = alg.predict_proba(titanic[predictors].iloc[test,:].astype(float))[:,1]
        full_test_predictions.append(test_predictions)
    # Use a simple ensembling scheme -- just average the predictions to get the final classification.
    test_predictions = (full_test_predictions[0] + full_test_predictions[1]) / 2
    # Any value over .5 is assumed to be a 1 prediction, and below .5 is a 0 prediction.
    test_predictions[test_predictions <= .5] = 0
    test_predictions[test_predictions > .5] = 1
    predictions.append(test_predictions)

# Put all the predictions together into one array.
predictions = np.concatenate(predictions, axis=0)

# Compute accuracy by comparing to the training data.
accuracy = sum(predictions == titanic["Survived"]) / len(predictions)
print(accuracy)
0.5454545454545454
titles = titanic_test["Name"].apply(get_title)
# We're adding the Dona title to the mapping, because it's in the test set, but not the training set
title_mapping = {"Mr": 1, "Miss": 2, "Mrs": 3, "Master": 4, "Dr": 5, "Rev": 6, "Major": 7, "Col": 7, "Mlle": 8, "Mme": 8, "Don": 9, "Lady": 10, "Countess": 10, "Jonkheer": 10, "Sir": 9, "Capt": 7, "Ms": 2, "Dona": 10}
for k,v in title_mapping.items():
    titles[titles == k] = v
titanic_test["Title"] = titles
# Check the counts of each unique title.
print(pandas.value_counts(titanic_test["Title"]))

# Now, we add the family size column.
titanic_test["FamilySize"] = titanic_test["SibSp"] + titanic_test["Parch"]
1     240
2      79
3      72
4      21
7       2
6       2
10      1
5       1
Name: Title, dtype: int64
predictors = ["Pclass", "Sex", "Age", "Fare", "Embarked", "FamilySize", "Title"]

algorithms = [
    [GradientBoostingClassifier(random_state=1, n_estimators=25, max_depth=3), predictors],
    [LogisticRegression(random_state=1), ["Pclass", "Sex", "Fare", "FamilySize", "Title", "Age", "Embarked"]]
]

full_predictions = []
for alg, predictors in algorithms:
    # Fit the algorithm using the full training data.
    alg.fit(titanic[predictors], titanic["Survived"])
    # Predict using the test dataset.  We have to convert all the columns to floats to avoid an error.
    predictions = alg.predict_proba(titanic_test[predictors].astype(float))[:,1]
    full_predictions.append(predictions)

# The gradient boosting classifier generates better predictions, so we weight it higher.
predictions = (full_predictions[0] * 3 + full_predictions[1]) / 4
predictions
array([0.11608616, 0.47313163, 0.12527407, 0.1305029 , 0.52004311,
0.14392415, 0.63984342, 0.18138299, 0.6778233 , 0.12095368,
0.12054308, 0.21154493, 0.91148439, 0.10814111, 0.89180609,
0.87818912, 0.1650196 , 0.13910405, 0.53990167, 0.551889 ,
0.22474624, 0.53695164, 0.90686439, 0.39533671, 0.88099059,
0.10288684, 0.9105501 , 0.13737153, 0.31376951, 0.12631623,
0.11615631, 0.18430576, 0.54919197, 0.49415142, 0.42910392,
0.14215743, 0.50825222, 0.52417057, 0.13230705, 0.28222509,
0.11076129, 0.47224516, 0.09914069, 0.83492474, 0.90028243,
0.14946376, 0.31905677, 0.13752021, 0.89021874, 0.53830768,
0.36218205, 0.17945767, 0.83411368, 0.87864985, 0.17768223,
0.13743949, 0.10594413, 0.12307288, 0.12054944, 0.912131 ,
0.13115382, 0.15454243, 0.13002401, 0.66586834, 0.66161485,
0.87338584, 0.67298304, 0.29010609, 0.35826283, 0.84875193,
0.6621158 , 0.12688447, 0.55224753, 0.37379733, 0.91064833,
0.40981952, 0.12962877, 0.83764819, 0.15754935, 0.6621158 ,
0.68151841, 0.199957 , 0.20583641, 0.12054308, 0.1876183 ,
0.13090738, 0.65624963, 0.53041797, 0.65419471, 0.80328565,
0.53643959, 0.12053355, 0.89344775, 0.12962877, 0.29113646,
0.12308551, 0.86391073, 0.14611431, 0.58582725, 0.12192637,
0.90507833, 0.1487208 , 0.13752021, 0.1222069 , 0.62296229,
0.13079695, 0.1462909 , 0.13752021, 0.12968111, 0.17805571,
0.14320048, 0.65420052, 0.89686624, 0.67202899, 0.87958304,
0.14013126, 0.11761531, 0.69866896, 0.369716 , 0.86312987,
0.87861506, 0.12587932, 0.90367706, 0.12049219, 0.13752021,
0.56989533, 0.12588394, 0.63632568, 0.13347645, 0.13308618,
0.12658342, 0.51402225, 0.23707771, 0.10764469, 0.09812515,
0.12399516, 0.13310033, 0.16414568, 0.51965018, 0.12217545,
0.20839696, 0.905255 , 0.19234654, 0.16288954, 0.43252003,
0.10460664, 0.34145834, 0.1349816 , 0.47224516, 0.34281095,
0.9150228 , 0.13168701, 0.10605776, 0.48641364, 0.11240039,
0.12396799, 0.91030126, 0.57927986, 0.43252003, 0.51097235,
0.65419138, 0.57892305, 0.82284027, 0.12047252, 0.28604791,
0.58375961, 0.3031538 , 0.14606114, 0.90355986, 0.52205389,
0.12051582, 0.13260088, 0.12396504, 0.13162456, 0.13180211,
0.87544577, 0.87770527, 0.29748826, 0.83379914, 0.85394535,
0.15754935, 0.33614481, 0.90334825, 0.13752021, 0.91674518,
0.13621589, 0.85707224, 0.12265744, 0.1414593 , 0.13585733,
0.13547124, 0.2615505 , 0.49879649, 0.12640652, 0.72288221,
0.10727619, 0.85708385, 0.59003429, 0.16902874, 0.53774638,
0.64770495, 0.66407876, 0.6048431 , 0.87648409, 0.16545898,
0.26353344, 0.62898006, 0.16722597, 0.89151239, 0.12309417,
0.127611 , 0.12047645, 0.24831085, 0.79802557, 0.41149964,
0.30039786, 0.65422041, 0.21582703, 0.89844275, 0.12962877,
0.81556725, 0.13597309, 0.84397565, 0.12687469, 0.87848249,
0.59630913, 0.12492255, 0.65419471, 0.11396013, 0.14478507,
0.25316202, 0.89445045, 0.11621755, 0.13753447, 0.34495662,
0.12790127, 0.19280511, 0.1403001 , 0.81278248, 0.89757781,
0.8764603 , 0.8246372 , 0.32985937, 0.12054243, 0.33097517,
0.28960309, 0.88001689, 0.16051699, 0.86312987, 0.58951613,
0.74977708, 0.15427546, 0.39857128, 0.13320041, 0.12632896,
0.12051582, 0.13752021, 0.12962877, 0.83210887, 0.12687265,
0.10829711, 0.1268804 , 0.85114827, 0.65202653, 0.16804208,
0.12054308, 0.22527114, 0.12051582, 0.50825222, 0.14031173,
0.34621912, 0.13752021, 0.91585286, 0.63242282, 0.13162416,
0.85927351, 0.16037479, 0.12507105, 0.14380903, 0.17086699,
0.51978252, 0.66306258, 0.65419471, 0.64321196, 0.71428972,
0.10527009, 0.12049219, 0.36739267, 0.13162456, 0.12962877,
0.33858104, 0.59221078, 0.13162456, 0.50262011, 0.120044 ,
0.12221704, 0.78214546, 0.12631623, 0.33515934, 0.11974185,
0.11749083, 0.17758584, 0.12164696, 0.133141 , 0.65419471,
0.8211081 , 0.33592591, 0.67771416, 0.20869482, 0.42050239,
0.13919512, 0.13794091, 0.12051779, 0.61683764, 0.89999581,
0.67464103, 0.23647358, 0.1765905 , 0.1213635 , 0.18705969,
0.1222069 , 0.13464434, 0.16414568, 0.46045705, 0.90515213,
0.12485392, 0.86892053, 0.34709001, 0.14585039, 0.17320122,
0.81934824, 0.33252581, 0.13162416, 0.64291933, 0.12136688,
0.25679033, 0.15446923, 0.09326367, 0.21115849, 0.35136293,
0.17856622, 0.11747726, 0.14689857, 0.91334888, 0.33472757,
0.61877993, 0.16414568, 0.62126457, 0.16774844, 0.85266978,
0.89655915, 0.16545898, 0.24611915, 0.16006513, 0.70327315,
0.15827211, 0.85634043, 0.12054177, 0.13752021, 0.56988285,
0.10391274, 0.87788259, 0.86962861, 0.1305029 , 0.92015643,
0.15582768, 0.1309077 , 0.53155834, 0.89622127, 0.17553662,
0.15585283, 0.90915277, 0.16579567, 0.13122589, 0.87592006,
0.90842303, 0.48844403, 0.17292445, 0.19909204, 0.13524414,
0.13752021, 0.13987028, 0.5390601 , 0.5941846 , 0.16075475,
0.83407033, 0.12398808, 0.11946654, 0.14628145, 0.18797311,
0.38986125, 0.87810898, 0.56353165, 0.12784258, 0.1030095 ,
0.91276766, 0.14226138, 0.88795149, 0.12588196, 0.12914704,
0.90748673, 0.12667147, 0.91041256, 0.36696583, 0.30783741,
0.19327157, 0.15249874, 0.26395095, 0.65418889, 0.64831126,
0.65419471, 0.90753918, 0.56786184, 0.12962877, 0.85998813,
0.10048191, 0.12962877, 0.41631829])
问题报错解决
ModuleNotFoundError: No module named 'sklearn.cross_validation’
TypeError: init() got multiple values for argument 'n_splits’
https://blog.csdn.net/qq_35781239/article/details/100866176
https://www.cnblogs.com/xiaoyh/p/11321780.html
案例代码都是老版本,运行就有错误,解决完BUG之后,代码运行后的结果与老师的不一样,最有怀疑的两个结果集,一个是那个线性回归的准确率,还有一个是最后那个集成分类器的结果,准确度差了很多,感觉不应该存在这样的情况。。。。。反正也没咋听懂,以后遇到再深入学习。
