随机森林算法(Random Forest)Python实现
目录
前言
一、什么是Random Forest ?
1.1 什么是监督式机器学习?
1.2 什么是回归和分类?
1.3 什么是决策树?
1.4 什么是随机森林?
二、Random Forest 的构造过程
2.1 算法实现
2.2 数据的随机选取
2.3 待选特征的随机选取
2.4 相关概念解释
三、 Random Forest 优缺点
3.1 优点
3.2 缺点
四、Extra-Trees(极端随机树)
五、Random Forest 的Python实现
5.1 数据集
5.2 Random Forest的Python实现
5.3 Decision Tree、Random Forest和Extra-Trees对比
5.4 基于pandas和scikit-learn实现Random Forest
5.5 Random Forest 与其他机器学习分类算法对比
六、 Random Forest 应用方向
参考文章
前言
最近在学习一篇论文《Mining Quality Phrases from Massive Text Corpora》,讲的是如何从海量文本语料库中挖掘优质短语,其中用到了随机森林(Random Forest)算法,所以我去学习了一下,我博客之前专门针对决策树(Decision Tree)有过讲解,Random Forest 就是基于Decision Tree 的优化版本,下面我们来一起来讨论一下什么是Random Forest。
一、什么是Random Forest ?
作为高度灵活的一种机器学习算法,随机森林(Random Forest,简称RF)拥有广泛的应用前景,从市场营销到医疗保健保险,既可以用来做市场营销模拟的建模,统计客户来源,保留和流失,也可用来预测疾病的风险和病患者的易感性。最近几年的国内外大赛,包括2013年百度校园电影推荐系统大赛、2014年阿里巴巴天池大数据竞赛以及Kaggle数据科学竞赛,参赛者对随机森林的使用占有相当高的比例。所以可以看出,Random Forest在准确率方面还是相当有优势的。
那说了这么多,那随机森林到底是怎样的一种算法呢?
如果读者接触过决策树(Decision Tree)的话,那么会很容易理解什么是随机森林。随机森林就是通过集成学习的思想将多棵树集成的一种算法,它的基本单元是决策树,而它的本质属于机器学习的一大分支——集成学习(Ensemble Learning)方法。随机森林的名称中有两个关键词,一个是“随机”,一个就是“森林”。“森林”我们很好理解,一棵叫做树,那么成百上千棵就可以叫做森林了,这样的比喻还是很贴切的,其实这也是随机森林的主要思想--集成思想的体现。“随机”的含义我们会在下边部分讲到。
其实从直观角度来解释,每棵决策树都是一个分类器(假设现在针对的是分类问题),那么对于一个输入样本,N棵树会有N个分类结果。而随机森林集成了所有的分类投票结果,将投票次数最多的类别指定为最终的输出,这就是一种最简单的 Bagging 思想。
随机森林是一种功能强大且用途广泛的监督机器学习算法,它生长并组合多个决策树以创建"森林"。它可用于R和Python中的分类和回归问题。
在我们更详细地探索随机森林之前,让我们分解一下:
- 什么是监督学习?
- 什么是分类和回归?
- 什么是决策树?
了解这些概念中的每一个都将帮助您了解随机森林及其工作原理。所以让我们解释一下。
1.1 什么是监督式机器学习?
从给定的训练数据集中学习出一个函数(模型参数),当新的数据到来时,可以根据这个函数预测结果。监督学习的训练集要求包括输入输出,也可以说是特征和目标。训练集中的目标是由人标注的。监督学习就是最常见的分类(注意和聚类区分)问题,通过已有的训练样本(即已知数据及其对应的输出)去训练得到一个最优模型(这个模型属于某个函数的集合,最优表示某个评价准则下是最佳的),再利用这个模型将所有的输入映射为相应的输出,对输出进行简单的判断从而实现分类的目的。也就具有了对未知数据分类的能力。监督学习的目标往往是让计算机去学习我们已经创建好的分类系统(模型)。
监督学习是训练神经网络和决策树的常见技术。这两种技术高度依赖事先确定的分类系统给出的信息,对于神经网络,分类系统利用信息判断网络的错误,然后不断调整网络参数。对于决策树,分类系统用它来判断哪些属性提供了最多的信息。监督学习里典型的例子就是KNN、SVM。
1.2 什么是回归和分类?
在机器学习中,算法用于将某些观察结果、事件或输入分类到组中。例如,垃圾邮件过滤器会将每封电子邮件分类为"垃圾邮件"或"非垃圾邮件"。但是,电子邮件示例只是一个简单的示例;在业务环境中,这些模型的预测能力可以对如何做出决策以及如何形成战略产生重大影响,但稍后会详细介绍。
因此:回归和分类都是监督式机器学习问题,用于预测结果或结果的价值或类别。他们的区别是:
分类问题是用于将事物打上一个标签,通常结果为离散值。例如判断一幅图片上的动物是一只猫还是一只狗,分类通常是建立在回归之上,分类的最后一层通常要使用softmax函数进行判断其所属类别。分类并没有逼近的概念,最终正确结果只有一个,错误的就是错误的,不会有相近的概念。最常见的分类方法是逻辑回归,或者叫逻辑分类。
回归问题通常是用来预测一个值,如预测房价、未来的天气情况等等,例如一个产品的实际价格为500元,通过回归分析预测值为499元,我们认为这是一个比较好的回归分析。一个比较常见的回归算法是线性回归算法(LR)。另外,回归分析用在神经网络上,其最上层是不需要加上softmax函数的,而是直接对前一层累加即可。回归是对真实值的一种逼近预测。
区分两者的简单方法大概可以表述为,分类是关于预测标签(例如"垃圾邮件"或"不是垃圾邮件"),而回归是关于预测数量。
1.3 什么是决策树?
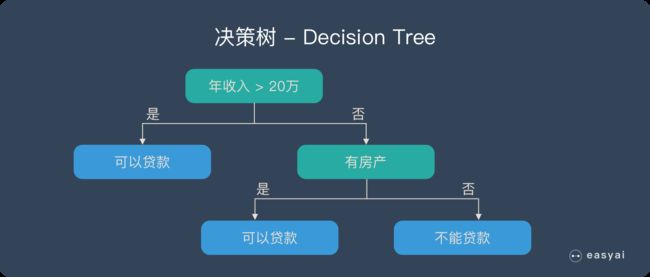
在解释随机森林前,需要先提一下决策树。决策树是一种很简单的算法,他的解释性强,也符合人类的直观思维。这是一种基于if-then-else规则的有监督学习算法,上面的图片可以直观的表达决策树的逻辑。
决策树的推导过程在我之前的博客中有详细的介绍
机器学习——决策树(一)_欢迎来到AI小书童的博客-CSDN博客
机器学习——决策树推导_欢迎来到AI小书童的博客-CSDN博客
1.4 什么是随机森林?
随机森林是由很多决策树构成的,不同决策树之间没有关联。
当我们进行分类任务时,新的输入样本进入,就让森林中的每一棵决策树分别进行判断和分类,每个决策树会得到一个自己的分类结果,决策树的分类结果中哪一个分类最多,那么随机森林就会把这个结果当做最终的结果。
二、Random Forest 的构造过程
2.1 算法实现
- 一个样本容量为N的样本,有放回的抽取N次,每次抽取1个,最终形成了N个样本。这选择好了的N个样本用来训练一个决策树,作为决策树根节点处的样本。
- 当每个样本有M个属性时,在决策树的每个节点需要分裂时,随机从这M个属性中选取出m个属性,满足条件m << M。然后从这m个属性中采用某种策略(比如说信息增益)来选择1个属性作为该节点的分裂属性。
- 决策树形成过程中每个节点都要按照步骤2来分裂(很容易理解,如果下一次该节点选出来的那一个属性是刚刚其父节点分裂时用过的属性,则该节点已经达到了叶子节点,无须继续分裂了),一直到不能够再分裂为止。注意整个决策树形成过程中没有进行剪枝。
- 按照步骤1~3建立大量的决策树,这样就构成了随机森林了。
2.2 数据的随机选取
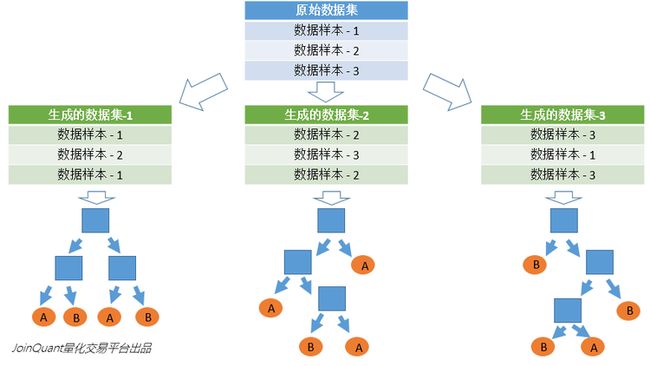
首先,从原始的数据集中采取有放回的抽样,构造子数据集,子数据集的数据量是和原始数据集相同的。不同子数据集的元素可以重复,同一个子数据集中的元素也可以重复。第二,利用子数据集来构建子决策树,将这个数据放到每个子决策树中,每个子决策树输出一个结果。最后,如果有了新的数据需要通过随机森林得到分类结果,就可以通过对子决策树的判断结果的投票,得到随机森林的输出结果了。如图3,假设随机森林中有3棵子决策树,2棵子树的分类结果是A类,1棵子树的分类结果是B类,那么随机森林的分类结果就是A类。
2.3 待选特征的随机选取
与数据集的随机选取类似,随机森林中的子树的每一个分裂过程并未用到所有的待选特征,而是从所有的待选特征中随机选取一定的特征,之后再在随机选取的特征中选取最优的特征。这样能够使得随机森林中的决策树都能够彼此不同,提升系统的多样性,从而提升分类性能。
下图中,蓝色的方块代表所有可以被选择的特征,也就是待选特征。黄色的方块是分裂特征。左边是一棵决策树的特征选取过程,通过在待选特征中选取最优的分裂特征(别忘了前文提到的ID3算法,C4.5算法,CART算法等等),完成分裂。右边是一个随机森林中的子树的特征选取过程。
2.4 相关概念解释
1.分裂:在决策树的训练过程中,需要一次次的将训练数据集分裂成两个子数据集,这个过程就叫做分裂。
2.特征:在分类问题中,输入到分类器中的数据叫做特征。以上面的股票涨跌预测问题为例,特征就是前一天的交易量和收盘价。
3.待选特征:在决策树的构建过程中,需要按照一定的次序从全部的特征中选取特征。待选特征就是在步骤之前还没有被选择的特征的集合。例如,全部的特征是 ABCDE,第一步的时候,待选特征就是ABCDE,第一步选择了C,那么第二步的时候,待选特征就是ABDE。
4.分裂特征:接待选特征的定义,每一次选取的特征就是分裂特征,例如,在上面的例子中,第一步的分裂特征就是C。因为选出的这些特征将数据集分成了一个个不相交的部分,所以叫它们分裂特征。
三、 Random Forest 优缺点
3.1 优点
- 它可以出来很高维度(特征很多)的数据,并且不用降维,无需做特征选择
- 它可以判断特征的重要程度
- 可以判断出不同特征之间的相互影响
- 不容易过拟合
- 训练速度比较快,容易做成并行方法
- 实现起来比较简单
- 对于不平衡的数据集来说,它可以平衡误差。
- 如果有很大一部分的特征遗失,仍可以维持准确度。
3.2 缺点
- 随机森林已经被证明在某些噪音较大的分类或回归问题上会过拟合
- 对于有不同取值的属性的数据,取值划分较多的属性会对随机森林产生更大的影响,所以随机森林在这种数据上产出的属性权值是不可信的
- 由于随机林使用许多决策树,因此在较大的项目上可能需要大量内存。这可以使它比其他一些更有效的算法慢
四、Extra-Trees(极端随机树)
ET或Extra-Trees(Extremely randomized trees,极端随机树)算法与随机森林算法十分相似,都是由许多决策树构成。极限树与随机森林的主要区别:
1. randomForest应用的是Bagging模型,extraTree使用的所有的样本,只是特征是随机选取的,因为分裂是随机的,所以在某种程度上比随机森林得到的结果更加好
2. 随机森林是在一个随机子集内得到最佳分叉属性,而ET是完全随机的得到分叉值,从而实现对决策树进行分叉的
五、Random Forest 的Python实现
5.1 数据集
网盘链接:https://pan.baidu.com/s/1PK2Ipbsdx1Gy5naFgiwEeA
提取码:t3u1
5.2 Random Forest的Python实现
# -*- coding: utf-8 -*-
import csv
from random import seed
from random import randrange
from math import sqrt


def loadCSV(filename):#加载数据,一行行的存入列表
    dataSet = []
    with open(filename, 'r') as file:
        csvReader = csv.reader(file)
        for line in csvReader:
            dataSet.append(line)
    return dataSet

# 除了标签列,其他列都转换为float类型
def column_to_float(dataSet):
    featLen = len(dataSet[0]) - 1
    for data in dataSet:
        for column in range(featLen):
            data[column] = float(data[column].strip())

# 将数据集随机分成N块,方便交叉验证,其中一块是测试集,其他四块是训练集
def spiltDataSet(dataSet, n_folds):
    fold_size = int(len(dataSet) / n_folds)
    dataSet_copy = list(dataSet)
    dataSet_spilt = []
    for i in range(n_folds):
        fold = []
        while len(fold) < fold_size:  # 这里不能用if,if只是在第一次判断时起作用,while执行循环,直到条件不成立
            index = randrange(len(dataSet_copy))
            fold.append(dataSet_copy.pop(index))  # pop() 函数用于移除列表中的一个元素(默认最后一个元素),并且返回该元素的值。
        dataSet_spilt.append(fold)
    return dataSet_spilt

# 构造数据子集
def get_subsample(dataSet, ratio):
    subdataSet = []
    lenSubdata = round(len(dataSet) * ratio)#返回浮点数
    while len(subdataSet) < lenSubdata:
        index = randrange(len(dataSet) - 1)
        subdataSet.append(dataSet[index])
    # print len(subdataSet)
    return subdataSet

# 分割数据集
def data_spilt(dataSet, index, value):
    left = []
    right = []
    for row in dataSet:
        if row[index] < value:
            left.append(row)
        else:
            right.append(row)
    return left, right

# 计算分割代价
def spilt_loss(left, right, class_values):
    loss = 0.0
    for class_value in class_values:
        left_size = len(left)
        if left_size != 0:  # 防止除数为零
            prop = [row[-1] for row in left].count(class_value) / float(left_size)
            loss += (prop * (1.0 - prop))
        right_size = len(right)
        if right_size != 0:
            prop = [row[-1] for row in right].count(class_value) / float(right_size)
            loss += (prop * (1.0 - prop))
    return loss

# 选取任意的n个特征,在这n个特征中,选取分割时的最优特征
def get_best_spilt(dataSet, n_features):
    features = []
    class_values = list(set(row[-1] for row in dataSet))
    b_index, b_value, b_loss, b_left, b_right = 999, 999, 999, None, None
    while len(features) < n_features:
        index = randrange(len(dataSet[0]) - 1)
        if index not in features:
            features.append(index)
    # print 'features:',features
    for index in features:#找到列的最适合做节点的索引,(损失最小)
        for row in dataSet:
            left, right = data_spilt(dataSet, index, row[index])#以它为节点的,左右分支
            loss = spilt_loss(left, right, class_values)
            if loss < b_loss:#寻找最小分割代价
                b_index, b_value, b_loss, b_left, b_right = index, row[index], loss, left, right
    # print b_loss
    # print type(b_index)
    return {'index': b_index, 'value': b_value, 'left': b_left, 'right': b_right}

# 决定输出标签
def decide_label(data):
    output = [row[-1] for row in data]
    return max(set(output), key=output.count)


# 子分割,不断地构建叶节点的过程
def sub_spilt(root, n_features, max_depth, min_size, depth):
    left = root['left']
    # print left
    right = root['right']
    del (root['left'])
    del (root['right'])
    # print depth
    if not left or not right:
        root['left'] = root['right'] = decide_label(left + right)
        # print 'testing'
        return
    if depth > max_depth:
        root['left'] = decide_label(left)
        root['right'] = decide_label(right)
        return
    if len(left) < min_size:
        root['left'] = decide_label(left)
    else:
        root['left'] = get_best_spilt(left, n_features)
        # print 'testing_left'
        sub_spilt(root['left'], n_features, max_depth, min_size, depth + 1)
    if len(right) < min_size:
        root['right'] = decide_label(right)
    else:
        root['right'] = get_best_spilt(right, n_features)
        # print 'testing_right'
        sub_spilt(root['right'], n_features, max_depth, min_size, depth + 1)

        # 构造决策树
def build_tree(dataSet, n_features, max_depth, min_size):
    root = get_best_spilt(dataSet, n_features)
    sub_spilt(root, n_features, max_depth, min_size, 1)
    return root
# 预测测试集结果
def predict(tree, row):
    predictions = []
    if row[tree['index']] < tree['value']:
        if isinstance(tree['left'], dict):
            return predict(tree['left'], row)
        else:
            return tree['left']
    else:
        if isinstance(tree['right'], dict):
            return predict(tree['right'], row)
        else:
            return tree['right']
            # predictions=set(predictions)
def bagging_predict(trees, row):
    predictions = [predict(tree, row) for tree in trees]
    return max(set(predictions), key=predictions.count)
# 创建随机森林
def random_forest(train, test, ratio, n_feature, max_depth, min_size, n_trees):
    trees = []
    for i in range(n_trees):
        train = get_subsample(train, ratio)#从切割的数据集中选取子集
        tree = build_tree(train, n_features, max_depth, min_size)
        # print 'tree %d: '%i,tree
        trees.append(tree)
    # predict_values = [predict(trees,row) for row in test]
    predict_values = [bagging_predict(trees, row) for row in test]
    return predict_values
# 计算准确率
def accuracy(predict_values, actual):
    correct = 0
    for i in range(len(actual)):
        if actual[i] == predict_values[i]:
            correct += 1
    return correct / float(len(actual))


if __name__ == '__main__':
    seed(1)
    dataSet = loadCSV('D:/深度之眼/sonar-all-data.csv')
    column_to_float(dataSet)#dataSet
    n_folds = 5
    max_depth = 15
    min_size = 1
    ratio = 1.0
    # n_features=sqrt(len(dataSet)-1)
    n_features = 15
    n_trees = 10
    folds = spiltDataSet(dataSet, n_folds)#先是切割数据集
    scores = []
    for fold in folds:
        train_set = folds[
                    :]  # 此处不能简单地用train_set=folds,这样用属于引用,那么当train_set的值改变的时候,folds的值也会改变,所以要用复制的形式。(L[:])能够复制序列,D.copy() 能够复制字典,list能够生成拷贝 list(L)
        train_set.remove(fold)#选好训练集
        # print len(folds)
        train_set = sum(train_set, [])  # 将多个fold列表组合成一个train_set列表
        # print len(train_set)
        test_set = []
        for row in fold:
            row_copy = list(row)
            row_copy[-1] = None
            test_set.append(row_copy)
            # for row in test_set:
            # print row[-1]
        actual = [row[-1] for row in fold]
        predict_values = random_forest(train_set, test_set, ratio, n_features, max_depth, min_size, n_trees)
        accur = accuracy(predict_values, actual)
        scores.append(accur)
    print ('Trees is %d' % n_trees)
    print ('scores:%s' % scores)
    print ('mean score:%s' % (sum(scores) / float(len(scores))))
打印结果
Trees is 10
scores:[0.6341463414634146, 0.6829268292682927, 0.6341463414634146, 0.5853658536585366, 0.5853658536585366]
mean score:0.624390243902439
5.3 Decision Tree、Random Forest和Extra-Trees对比
# -*- coding: utf-8 -*-
from sklearn.model_selection import cross_val_score
from sklearn.datasets import make_blobs
from sklearn.ensemble import RandomForestClassifier
from sklearn.ensemble import ExtraTreesClassifier
from sklearn.tree import DecisionTreeClassifier

##创建100个类共10000个样本,每个样本10个特征
X, y = make_blobs(n_samples=10000, n_features=10, centers=100,random_state=0)

## 决策树
clf1 = DecisionTreeClassifier(max_depth=None, min_samples_split=2,random_state=0)
scores1 = cross_val_score(clf1, X, y)
print(scores1.mean())

## 随机森林
clf2 = RandomForestClassifier(n_estimators=10, max_depth=None,min_samples_split=2, random_state=0)
scores2 = cross_val_score(clf2, X, y)
print(scores2.mean())

## ExtraTree分类器集合
clf3 = ExtraTreesClassifier(n_estimators=10, max_depth=None,min_samples_split=2, random_state=0)
scores3 = cross_val_score(clf3, X, y)
print(scores3.mean())
输出结果打印
0.9823000000000001
0.9997
1.0
5.4 基于pandas和scikit-learn实现Random Forest
iris数据集结构
| sepal length (cm) | sepal width (cm) | petal length (cm) | petal width (cm) | is_train | species | |
|---|---|---|---|---|---|---|
| 0 | 5.1 | 3.5 | 1.4 | 0.2 | True | setosa |
| 1 | 4.9 | 3.0 | 1.4 | 0.2 | True | setosa |
| 2 | 4.7 | 3.2 | 1.3 | 0.2 | True | setosa |
| 3 | 4.6 | 3.1 | 1.5 | 0.2 | True | setosa |
| 4 | 5.0 | 3.6 | 1.4 | 0.2 | True | setosa |
from sklearn.datasets import load_iris
from sklearn.ensemble import RandomForestClassifier
import pandas as pd
import numpy as np

iris = load_iris()
df = pd.DataFrame(iris.data, columns=iris.feature_names)
df['is_train'] = np.random.uniform(0, 1, len(df)) <= .75
df['species'] = pd.Categorical.from_codes(iris.target, iris.target_names)
df.head()

train, test = df[df['is_train']==True], df[df['is_train']==False]

features = df.columns[:4]
clf = RandomForestClassifier(n_jobs=2)
y, _ = pd.factorize(train['species'])
clf.fit(train[features], y)

preds = iris.target_names[clf.predict(test[features])]
pd.crosstab(test['species'], preds, rownames=['actual'], colnames=['preds'])
分类结果打印:
| preds | setosa | versicolor | virginica |
|---|---|---|---|
| actual | |||
| setosa | 14 | 0 | 0 |
| versicolor | 0 | 15 | 1 |
| virginica | 0 | 0 | 9 |
5.5 Random Forest 与其他机器学习分类算法对比
import numpy as np
import matplotlib.pyplot as plt
from matplotlib.colors import ListedColormap
from sklearn.model_selection import train_test_split
from sklearn.preprocessing import StandardScaler
from sklearn.datasets import make_moons, make_circles, make_classification
from sklearn.neighbors import KNeighborsClassifier
from sklearn.svm import SVC
from sklearn.tree import DecisionTreeClassifier
from sklearn.ensemble import RandomForestClassifier, AdaBoostClassifier
from sklearn.naive_bayes import GaussianNB
from sklearn.discriminant_analysis import LinearDiscriminantAnalysis as LDA
from sklearn.discriminant_analysis import QuadraticDiscriminantAnalysis as QDA

h = .02  # step size in the mesh

names = ["Nearest Neighbors", "Linear SVM", "RBF SVM", "Decision Tree",
         "Random Forest", "AdaBoost", "Naive Bayes", "LDA", "QDA"]
classifiers = [
    KNeighborsClassifier(3),
    SVC(kernel="linear", C=0.025),
    SVC(gamma=2, C=1),
    DecisionTreeClassifier(max_depth=5),
    RandomForestClassifier(max_depth=5, n_estimators=10, max_features=1),
    AdaBoostClassifier(),
    GaussianNB(),
    LDA(),
    QDA()]

X, y = make_classification(n_features=2, n_redundant=0, n_informative=2,
                           random_state=1, n_clusters_per_class=1)
rng = np.random.RandomState(2)
X += 2 * rng.uniform(size=X.shape)
linearly_separable = (X, y)

datasets = [make_moons(noise=0.3, random_state=0),
            make_circles(noise=0.2, factor=0.5, random_state=1),
            linearly_separable
            ]

figure = plt.figure(figsize=(27, 9))
i = 1
# iterate over datasets
for ds in datasets:
    # preprocess dataset, split into training and test part
    X, y = ds
    X = StandardScaler().fit_transform(X)
    X_train, X_test, y_train, y_test = train_test_split(X, y, test_size=.4)

    x_min, x_max = X[:, 0].min() - .5, X[:, 0].max() + .5
    y_min, y_max = X[:, 1].min() - .5, X[:, 1].max() + .5
    xx, yy = np.meshgrid(np.arange(x_min, x_max, h),
                         np.arange(y_min, y_max, h))

    # just plot the dataset first
    cm = plt.cm.RdBu
    cm_bright = ListedColormap(['#FF0000', '#0000FF'])
    ax = plt.subplot(len(datasets), len(classifiers) + 1, i)
    # Plot the training points
    ax.scatter(X_train[:, 0], X_train[:, 1], c=y_train, cmap=cm_bright)
    # and testing points
    ax.scatter(X_test[:, 0], X_test[:, 1], c=y_test, cmap=cm_bright, alpha=0.6)
    ax.set_xlim(xx.min(), xx.max())
    ax.set_ylim(yy.min(), yy.max())
    ax.set_xticks(())
    ax.set_yticks(())
    i += 1

    # iterate over classifiers
    for name, clf in zip(names, classifiers):
        ax = plt.subplot(len(datasets), len(classifiers) + 1, i)
        clf.fit(X_train, y_train)
        score = clf.score(X_test, y_test)

        # Plot the decision boundary. For that, we will assign a color to each
        # point in the mesh [x_min, m_max]x[y_min, y_max].
        if hasattr(clf, "decision_function"):
            Z = clf.decision_function(np.c_[xx.ravel(), yy.ravel()])
        else:
            Z = clf.predict_proba(np.c_[xx.ravel(), yy.ravel()])[:, 1]

        # Put the result into a color plot
        Z = Z.reshape(xx.shape)
        ax.contourf(xx, yy, Z, cmap=cm, alpha=.8)

        # Plot also the training points
        ax.scatter(X_train[:, 0], X_train[:, 1], c=y_train, cmap=cm_bright)
        # and testing points
        ax.scatter(X_test[:, 0], X_test[:, 1], c=y_test, cmap=cm_bright,
                   alpha=0.6)

        ax.set_xlim(xx.min(), xx.max())
        ax.set_ylim(yy.min(), yy.max())
        ax.set_xticks(())
        ax.set_yticks(())
        ax.set_title(name)
        ax.text(xx.max() - .3, yy.min() + .3, ('%.2f' % score).lstrip('0'),
                size=15, horizontalalignment='right')
        i += 1

figure.subplots_adjust(left=.02, right=.98)
plt.show()
这里随机生成了三个样本集,分割面近似为月形、圆形和线形的。我们可以重点对比一下决策树和随机森林对样本空间的分割:
1)从准确率上可以看出,随机森林在这三个测试集上都要优于单棵决策树,90%>88%,90%=90%,88%=88%;
2)从特征空间上直观地可以看出,随机森林比决策树拥有更强的分割能力(非线性拟合能力)。
六、 Random Forest 应用方向
随机森林可以在很多地方使用:
- 对离散值的分类
- 对连续值的回归
- 无监督学习聚类
- 异常点检测
参考文章
[1] 什么是随机森林?[新手指南+示例] (careerfoundry.com)
[2] 一文看懂随机森林 - Random Forest(4个实现步骤+10个优缺点) (easyai.tech)
[Machine Learning & Algorithm] 随机森林(Random Forest) - Poll的笔记 - 博客园 (cnblogs.com)
[3] 随机森林_百度百科 (baidu.com)
[4] (3条消息) python实现随机森林_aoanng的博客-CSDN博客_python 随机森林
[5] 随机森林 (Random Forests) 简单介绍与应用_Smileyan's blog-CSDN博客_随机森林应用
(3条消息) 随机森林random forest及python实现_rosefun96的博客-CSDN博客_随机森林python实现


