R语言报错记录The following objects are masked from ‘package:stats’:decompose, spectrum
报错记录
大家好,这里是想做生信大恐龙的生信小白,这是一条简短的报错记录,参考了其他博主的方法,如有侵权,请联系删除。
报错记录
- 报错记录
- 报错原因
- 解决方法
- 总结
报错原因
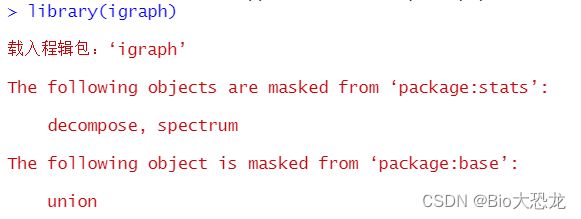
使用R语言第三方包 igraph 时出现了以下报错:
The following objects are masked from ‘package:stats’:
decompose, spectrum
The following object is masked from ‘package:base’:
union(如下图)

大概的意思是 stats包、base包被屏蔽(masked)。查阅了一些资料了解到,R语言调用函数时,若有两个同名函数, 在查找到第一个的时候查找停止并进行调用。于是出现了上述报错。
我看可以使用search()命令查看已经下载的第三方包。
search() #查看下载的第三方包

可以看到 igraph 在第二个位置,stats、base在 igraph 之后,所以出现了上诉报错。
使用decompose可以看到冲突的地方,例如运行decompose后可见
function (graph, mode = c("weak", "strong"), max.comps = NA,
    min.vertices = 0)
{
    if (!is_igraph(graph)) {
        stop("Not a graph object")
    }
    mode <- igraph.match.arg(mode)
    mode <- switch(mode, weak = 1, strong = 2)
    if (is.na(max.comps)) {
        max.comps = -1
    }
    on.exit(.Call(C_R_igraph_finalizer))
    .Call(C_R_igraph_decompose, graph, as.numeric(mode), as.numeric(max.comps),
        as.numeric(min.vertices))
}
<bytecode: 0x000001f52ddc61d0>
<environment: namespace:igraph>
如果我们想要使用被屏蔽的函数可以使用第三方包+函数名的运行,具体方法见下列代码:
> stats::decompose
function (x, type = c("additive", "multiplicative"),
    filter = NULL)
{
    type <- match.arg(type)
    l <- length(x)
    f <- frequency(x)
    if (f <= 1 || length(na.omit(x)) < 2 * f)
        stop("time series has no or less than 2 periods")
    if (is.null(filter))
        filter <- if (!f%%2)
            c(0.5, rep_len(1, f - 1), 0.5)/f
        else rep_len(1, f)/f
    trend <- filter(x, filter)
    season <- if (type == "additive")
        x - trend
    else x/trend
    periods <- l%/%f
    index <- seq.int(1L, l, by = f) - 1L
    figure <- numeric(f)
    for (i in 1L:f) figure[i] <- mean(season[index + i], na.rm = TRUE)
    figure <- if (type == "additive")
        figure - mean(figure)
    else figure/mean(figure)
    seasonal <- ts(rep(figure, periods + 1)[seq_len(l)], start = start(x),
        frequency = f)
    structure(list(x = x, seasonal = seasonal, trend = trend,
        random = if (type == "additive") x - seasonal -
            trend else x/seasonal/trend, figure = figure, type = type),
        class = "decomposed.ts")
}
<bytecode: 0x000001f52dde10e8>
<environment: namespace:stats>
解决方法
可以通过library()的参数warn.conflicts,去除警告, 如下:
library(igraph,warn.conflicts = F)
于是便可去除这一片片红色。
总结
好啦,小伙伴们看到这如果还没有解决问题可以留言交流哦!看到这里还不点赞的小伙伴可太过分啦,求赞求关注啦!