【机器学习】线性回归代码实现
目录
一、线性回归简介
二、梯度下降算法
三、梯度下降代码实现
四、梯度下降算法求解线性回归
五、线性回归代码实现
一、线性回归简介
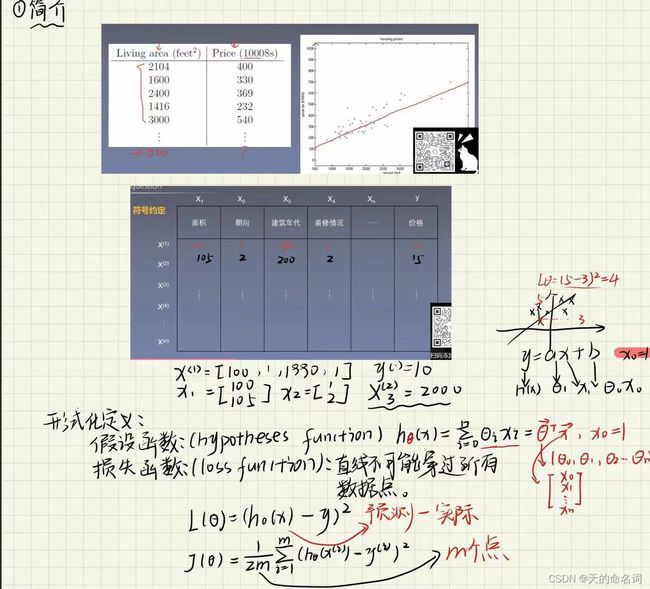
线性回归来自于统计学的一个方法。什么是回归呢?我认为回归就是预测一系列的连续的值,而与之相对的分类就是预测一系列的离散的值。比如预测用户的性别、是否患病、西瓜的大小等等都是用分类算法来进行预测。而员工的月收入,患肺癌的概率等问题,则需要用回归方法去预测。
比如二元一次方程,y为因变量,x为自变量,得到方程:y = ax+b
当给定参数b和a的时候,在坐标图里是一条直线,这也是线性的含义。用一个x来预测y就是一元线性回归,找一个直线取拟合数据,线性回归就是要我们去寻找一条直线,并且让这条直线去尽可能地去拟合图中的数据点。
但是数据点并不是所有都可以拟合的都会有误差,那我们也相应的可以得出损失函数。
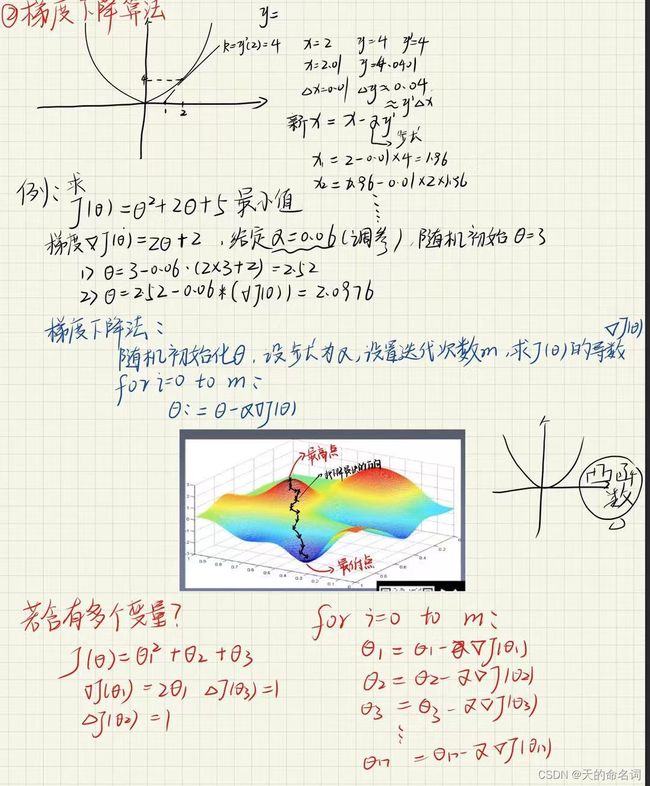
二、梯度下降算法
三、梯度下降代码实现
import numpy as np
import matplotlib.pyplot as plt

# 求y=x^2+2x+5的最小值

# 画函数图像
x = np.linspace(-6, 4, 100)
y = x**2+2*x+5
plt.plot(x,y)
#初始化x,α和迭代次数
x = 3
alaph = 0.8
iteraterNum = 10
# y的导数为2x+2,迭代求theta
for i in range(iteraterNum):
    x = x - alaph*(x*2+2)
#输出x的值
print(x)
四、梯度下降算法求解线性回归
五、线性回归代码实现
import numpy as np
import matplotlib.pyplot as plt
定义一个加载数据的函数
def loaddata():
    data = np.loadtxt('data1.txt',delimiter=',')
    n = data.shape[1]-1 # 特征数,减去实际值
    X = data[:,0:n] # 所有行 从0开始到n
    y = data[:,-1].reshape(-1,1) # s所有行取最后一列
    return X,y
特征归一化
def featureNormalize(X):
    # X的数据减去均值,除以对应的方差,得出新的X
    mu = np.average(X,axis=0) # 只对纵向求
    sigma = np.std(X,axis=0,ddof =1) # 方差 ddof=1, 除以n-1 无偏
    X = (X-mu)/sigma
    return X,mu,sigma
计算损失函数
def computeCost(X,y,theta):
    m = X.shape[0]
    return np.sum(np.power(np.dot(X,theta)-y,2))/(2*m)
梯度下降法求解
def gradientDescent(X,y,theta,iterations,alpha):
    c = np.ones(X.shape[0]).transpose() # x有多少行数据,转置
    X = np.insert(X,0,values=c,axis=1) #对X第0个位置插入全为1的值
    m = X.shape[0] #数据量
    n = X.shape[1] #特征数
    costs=np.zeros(interations)

    for num in range(iterations):
        for j in range(n):
            theta[j] = theta[j]+(alpha/m)*np.sum((y-np.dot(X,theta))*X[:,j].reshape(-1,1))
        costs[num] = computeCost(X,y,theta)
    return theta,costs
预测函数
def predict(X):
    X = (X-mu)/sigma
    c = np.ones(X.shape[0]).transpose() # x有多少行数据,转置
    X = np.insert(X,0,values=c,axis=1) #对X第0个位置插入全为1的列
    return np.dot(X,theta)
X,y = loaddata()
X,mu,sigma = featureNormalize(X)# 归一化操作
theta = np.zeros(X.shape[1]+1).reshape(-1,1)
interations = 400
alpha =0.01
# theta = gradientDescent(X,y,theta,interations,alpha)
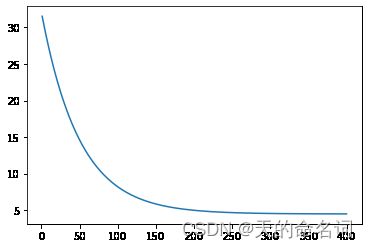
theta,costs = gradientDescent(X,y,theta,interations,alpha)画损失函数图
x_axis = np.linspace(1,interations,interations)
plt.plot(x_axis,costs[0:interations])
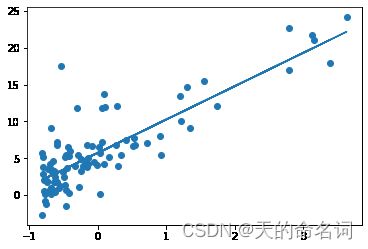
画原始数据散点图和求得的直线
plt.scatter(X,y)
h_theta = theta[0]+theta[1]*X
plt.plot(X,h_theta)
预测数据
print(predict([[8.4]]))


