Python可视化初级(四)——完善统计图形
4.1 误差棒图
很多科学实验,包括数据分析里面,都存在这一定范围的误差,这是无法控制的客观因素,在数据可视化中,最好可以给实验结果增加观察结果的误差以表示客观存在的测量偏差,误差棒图就是运用在这一场景中的很理想的统计图形
plt.errorbar(x,y,yerr,fmt,ecolor,elinewidth,ms,mfc,mec,capthick,capsize)- x,y: 数据点位置
- yerr: 单一数值的非对称形式的误差
- fmt: 数据点的标记样式和数据点标记的连接线样式
- ecolor: 误差棒图的线条颜色
- elinewidth: 误差棒的线条粗细
- ms: 数据点的大小
- mfc: 数据点的标记填充颜色
- mec: 数据点的标记边缘颜色
- capthick:误差棒边界横杠高度
- capsize: 误差棒边界横杠的长度
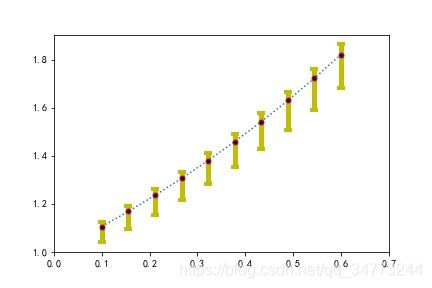
eg1:散点图的误差棒图
x = np.linspace(0.1,0.6,10)
y = np.exp(x)
error = 0.05 + 0.15*x
lower_error = error
upper_error = 0.3*error
error_limit = [lower_error,upper_error]
plt.errorbar(x,y,yerr=error_limit,fmt=':o',
             ecolor='y',elinewidth=5,
             ms=5,mfc='darkblue',mec='red',
             capthick=4,capsize=4)
plt.xlim(0,0.7)
#plt.savefig('误差棒.pdf')
plt.show()
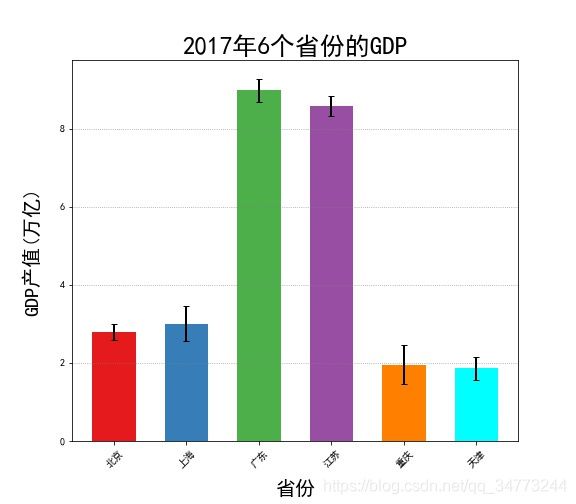
eg2:柱状图的误差棒图
GDP = pd.read_excel('Province GDP 2017.xlsx')
std_err = [0.2,0.45,0.3,0.26,0.5,0.3]
error_attri = dict(elinewidth=2,ecolor='black',capsize=3)
colors= ['#e41a1c','#377eb8','#4daf4a','#984ea3','#ff7f00','#00FFFF']
fig =plt.figure(figsize=(8,7)) # 创建画布
plt.bar(x =GDP.index.values,height =GDP.GDP,width=0.6,align='center',
        yerr=std_err,error_kw=error_attri,
        color= colors,tick_label=GDP.Province)
plt.xticks(rotation=45)
plt.xlabel('省份',fontsize = 20,labelpad =10)
plt.ylabel('GDP产值(万亿)',fontsize = 20,labelpad =20)
plt.grid(True,axis='y',ls=':',color='gray',alpha=0.8)
plt.title('2017年6个省份的GDP',fontsize = 25)
plt.show()
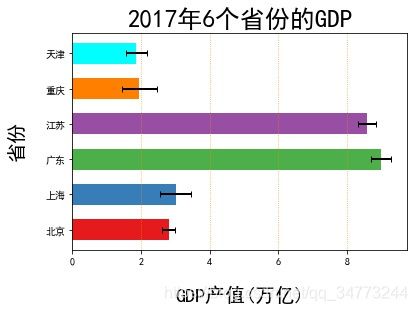
eg3:条形图的误差棒图
bar_width =0.6
colors= ['#e41a1c','#377eb8','#4daf4a','#984ea3','#ff7f00','#00FFFF']
std_err = [0.2,0.45,0.3,0.26,0.5,0.3]
error_attri = dict(elinewidth=2,ecolor='black',capsize=3)
plt.barh(y =GDP.index.values,width = GDP.GDP,height=bar_width,align='center',color = colors,tick_label=GDP.Province,
         xerr=std_err,error_kw=error_attri)
plt.xlabel('GDP产值(万亿)',fontsize = 20,labelpad =20)
plt.ylabel('省份',fontsize = 20,labelpad =20)
plt.grid(True,axis='x',ls=':',color='darkorange',alpha=0.8)
plt.title('2017年6个省份的GDP',fontsize = 25)
plt.show()
4.2 图例与画布使用
1 图例
legend(loc,bbox_to_anchor,ncol,title,shadow,fancybox)- loc: 可以使用数字
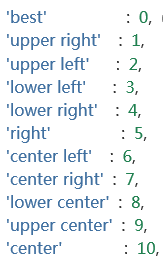
- bbox_to_anchor: 该参数是一个4元元组,第一个元素代表距离画布左侧的y轴长度的倍数的距离,第二个元素代表距离画布底部X轴长度的倍数,第三个元素和第四个代表框的长度和和宽度
- frameon: 是否要边框
- ncol: 图例的排列个数
- title: 标题
- shadow: shadow线框是否添加阴影
- fancybox: 线框是圆角还是直角
2 画布
该参数是一个4元素列表,第一个元素代表距离最左边的距离,第二个元素代表距离最下面的距离,可以理解为画布,左下角的起点坐标第三个元素和第四个代表画布的长度和和宽度
fig= plt.figure()# 创建画布
ax =fig.add_axes([a,b,c,d])
3 标题
plt.title(string,family,fontsize,color,style,loc)- string: 标题内容
- family: 字体类别
- fontsize: 字体大小
- color: 颜色
- style: 风格
- loc: 位置(一般不用)
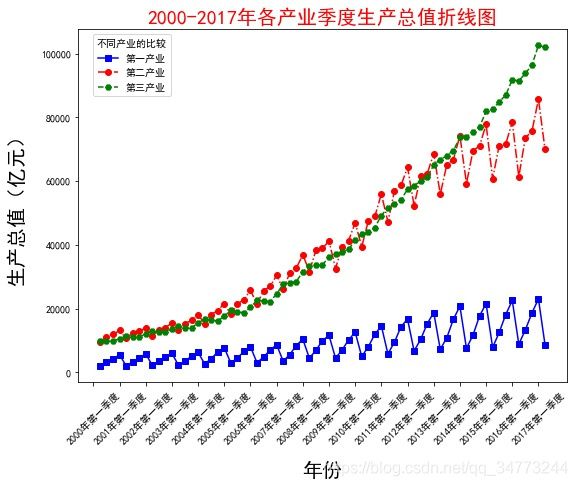
eg
data = np.load('国民经济核算季度数据.npz')
name = data['columns'] ## 提取其中的columns数组,视为数据的标签
values = data['values']## 提取其中的values数组,数据的存在位置
fig =plt.figure(figsize=(8,7)) # 创建画布
ax = fig.add_axes([0.10,0.2,0.85,0.7]) # Axes是画布上的绘图区域,可以添加多块
plt.plot(values[:,0],values[:,3],'bs-',label='第一产业')
plt.plot(values[:,0],values[:,4],'ro-.',label='第二产业')
plt.plot(values[:,0],values[:,5],'gH--',label='第三产业')## 绘制折线图
plt.xlabel('年份',labelpad=15,fontsize=20)## 添加横轴标签
plt.ylabel('生产总值(亿元)',labelpad=15,fontsize=20,style='oblique')## 添加y轴名称
plt.xticks(range(0,70,4),values[range(0,70,4),1],rotation=45)
plt.title('2000-2017年各产业季度生产总值折线图',fontsize=20,color='red')## 添加图表标题
plt.legend(loc='upper right',bbox_to_anchor=(0.2,1),ncol=1, frameon=True, #是否要边框
           title ='不同产业的比较',shadow=False, fancybox=True)
# plt.savefig('2000-2017年季度各产业生产总值折线图.pdf')
plt.show()
4.3 调整刻度轴
在数据分析中,很多时候,需要根据具体的情况,采用适合的刻度标签格式,不仅仅可以将数据本身的特点很好的展示出来,也可以让可视化效果变得更加理想
eg1:时间序列样式的刻度标签
wechat = pd.read_excel('wechat.xlsx')
# 绘制单条折线图
plt.plot(wechat.Date, # x轴数据
         wechat.Counts, # y轴数据
         linestyle = '-', # 折线类型
         linewidth = 2, # 折线宽度
         color = 'steelblue', # 折线颜色
         marker = 'o', # 折线图中添加圆点
         markersize = 6, # 点的大小
         markeredgecolor='black', # 点的边框色
         markerfacecolor='brown') # 点的填充色
# 添加y轴标签
plt.ylabel('人数')
# 添加图形标题
plt.title('每天微信文章阅读人数趋势')
# 显示图形
plt.show()

# 绘制阅读人数折线图
plt.plot(wechat.Date, # x轴数据
         wechat.Counts, # y轴数据
         linestyle = '-', # 折线类型,实心线
         color = 'steelblue', # 折线颜色
         label = '阅读人数')
# 绘制阅读人次折线图
plt.plot(wechat.Date, # x轴数据
         wechat.Times, # y轴数据
         linestyle = '--', # 折线类型,虚线
         color = 'indianred', # 折线颜色
         label = '阅读人次')
import matplotlib as mpl
# 获取图的坐标信息
ax = plt.gca()
# 设置日期的显示格式
date_format = mpl.dates.DateFormatter("%Y-%m-%d")
ax.xaxis.set_major_formatter(date_format)
# 设置x轴显示多少个日期刻度
#xlocator = mpl.ticker.LinearLocator(10)
# 设置x轴每个刻度的间隔天数
xlocator = mpl.ticker.MultipleLocator(5)
ax.xaxis.set_major_locator(xlocator)
# 为了避免x轴刻度标签的紧凑,将刻度标签旋转45度
plt.xticks(rotation=45)
# 添加y轴标签
plt.ylabel('人数')
# 添加图形标题
plt.title('每天微信文章阅读人数与人次趋势')
# 添加图例
plt.legend()
# 显示图形
plt.show()- 注意,在设置日期显示的时候要保证你的数据是日期格式,否则需要使用pd.to_datatime()做转换
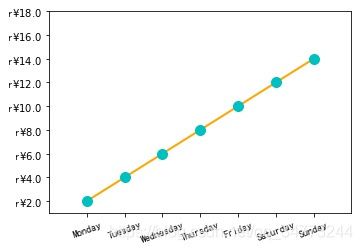
eg2:货币和时间序列样式的刻度标签
from calendar import month_name, day_name
from matplotlib.ticker import FormatStrFormatter
fig = plt.figure()
ax = fig.add_axes([0.2,0.2,0.7,0.7])
x = np.arange(1,8,1)
y = 2*x
ax.plot(x,y,ls='-',lw=2,color='orange',marker='o',ms=10,mfc='c',mec='c')
ax.yaxis.set_major_formatter(FormatStrFormatter('r$\yen%1.1f$'))
plt.xticks(x,day_name[0:7],rotation=20)
ax.set_xlim(0,8)
ax.set_ylim(1,18)
plt.show()
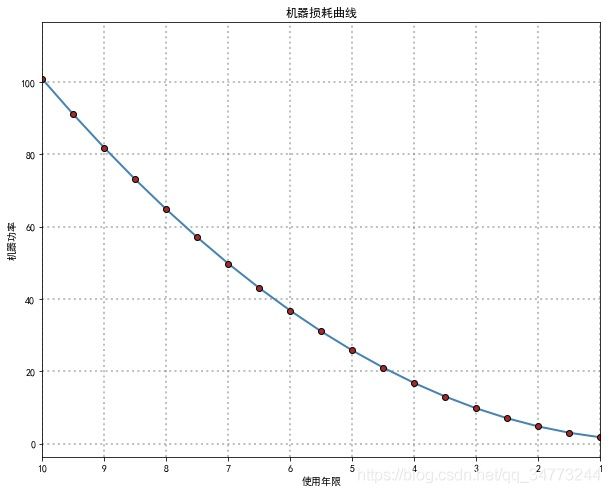
eg3:逆序坐标轴
time = np.arange(1,11,0.5)
machinepower = np.power(time,2) + 0.8
fig = plt.figure(figsize=(10,8))
plt.plot(time,machinepower,
         linestyle = '-', # 折线类型
         linewidth = 2, # 折线宽度
         color = 'steelblue', # 折线颜色
         marker = 'o', # 折线图中添加圆点
         markersize = 6, # 点的大小
         markeredgecolor='black', # 点的边框色
         markerfacecolor='brown') # 点的填充色
plt.xlim(10,1)
plt.xlabel('使用年限')
plt.ylabel('机器功率')
plt.title('机器损耗曲线')
plt.grid(ls=":",lw=2,color='gray',alpha=0.5)
plt.show()
4.4 向统计图添加表格
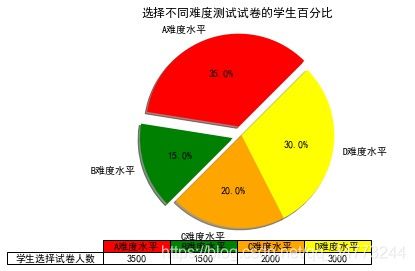
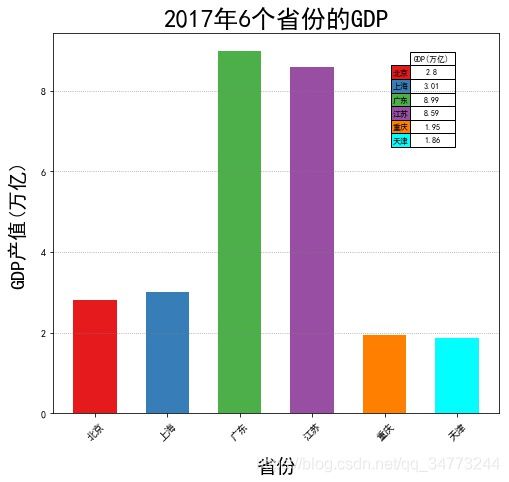
在数据分析中,如果可以将统计图形和数据表格结合起来,将可以更加全面的阐述数据
eg1:
labels =["A难度水平",'B难度水平','C难度水平','D难度水平']
students = [0.35,0.15,0.20,0.30]
colors = ['red','green','orange','yellow']
explode = (0.1,0.1,0,0)
plt.pie(students,explode = explode,labels =labels,autopct='%1.1f%%',startangle=45,shadow=True,
        colors=colors)
# 设置x,y轴刻度一致,这样饼图才能是圆的
plt.axis('equal')
plt.title('选择不同难度测试试卷的学生百分比')
# 添加表格
col_labels = ["A难度水平",'B难度水平','C难度水平','D难度水平']
row_labels = ['学生选择试卷人数']
table_vals = np.array([3500,1500,2000,3000]).reshape(1,-1)
col_colors = ['red','green','orange','yellow']
my_table = plt.table(cellText=table_vals,#表格内容
                     cellLoc='center' ,#单元格位置
                     colWidths=[0.2] * 4,#表格宽度
                     rowLabels=row_labels,#行名
                     colLabels=col_labels,#列名
                     colColours=col_colors, #列单元格颜色
                     rowLoc='center',#行位置
                     loc='bottom'#表格位置)
plt.show()
eg2:
GDP = pd.read_excel('第四课数据/Province GDP 2017.xlsx')
colors= ['#e41a1c','#377eb8','#4daf4a','#984ea3','#ff7f00','#00FFFF']
fig =plt.figure(figsize=(8,7)) # 创建画布
plt.bar(GDP.index.values,GDP.GDP,width=0.6,align='center',color= colors,
        tick_label=GDP.Province)
plt.xticks(rotation=45)
plt.xlabel('省份',fontsize = 20,labelpad =15)
plt.ylabel('GDP产值(万亿)',fontsize = 20,labelpad =15)
plt.grid(True,axis='y',ls=':',color='gray',alpha=0.8)
plt.title('2017年6个省份的GDP',fontsize = 25)
# 添加表格
col_labels = ['GDP(万亿)']
row_labels = GDP.Province
table_vals =np.array(GDP.GDP.values).reshape(-1,1)
col_colors = ['#e41a1c','#377eb8','#4daf4a','#984ea3','#ff7f00','#00FFFF']
my_table = plt.table(cellText=table_vals,cellLoc='center' ,colWidths=[0.1] * 6,
   rowLabels=row_labels, colLabels=col_labels,rowColours=col_colors,bbox=[0.8,0.7,0.1,0.25])
plt.show()