泰坦尼克号 第三章 模型搭建和评估
第三章 模型搭建和评估–建模
经过前面的两章的知识点的学习,我可以对数数据的本身进行处理,比如数据本身的增删查补,还可以做必要的清洗工作。那么下面我们就要开始使用我们前面处理好的数据了。这一章我们要做的就是使用数据,我们做数据分析的目的也就是,运用我们的数据以及结合我的业务来得到某些我们需要知道的结果。那么分析的第一步就是建模,搭建一个预测模型或者其他模型;我们从这个模型的到结果之后,我们要分析我的模型是不是足够的可靠,那我就需要评估这个模型。今天我们学习建模,下一节我们学习评估。
我们拥有的泰坦尼克号的数据集,那么我们这次的目的就是,完成泰坦尼克号存活预测这个任务。
# 导入库
import pandas as pd
import numpy as np
import matplotlib.pyplot as plt
import seaborn as sns # 基于matolotlib的可视化库
from IPython.display import Image # 展示图片
from IPython.display import display_html as dis_h # 使用html展示数据
载入这些库,如果缺少某些库,请安装他们
【思考】这些库的作用是什么呢?你需要查一查
- pandas 为 Python 提供高性能,易于使用的数据结构和数据分析工具
- numpy 支持大量的维度数组与矩阵运算
- matplotlib Python的绘图库,与numpy结合使用
- seaborn 基于Python 且非常受欢迎的图形可视化库,在 matplotlib 的基础上,进行了更高级的封装,使得作图更加方便快捷
载入我们提供清洗之后的数据(clear_data.csv),大家也将原始数据载入(train.csv),说说他们有什么不同
ans:清洗数据中 没有姓名列和存活列 文字数据都转换为了数字(方便快速运算)
# 导入数据
data = pd.read_csv('clear_data.csv') # 清洗后的数据
train = pd.read_csv('train.csv') # 原始数据
data.shape,train.shape
((891, 11), (891, 12))
# 观察清洗后的数据和原始数据
print(dis_h(data.head(3))) # 没有姓名和存活列  文字数据都转换为了数字
print(dis_h(train.head(3)))
| PassengerId | Pclass | Age | SibSp | Parch | Fare | Sex_female | Sex_male | Embarked_C | Embarked_Q | Embarked_S | |
|---|---|---|---|---|---|---|---|---|---|---|---|
| 0 | 0 | 3 | 22.0 | 1 | 0 | 7.2500 | 0 | 1 | 0 | 0 | 1 |
| 1 | 1 | 1 | 38.0 | 1 | 0 | 71.2833 | 1 | 0 | 1 | 0 | 0 |
| 2 | 2 | 3 | 26.0 | 0 | 0 | 7.9250 | 1 | 0 | 0 | 0 | 1 |
None
| PassengerId | Survived | Pclass | Name | Sex | Age | SibSp | Parch | Ticket | Fare | Cabin | Embarked | |
|---|---|---|---|---|---|---|---|---|---|---|---|---|
| 0 | 1 | 0 | 3 | Braund, Mr. Owen Harris | male | 22.0 | 1 | 0 | A/5 21171 | 7.2500 | NaN | S |
| 1 | 2 | 1 | 1 | Cumings, Mrs. John Bradley (Florence Briggs Th... | female | 38.0 | 1 | 0 | PC 17599 | 71.2833 | C85 | C |
| 2 | 3 | 1 | 3 | Heikkinen, Miss. Laina | female | 26.0 | 0 | 0 | STON/O2. 3101282 | 7.9250 | NaN | S |
None
模型搭建
- 处理完前面的数据我们就得到建模数据,下一步是选择合适模型
- 在进行模型选择之前我们需要先知道数据集最终是进行监督学习(需要有标签进行训练)还是无监督学习(不需要标签进行训练)
- 模型的选择一方面是通过我们的任务来决定的。
- 除了根据我们任务来选择模型外,还可以根据数据样本量以及特征的稀疏性来决定
- 刚开始我们总是先尝试使用一个基本的模型来作为其baseline,进而再训练其他模型做对比,最终选择泛化能力或性能比较好的模型
这里我的建模,并不是从零开始,自己一个人完成完成所有代码的编译。我们这里使用一个机器学习最常用的一个库(sklearn)来完成我们的模型的搭建
下面给出sklearn的算法选择路径,供大家参考
# sklearn模型算法选择路径图
Image('sklearn.png')
[外链图片转存失败,源站可能有防盗链机制,建议将图片保存下来直接上传(img-kUzwpzoS-1648140848631)(output_13_0.png)]
【思考】数据集哪些差异会导致模型在拟合数据时发生变化
ans:数据拟合(曲线拟合)根据已知数据,得到与数据拟合的曲线,可以根据曲线的方程对其他未知数进行预测,需要避免曲线过拟合(完全拟合,容错率太低)和欠拟合(容错率太高)造成预测错误
会发生变化的情况:
分情况讨论
- 异常值
- 噪音
- 异常挖掘
Image('fitting.png')
[外链图片转存失败,源站可能有防盗链机制,建议将图片保存下来直接上传(img-VH72KFdV-1648140848631)(output_15_0.png)]
任务一:切割训练集和测试集
这里使用留出法划分数据集
训练集用于训练模型,测试集用于评估模型
- 将数据集分为自变量和因变量(训练标签)
- 按比例切割训练集和测试集(一般测试集的比例有30%、25%、20%、15%和10%) —— 根据数量的大小还设定,数据量大,则测试集可以少一点,数量小,则按比例
- 使用分层抽样
- 设置随机种子以便结果能复现
【思考】
- 划分数据集的方法有哪些?
- 留出法
- 交叉验证法
- 自助法
详细:https://www.cnblogs.com/jyroy/p/13547118.html
- 为什么使用分层抽样,这样的好处有什么?
任务提示1
- 切割数据集是为了后续能评估模型泛化能力
- sklearn中切割数据集的方法为
train_test_split - 查看函数文档可以在jupyter noteboo里面使用
train_test_split?后回车即可看到 - 分层和随机种子在参数里寻找
from sklearn.model_selection import train_test_split
# 一般先取出X和y后再切割,有些情况会使用到未切割的,这时候X和y就可以用,x是清洗好的数据,y是我们要预测的存活数据'Survived'
X = data # 用于训练的数据
y = train['Survived'] # 用于预测的数据
# 导入切割数据集的包
from sklearn.model_selection import train_test_split
train_test_split?
# 要求切割因变量和自变量数据size长度相同
# 浮点数则百分比,整型则数量,默认25%
# 随机种子
# 打乱后划分
# 按某一列分层
# 对数据集进行切割
X_train, X_test, y_train, y_test = train_test_split(X, y, stratify=y, random_state=42)
# 查看数据形状
X_train.shape, X_test.shape
((668, 11), (223, 11))
【思考】
- 什么情况下切割数据集的时候不用进行随机选取
ans:需要复现的时候
任务二:模型创建
- 创建基于线性模型的分类模型(逻辑回归)
- 创建基于树的分类模型(决策树、随机森林)
- 分别使用这些模型进行训练,分别的到训练集和测试集的得分
- 查看模型的参数,并更改参数值,观察模型变化
提示
- 逻辑回归不是回归模型而是分类模型(常用于二分类),不要与
LinearRegression混淆 - 随机森林其实是决策树集成为了降低决策树过拟合的情况
- 线性模型所在的模块为
sklearn.linear_model - 树模型所在的模块为
sklearn.ensemble
# 导入所需库
from sklearn.linear_model import LogisticRegression
from sklearn.ensemble import RandomForestClassifier
# 默认参数逻辑回归模型
lr = LogisticRegression().fit(X_train, y_train)
lr
# fit训练
# predict 预测
# predict_proba 概率估计
# score 返回平均准确度
C:\Tool\Anaconda3\lib\site-packages\sklearn\linear_model\_logistic.py:763: ConvergenceWarning: lbfgs failed to converge (status=1):
STOP: TOTAL NO. of ITERATIONS REACHED LIMIT.

Increase the number of iterations (max_iter) or scale the data as shown in:
    https://scikit-learn.org/stable/modules/preprocessing.html
Please also refer to the documentation for alternative solver options:
    https://scikit-learn.org/stable/modules/linear_model.html#logistic-regression
  n_iter_i = _check_optimize_result(


LogisticRegression()
# 查看训练集和测试集score值
print("训练集得分: {:.2f}".format(lr.score(X_train, y_train)))
print("测试集得分: {:.2f}".format(lr.score(X_test, y_test)))
训练集得分: 0.80
测试集得分: 0.78
# 调整参数后的逻辑回归模型
# 通过添加正则化项可以限制模型的复杂度,使得模型在复杂度和性能达到平衡,约束敏感度。
# 默认L2正则化
# C越小越能约束
lr2 = LogisticRegression(C=1000).fit(X_train, y_train)
C:\Tool\Anaconda3\lib\site-packages\sklearn\linear_model\_logistic.py:763: ConvergenceWarning: lbfgs failed to converge (status=1):
STOP: TOTAL NO. of ITERATIONS REACHED LIMIT.

Increase the number of iterations (max_iter) or scale the data as shown in:
    https://scikit-learn.org/stable/modules/preprocessing.html
Please also refer to the documentation for alternative solver options:
    https://scikit-learn.org/stable/modules/linear_model.html#logistic-regression
  n_iter_i = _check_optimize_result(
解决过拟合和欠拟合的几个办法
- 增减模型的参数维度,可以选择增加或者减少特征数量的选择,来解决过拟合和欠拟合的问题
- 增减多项式的维度,比如加入高阶多项式来更好地拟合曲线,用以解决欠拟合
- 调整正则化,在不改变参数维度和多项式维度的情况下,单纯的调整正则化同意可以有效的改变模型对数据的拟合程度
print("Training set score: {:.2f}".format(lr2.score(X_train, y_train)))
print("Testing set score: {:.2f}".format(lr2.score(X_test, y_test)))
Training set score: 0.80
Testing set score: 0.77
# 随机森林分类模型
# 包含多个决策树分类器
# 数的数量,深度,
rfc = RandomForestClassifier(n_estimators=600).fit(X_train, y_train)
print("Training set score: {:.2f}".format(rfc.score(X_train, y_train)))
print("Testing set score: {:.2f}".format(rfc.score(X_test, y_test)))
Training set score: 1.00
Testing set score: 0.79
# 调整参数后的随机森林分类模型
rfc2 = RandomForestClassifier(n_estimators=100, max_depth=5)
rfc2.fit(X_train, y_train)
print("Training set score: {:.2f}".format(rfc2.score(X_train, y_train)))
print("Testing set score: {:.2f}".format(rfc2.score(X_test, y_test)))
Training set score: 0.87
Testing set score: 0.78
【思考】
- 为什么线性模型可以进行分类任务,背后是怎么的数学关系
- 对于多分类问题,线性模型是怎么进行分类的
ans: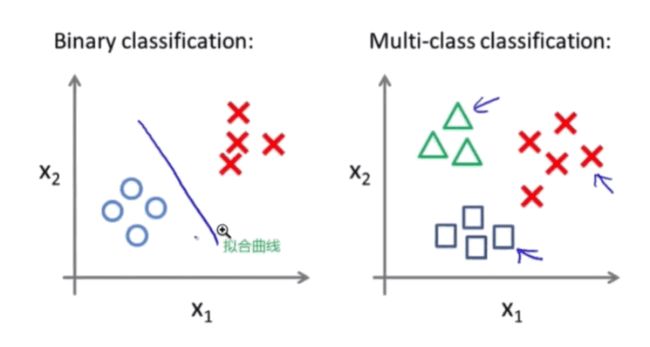
任务三:输出模型预测结果
- 输出模型预测分类标签
- 输出不同分类标签的预测概率
提示3
- 一般监督模型在sklearn里面有个
predict能输出预测标签,predict_proba则可以输出标签概率
# 预测标签
pred = lr.predict(X_train)
# 此时我们可以看到0和1的数组
pred[:10]
array([1, 0, 0, 1, 1, 0, 0, 0, 1, 0], dtype=int64)
# 预测标签概率
pred_proba = lr.predict_proba(X_train)
pred_proba[:10]
array([[0.08552386, 0.91447614],
       [0.78976583, 0.21023417],
       [0.80014197, 0.19985803],
       [0.35361092, 0.64638908],
       [0.23281758, 0.76718242],
       [0.51150187, 0.48849813],
       [0.59644512, 0.40355488],
       [0.90821332, 0.09178668],
       [0.45088222, 0.54911778],
       [0.87122833, 0.12877167]])
【思考】
- 预测标签的概率对我们有什么帮助
ans:帮助我们预测标签emm
第三章 模型搭建和评估-评估
根据之前的模型的建模,我们知道如何运用sklearn这个库来完成建模,以及我们知道了的数据集的划分等等操作。那么一个模型我们怎么知道它好不好用呢?以至于我们能不能放心的使用模型给我的结果呢?那么今天的学习的评估,就会很有帮助。
加载下面的库
import pandas as pd
import numpy as np
import seaborn as sns
import matplotlib.pyplot as plt
from IPython.display import Image
from sklearn.linear_model import LogisticRegression
from sklearn.ensemble import RandomForestClassifier
from sklearn.model_selection import train_test_split
from sklearn.model_selection import cross_val_score # 交叉验证函数
%matplotlib inline
任务:加载数据并分割测试集和训练集
# 一般先取出X和y后再切割,有些情况会使用到未切割的,这时候X和y就可以用,x是清洗好的数据,y是我们要预测的存活数据'Survived'
data = pd.read_csv('clear_data.csv')
train = pd.read_csv('train.csv')
X = data
y = train['Survived']
X_train, X_test, y_train, y_test = train_test_split(
    X, y, stratify=y, random_state=42)
# 为了避免切割时的偶然性,使用交叉验证
模型评估
- 模型评估是为了知道模型的泛化能力。
- 交叉验证(cross-validation)是一种评估泛化性能的统计学方法,它比单次划分训练集和测试集的方法更加稳定、全面。
- 在交叉验证中,数据被多次划分,并且需要训练多个模型。
- 最常用的交叉验证是 k 折交叉验证(k-fold cross-validation),其中 k 是由用户指定的数字,通常取 5 或 10。
- 准确率(precision)度量的是被预测为正例的样本中有多少是真正的正例
- 召回率(recall)度量的是正类样本中有多少被预测为正类
- f-分数是准确率与召回率的调和平均
【思考】:将上面的概念进一步的理解,大家可以做一下总结
任务一:交叉验证
- 用10折交叉验证来评估之前的逻辑回归模型
- 计算交叉验证精度的平均值
# 默认参数逻辑回归模型
lr = LogisticRegression()
# 采用10折交叉
score = cross_val_score(lr,X_train,y_train,cv=10)
score.mean()
C:\Tool\Anaconda3\lib\site-packages\sklearn\linear_model\_logistic.py:763: ConvergenceWarning: lbfgs failed to converge (status=1):
STOP: TOTAL NO. of ITERATIONS REACHED LIMIT.

Increase the number of iterations (max_iter) or scale the data as shown in:
    https://scikit-learn.org/stable/modules/preprocessing.html
Please also refer to the documentation for alternative solver options:
    https://scikit-learn.org/stable/modules/linear_model.html#logistic-regression
  n_iter_i = _check_optimize_result(


0.7964043419267299
思考4
- k折越多的情况下会带来什么样的影响?
ans:https://zhuanlan.zhihu.com/p/31924220
任务二:混淆矩阵
- 计算二分类问题的混淆矩阵
- 计算精确率、召回率以及f-分数
【思考】什么是二分类问题的混淆矩阵,理解这个概念,知道它主要是运算到什么任务中的
#思考回答
#提示:混淆矩阵
Image('Snipaste_2020-01-05_16-38-26.png')
[外链图片转存失败,源站可能有防盗链机制,建议将图片保存下来直接上传(img-aDRizWZr-1648140848632)(output_60_0.png)]
#提示:准确率 (Accuracy),精确度(Precision),Recall,f-分数计算方法
Image('Snipaste_2020-01-05_16-39-27.png')
[外链图片转存失败,源站可能有防盗链机制,建议将图片保存下来直接上传(img-rgyNJwdQ-1648140848632)(output_61_0.png)]
提示5
- 混淆矩阵的方法在sklearn中的
sklearn.metrics模块 - 混淆矩阵需要输入真实标签和预测标签
- 精确率、召回率以及f-分数可使用
classification_report模块
from sklearn.metrics import confusion_matrix
# 训练模型
lr = LogisticRegression(C=100)
lr.fit(X_train, y_train)
C:\Tool\Anaconda3\lib\site-packages\sklearn\linear_model\_logistic.py:763: ConvergenceWarning: lbfgs failed to converge (status=1):
STOP: TOTAL NO. of ITERATIONS REACHED LIMIT.

Increase the number of iterations (max_iter) or scale the data as shown in:
    https://scikit-learn.org/stable/modules/preprocessing.html
Please also refer to the documentation for alternative solver options:
    https://scikit-learn.org/stable/modules/linear_model.html#logistic-regression
  n_iter_i = _check_optimize_result(


LogisticRegression(C=100)
# 模型预测结果
pred = lr.predict(X_train)
# 混淆矩阵
confusion_matrix(y_train, pred,labels=[0,1])
array([[357,  55],
       [ 78, 178]], dtype=int64)
from sklearn.metrics import classification_report
# 精确率、召回率以及f1-score
print(classification_report(y_train, pred))
              precision    recall  f1-score   support

           0       0.82      0.87      0.84       412
           1       0.76      0.70      0.73       256

    accuracy                           0.80       668
   macro avg       0.79      0.78      0.79       668
weighted avg       0.80      0.80      0.80       668
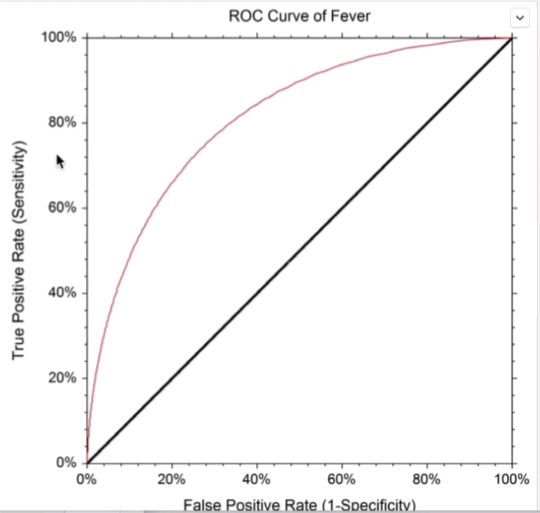
任务三:ROC曲线
- 绘制ROC曲线
【思考】什么是ROC曲线,OCR曲线的存在是为了解决什么问题?
提示6
- ROC曲线在sklearn中的模块为
sklearn.metrics - ROC曲线下面所包围的面积越大越好
from sklearn.metrics import roc_curve
fpr, tpr, thresholds = roc_curve(y_test, lr.decision_function(X_test))
plt.plot(fpr, tpr, label="ROC Curve")
plt.xlabel("FPR")
plt.ylabel("TPR (recall)")
# 找到最接近于0的阈值
close_zero = np.argmin(np.abs(thresholds)) # 找绝对值
plt.plot(fpr[close_zero], tpr[close_zero], 'o', markersize=10, label="threshold zero", fillstyle="none", c='k', mew=2)
[]
[外链图片转存失败,源站可能有防盗链机制,建议将图片保存下来直接上传(img-XQKhEpkR-1648140848633)(output_73_1.png)]
from sklearn.metrics import plot_roc_curve
# 直接画ROC曲线
思考6
- 对于多分类问题如何绘制ROC曲线
【思考】你能从这条OCR曲线的到什么信息?这些信息可以做什么?
可以通过多个模型画出ROC曲线,看所占面积,面积越大,效果越好,从而选择更好的模型