机器学习之SVM
文章目录
- 一、SVM基本介绍
- 二、SVM工作原理
-
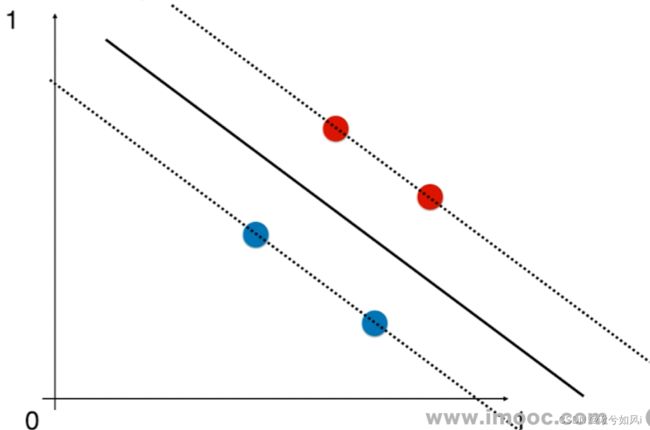
- 1. 线性支持向量机(数据可分)
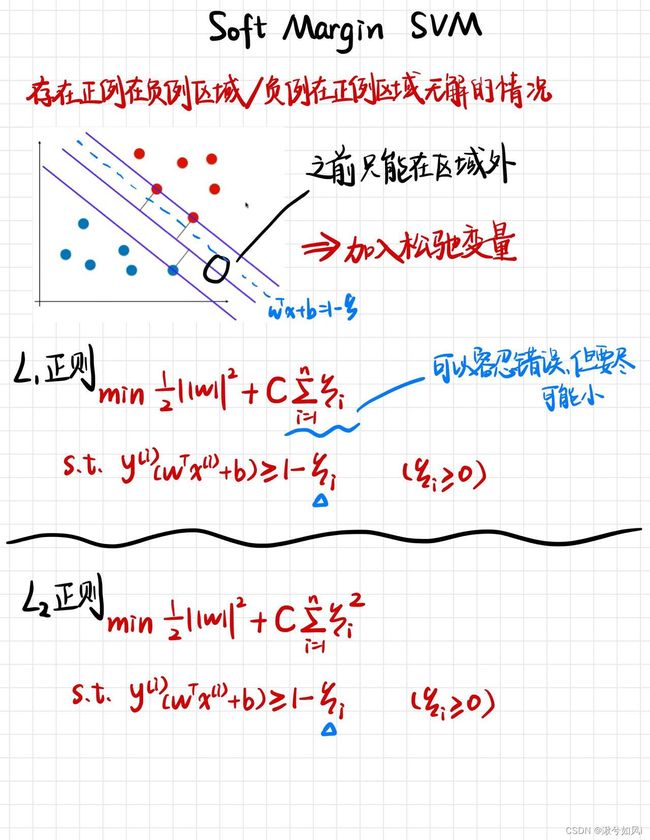
- 2. 软边距支持向量机(数据不可分)
- 三、sklearn实现SVM
-
- 注:SVM涉及距离,需要先数据标准化处理
- 1. 线性SVM
-
- LinearSVC() 构造函数的参数及默认值
- 2. 非线性SVM
-
- (1)线性SVM中使用多项式特征
- (2) 使用多项式核函数的SVM
-
- SVC() 构造函数的参数及默认值
- 3. 使用SVM思想解决回归问题
- 总结
-
- 优缺点
- 问题
一、SVM基本介绍
Support Vector Machine支持向量机
- 用于分类问题,也可以用于回归问题
- 监督学习算法
二、SVM工作原理
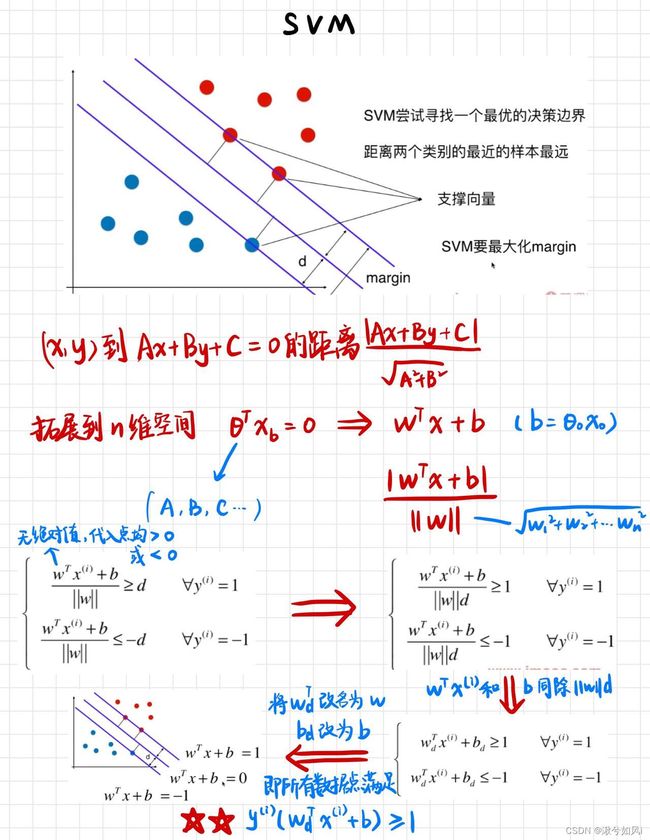
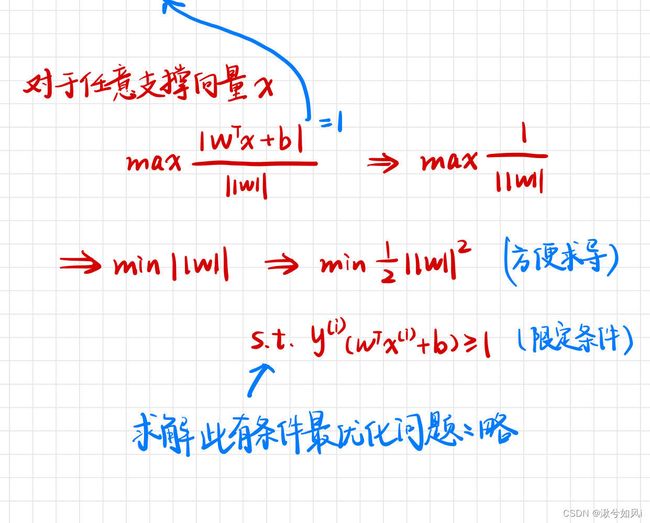
最大化margin,几何间隔越大,分类的把握性越大,即错误率越低
1. 线性支持向量机(数据可分)
注意分类类别划分为了 -1和1,而不是0和1,是为了后续(图1最下行)将两式子化为一个式子。y取-1,数据点代入也小于0,相乘还是大于1。
2. 软边距支持向量机(数据不可分)
三、sklearn实现SVM
注:SVM涉及距离,需要先数据标准化处理
1. 线性SVM
import numpy as np
import matplotlib.pyplot as plt
from sklearn import datasets

iris = datasets.load_iris()

X = iris.data
y = iris.target

X = X[y < 2, :2]  # 只取前两个特征
y = y[y < 2]      # 只取y=0 y=1,二分类问题

from sklearn.preprocessing import StandardScaler

standardScaler = StandardScaler()   # 要先数据归一化
standardScaler.fit(X)
X_standard = standardScaler.transform(X)


from sklearn.svm import LinearSVC

svc = LinearSVC(C=1e9)  # C即正则化参数
svc.fit(X_standard, y)

# 绘制决策边界略
LinearSVC() 构造函数的参数及默认值
LinearSVC(C=1.0, class_weight=None, dual=True, fit_intercept=True,
          intercept_scaling=1, loss='squared_hinge', max_iter=1000,
          multi_class='ovr', penalty='l2', random_state=None, tol=0.0001,
          verbose=0)
penalty:默认为’l2’,默认正则化方式为l2正则化,还有l1正则化。C:默认是1.0,正则化参数
2. 非线性SVM
(1)线性SVM中使用多项式特征

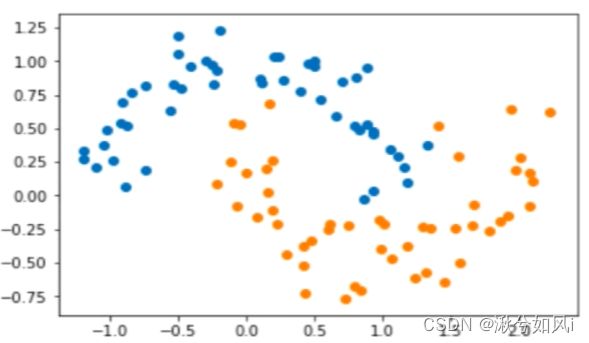
原moons数据集 添加噪音的moons数据集
import numpy as np
import matplotlib.pyplot as plt

from sklearn import datasets

X, y = datasets.make_moons(noise=0.15, random_state=666)  # noise噪音,添加标准差
# X.shape : (100, 2) ---- y.shape : (100,)

from sklearn.preprocessing import PolynomialFeatures, StandardScaler
from sklearn.svm import LinearSVC
from sklearn.pipeline import Pipeline


# 使用Pipeline方便以下操作顺序执行
def PolynomialSVC(degree, C=1.0):
    return Pipeline([
        ("poly", PolynomialFeatures(degree=degree)),    # 第一步传入degree
        ("std_scaler", StandardScaler()),               # 第二步数据归一化
        ("linearSVC", LinearSVC(C=C))                   # 第三步调用svm算法,C是正则化参数
    ])


poly_svc = PolynomialSVC(degree=3)
poly_svc.fit(X, y)  # 训练


# 绘制决策边界
def plot_decision_boundary(model, axis):
    x0, x1 = np.meshgrid(
        np.linspace(axis[0], axis[1], int((axis[1] - axis[0]) * 100)).reshape(-1, 1),
        np.linspace(axis[2], axis[3], int((axis[3] - axis[2]) * 100)).reshape(-1, 1),
    )
    X_new = np.c_[x0.ravel(), x1.ravel()]

    y_predict = model.predict(X_new)
    zz = y_predict.reshape(x0.shape)

    from matplotlib.colors import ListedColormap
    custom_cmap = ListedColormap(['#EF9A9A', '#FFF59D', '#90CAF9'])

    plt.contourf(x0, x1, zz, linewidth=5, cmap=custom_cmap)

plot_decision_boundary(poly_svc, axis=[-1.5, 2.5, -1.0, 1.5])
plt.scatter(X[y == 0, 0], X[y == 0, 1])
plt.scatter(X[y == 1, 0], X[y == 1, 1])
plt.show()
(2) 使用多项式核函数的SVM
# 数据集的准备等同上 略
from sklearn.svm import SVC

def PolynomialKernelSVC(degree, C=1.0):
    return Pipeline([
        ("std_scaler", StandardScaler()),
        ("kernelSVC", SVC(kernel="poly", degree=degree, C=C))    # 自动对传进来的数据进行多项式化,再进行SVM
    ])


poly_kernel_svc = PolynomialKernelSVC(degree=3)
poly_kernel_svc.fit(X, y)

plot_decision_boundary(poly_kernel_svc, axis=[-1.5, 2.5, -1.0, 1.5])
plt.scatter(X[y == 0, 0], X[y == 0, 1])
plt.scatter(X[y == 1, 0], X[y == 1, 1])
plt.show()
SVC() 构造函数的参数及默认值
SVC(C=1.0, cache_size=200, class_weight=None, coef0=0.0, decision_function_shape=None,
	degree=3, gamma='auto', kernel='poly', max_iter=-1, probability=False,
	random_state=None, 	shrinking=True, tol=0.001, verbose=False)
kernel:核函数类型,默认为’rbf’,取’poly’时为多项式核函数C:默认是1.0,正则化参数degree:多项式核函数的阶数,默认为3。coef0:核函数中的独立项,多项式核函数中的c
3. 使用SVM思想解决回归问题

不同点:margin范围里包含的点越多越好,说明这个范围更能比较好的表达样本数据点,取中间直线作为回归结果,预测未知点的y值, ε超参数用于指定margin
from sklearn import datasets

boston = datasets.load_boston()
X = boston.data
y = boston.target

from sklearn.model_selection import train_test_split  # 划分数据集

X_train, X_test, y_train, y_test = train_test_split(X, y, random_state=666)

from sklearn.svm import LinearSVR
from sklearn.svm import SVR
from sklearn.preprocessing import StandardScaler
from sklearn.pipeline import Pipeline

def StandardLinearSVR(epsilon=0.1):
    return Pipeline([
        ('std_scaler', StandardScaler()),     # 数据标准化
        ('linearSVR', LinearSVR(epsilon=epsilon))  # 也可用SVR()传入不同的核函数来处理数据
    ])

svr = StandardLinearSVR()
svr.fit(X_train, y_train)

print(svr.score(X_test, y_test))
对于线性SVM,用LinearSVR(或者LinearSVC),而不使用SVR(或者SVC) kernel=‘linear’。一般情况二者的结果没有差异。且LinearSVR(LinearSVC)效率会更高一些
总结
优缺点
1. 优点
- 可用于线性/非线性分类(引入核函数),也可以用于回归。泛化错误率低,也就是说具有良好的学习能力,且学到的结果具有很好的推广性。
- 可以解决小样本情况下的机器学习问题,可以解决高维问题,可以避免神经网络结构选择和局部极小点问题。
- SVM是最好的现成的分类器,现成是指不加修改可直接使用。并且能够得到较低的错误率,SVM可以对训练集之外的数据点做很好的分类决策。
2. 缺点
- 对参数调节和和函数的选择敏感,对缺失数据敏感
- 在样本量非常大时,核函数中內积的计算,求解拉格朗日乘子α 值的计算都是和样本个数有关的,会导致在求解模型时的计算量过大
- 用SVM解决多分类问题存在困难(需要通过多个二类支持向量机的组合来解决)
问题
- 待完善
