疫情传播大数据分析
疫情传播大数据分析
下面以疫情数据分析为应用场景,从数据抓取、数据分析、数据处理到数据可视化的全过程,配合实际操作过程,达到从实际出发,结合理论,动手实操的目的。

环境准备
pip install pyecharts==1.7.1 https://pypi.tuna.tsinghua.edu.cn/simple

conda install requests

conda install html5lib
Github:https://github.com/pyecharts/pyecharts # pyecharts
步骤1:疫情数据抓取
导入相关模块
import time
import json
import requests
from datetime import datetime
import pandas as pd
import numpy as np

#在顶部声明 Notebook 类型,必须在引入 pyecharts.charts 等模块前声明
# from pyecharts.globals import CurrentConfig, NotebookType
# CurrentConfig.NOTEBOOK_TYPE = NotebookType.JUPYTER_NOTEBOOK

from pyecharts.charts import Map
import pyecharts.options as opts
抓取疫情数据
# 定义抓取数据函数
def catch_data():
    url = 'https://view.inews.qq.com/g2/getOnsInfo?name=disease_h5'
    reponse = requests.get(url=url).json()
    # 返回数据字典
    data = json.loads(reponse['data'])
    return data
def catch_other_data():
    url = 'https://view.inews.qq.com/g2/getOnsInfo?name=disease_foreign'
    reponse = requests.get(url=url).json()
    # 返回数据字典
    data = json.loads(reponse['data'])
    return data

# 抓取数据并将数据存入data中
data = catch_data()
other_data = catch_other_data()

# 查看数据的关键词(以列表返回一个字典所有的键)
print(data.keys())
print(other_data.keys())
步骤2:疫情数据初步分析
提取各地区数据明细
# 提取各地区数据明细
areaTree = data['areaTree']
# 查看并分析具体数据
# areaTree
提取国外地区数据明细
# 提取国外地区数据明细
foreignList = other_data['foreignList']
# 查看并分析具体数据
# foreignList
步骤3:疫情数据处理
国内各省疫情数据提取
# 国内数据提取
china_data = areaTree[0]['children']  # 提取国内各省数据
china_list = []  # 创建新列表用于储存数据

# 计算china_data中的数据数量(省的数量),逐步提取对应省的数据
for a in range(len(china_data)):
    # 提取数据
    province = china_data[a]['name']  # 提取对应省名称
    confirm = china_data[a]['total']['confirm'] # 提取对应省的累计确诊数据
    heal = china_data[a]['total']['heal'] # 提取对应省的累计治愈数据
    dead = china_data[a]['total']['dead'] # 提取对应省的累计死亡数据
    nowConfirm = confirm - heal - dead # 计算对应省的现有确诊数量
    # 存放数据
    china_dict = {} # 创建新字典用于储存数据
    china_dict['province'] = province # 创建province键存放各省名称
    china_dict['nowConfirm'] = nowConfirm # 创建nowconfirm键存放各省现有确诊数量
    china_list.append(china_dict) # 在china_list列表末尾添加china_dict字典

china_data = pd.DataFrame(china_list) # 将列表转换成panda表格型数据结构
china_data.head() # 读取前五行数据
国际疫情数据提取
# 国际数据提取
world_data = foreignList # 提取各国数据
world_list = [] # 创建新列表用于储存数据

# 计算world_data中的数据数量(国家的数量),逐步提取对应国家的数据
for a in range(len(world_data)):
    # 提取数据
    country = world_data[a]['name']  # 提取对应国家的名称
    nowConfirm = world_data[a]['nowConfirm'] # 提取对应国家的现有确诊数据
    confirm = world_data[a]['confirm'] # 提取对应国家的累计确诊数据
    dead = world_data[a]['dead'] # 提取对应国家的累计确诊数据
    heal = world_data[a]['heal'] # 提取对应国家的累计确诊数据
    # 存放数据
    world_dict = {}
    world_dict['country'] = country
    world_dict['nowConfirm'] = nowConfirm
    world_dict['confirm'] = confirm
    world_dict['dead'] = dead
    world_dict['heal'] = heal
    world_list.append(world_dict)

world_data = pd.DataFrame(world_list)
world_data.head()
查询数据中是否含有中国疫情数据
world_data.loc[world_data['country']=="中国"]
从新增areaTree中提取中国数据,并添加至world_data
confirm = areaTree[0]['total']['confirm'] # 提取中国累计确诊数据
heal = areaTree[0]['total']['heal'] # 提取中国累计治愈数据
dead = areaTree[0]['total']['dead'] # 提取中国累计死亡数据
nowConfirm = confirm - heal - dead # 计算中国现有确诊数量

world_data = world_data.append({'country': "中国", 'nowConfirm': nowConfirm, 'confirm': confirm, 'heal': heal, 'dead': dead},
                               ignore_index=True)
再次查询数据中是否含有中国疫情数据
world_data.loc[world_data['country']=="中国"]
步骤4:国内疫情态势可视化
导入pyecharts相关库
# 在顶部声明 Notebook 类型,必须在引入 pyecharts.charts 等模块前声明
# from pyecharts.globals import CurrentConfig, NotebookType
# CurrentConfig.NOTEBOOK_TYPE = NotebookType.JUPYTER_NOTEBOOK

from pyecharts.charts import Map
import pyecharts.options as opts
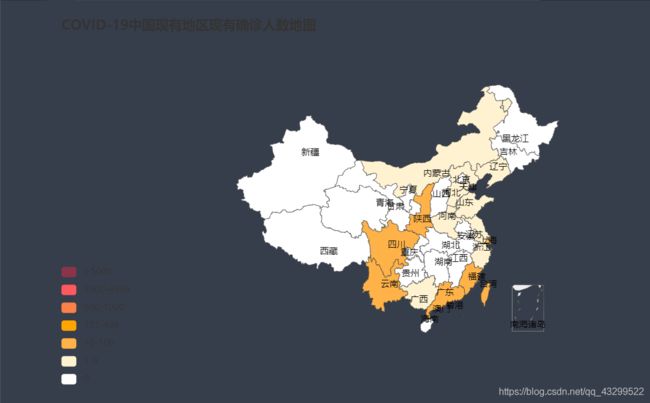
构建COVID-19中国各地区现有确诊人数地图
# 创建图表
m = Map()
# 导入图表数据
m.add("", [list(z) for z in zip(list(china_data["province"]), list(china_data["nowConfirm"]))],
      maptype="china", is_map_symbol_show=False)
# 设置图表参数
m.set_global_opts(title_opts=opts.TitleOpts(title="COVID-19中国现有地区现有确诊人数地图"),
                     visualmap_opts=opts.VisualMapOpts(is_piecewise=True,
                     pieces = [
                        {"min": 5000 , "label": '>5000',"color": "#893448"}, #不指定 max,表示 max 为无限大
                        {"min": 1000, "max": 4999, "label": '1000-4999',"color" : "#ff585e" },
                        {"min": 500, "max": 999, "label": '500-1000',"color": "#fb8146"},
                        {"min": 101, "max": 499, "label": '101-499',"color": "#ffA500"},
                        {"min": 10, "max": 100, "label": '10-100',"color": "#ffb248"},
                        {"min": 1, "max": 9, "label": '1-9',"color" : "#fff2d1" },
                        {"max": 1, "label": '0',"color" : "#ffffff" }]))
# 加载JavaScript
# 在第一次渲染的时候调用 load_javascript() 会预先加载基本 JavaScript 文件到 Notebook 中。
# 如若后面其他图形渲染不出来,则请开发者尝试再次调用,因为 load_javascript 只会预先加载最基本的 js 引用。
# 而主题、地图等 js 文件需要再次按需加载。
# m.load_javascript()
# 显示图表
# load_javascript() 和 render_notebook() 方法需要在不同的 cell 中调用,
# 这是 Notebook 的内联机制,其实本质上我们是返回了带有 _html_, _javascript_ 对象的 class。notebook 会自动去调用这些方法。
m.render_notebook()
步骤5:国际疫情态势可视化
将各国的中文名称转换成英文名称
# 导入国家中英文对照表
world_name = pd.read_excel("国家中英文对照表.xlsx")

# 比对world_data的"country"列与world_name的"中文"列内容相同的位置,在相应位置插入对应国家的英文名
world_data_t = pd.merge(world_data, world_name, left_on="country",right_on="中文", how="inner")

world_data_t
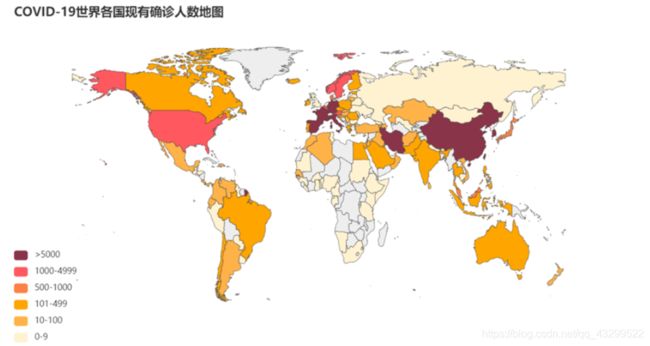
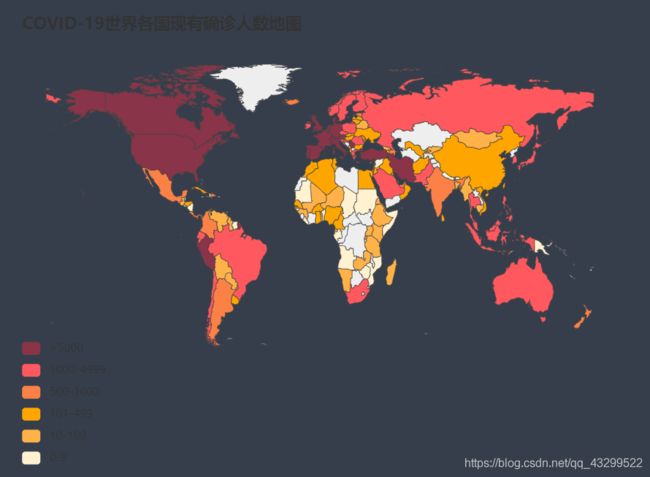
构建COVID-19世界各国现有确诊人数地图
m2 = Map()
m2.add("", [list(z) for z in zip(list(world_data_t["英文"]), list(world_data_t["nowConfirm"]))],
        maptype="world", is_map_symbol_show=False)
m2.set_global_opts(title_opts=opts.TitleOpts(title="COVID-19世界各国现有确诊人数地图"),
                     visualmap_opts=opts.VisualMapOpts(is_piecewise=True,
                pieces = [
                        {"min": 5000 , "label": '>5000',"color": "#893448"},
                        {"min": 1000, "max": 4999, "label": '1000-4999',"color" : "#ff585e" },
                        {"min": 500, "max": 999, "label": '500-1000',"color": "#fb8146"},
                        {"min": 101, "max": 499, "label": '101-499',"color": "#ffA500"},
                        {"min": 10, "max": 100, "label": '10-100',"color": "#ffb248"},
                        {"min": 0, "max": 9, "label": '0-9',"color" : "#fff2d1" }]))
m2.set_series_opts(label_opts=opts.LabelOpts(is_show=False))
# 加载JavaScript
# 在第一次渲染的时候调用 load_javascript() 会预先加载基本 JavaScript 文件到 Notebook 中。
# 如若后面其他图形渲染不出来,则请开发者尝试再次调用,因为 load_javascript 只会预先加载最基本的 js 引用。
# 而主题、地图等 js 文件需要再次按需加载。
m2.load_javascript()
# load_javascript() 和 render_notebook() 方法需要在不同的 cell 中调用,
# 这是 Notebook 的内联机制,其实本质上我们是返回了带有 _html_, _javascript_ 对象的 class。notebook 会自动去调用这些方法。
m2.render_notebook()
步骤6:国内疫情方寸间
单独取出中国疫情数据
# 单独取出中国疫情数据
China_data = world_data.loc[world_data['country']=="中国"]

# 使索引从0开始递增
China_data.reset_index(drop=True,inplace=True)

China_data
提取China_data的累计确诊、累计治愈与累计死亡数据
# 提取China_data的累计确诊、累计治愈与累计死亡数据
# data.at[n,'name']代表根据行索引和列名,获取对应元素的值
w_confirm = China_data.at[0,'confirm']
w_heal = China_data.at[0,'heal']
w_dead = China_data.at[0,'dead']
导入matplotlib相关库
import matplotlib.pyplot as plt
import matplotlib.patches as patches
构建国内疫情方寸间图示
# -*- coding: utf-8 -*-
%matplotlib inline

# 定义一个图像窗口
fig1 = plt.figure()

# 设置图像为1行1列,形状为正方形,背景为米黄色
ax1 = fig1.add_subplot(111, aspect='equal', facecolor='#fafaf0')

# 设置坐标轴的范围
ax1.set_xlim(-w_confirm/2 , w_confirm/2 )
ax1.set_ylim(-w_confirm/2 , w_confirm/2 )

#隐藏上边界与右边界
ax1.spines['top'].set_color('none')
ax1.spines['right'].set_color('none')

#移动坐标轴至中心
ax1.spines['bottom'].set_position(('data', 0))
ax1.spines['left'].set_position(('data', 0))

#关闭坐标刻度
ax1.set_xticks([])
ax1.set_yticks([])

# 设置生成图形的参数
p0 = patches.Rectangle((-w_confirm/2, -w_confirm/2), width=w_confirm, height=w_confirm, facecolor='#29648c',label='confirm')
p1 = patches.Rectangle((-w_heal/2, -w_heal/2), width=w_heal, height=w_heal, facecolor='#69c864',label='heal')
p2 = patches.Rectangle((-w_dead/2, -w_dead/2), width=w_dead, height=w_dead, facecolor='#000000',label='dead')

# 将所设置的图形传入图像
plt.gca().add_patch(p0)
plt.gca().add_patch(p1)
plt.gca().add_patch(p2)

# 设置坐标图标题与字号
plt.title('COVID-19 Square - China', fontdict={'size':20})

#在最好的位置显示图示
plt.legend(loc='best')
plt.show()
步骤7:国际疫情方寸间
重新排序数据
# 根据"confirm"进行降序排序(调节ascending参数可选择升序或降序)
world_data.sort_values("confirm", ascending=False,inplace=True)
# 使索引按0,1,2,3,4开始递增
world_data.reset_index(drop=True,inplace=True)
world_data
构建国际疫情方寸间图示
# -*- coding: utf-8 -*-
%matplotlib inline

# 设置中文显示
plt.rcParams['font.sans-serif'] = [u'SimHei']
# Mac系统下设置字体为Arial Unicode MS
# plt.rcParams['font.sans-serif'] = [u'Arial Unicode MS']
plt.rcParams['axes.unicode_minus'] = False

# 创建图像,大小为25*25
fig1 = plt.figure(figsize=(25, 25))

for a in range(20):
    # 提取world_data的累计确诊、累计治愈与累计死亡数据
    # data.at[n,'name']代表根据行索引和列名,获取对应元素的值
    w_confirm = world_data.at[a,'confirm']
    w_heal = world_data.at[a,'heal']
    w_dead = world_data.at[a,'dead']

    # 将整个图像窗口分为5行4列,生成第a个图示,形状为正方形,背景为米黄色
    ax1 = fig1.add_subplot(20/4, 4, a+1, aspect='equal', facecolor='#fafaf0')

    # 设置坐标轴的范围
    ax1.set_xlim(-w_confirm/2 , w_confirm/2 )
    ax1.set_ylim(-w_confirm/2 , w_confirm/2 )

    # 隐藏上边界与右边界
    ax1.spines['top'].set_color('none')
    ax1.spines['right'].set_color('none')

    # 移动坐标轴至中心
    ax1.spines['bottom'].set_position(('data', 0))
    ax1.spines['left'].set_position(('data', 0))

    # 关闭坐标刻度
    ax1.set_xticks([])
    ax1.set_yticks([])

    # 设置生成图形的参数
    p0 = patches.Rectangle((-w_confirm/2, -w_confirm/2), width=w_confirm, height=w_confirm,
                           alpha=w_confirm/90000,  facecolor='#29648c',label='confirm')
    p1 = patches.Rectangle((-w_heal/2, -w_heal/2), width=w_heal, height=w_heal, alpha=1, facecolor='#69c864',label='heal')
    p2 = patches.Rectangle((-w_dead/2, -w_dead/2), width=w_dead, height=w_dead, alpha=1, facecolor='black',label='dead')

    # 将所设置的图形传入图像
    plt.gca().add_patch(p0)
    plt.gca().add_patch(p1)
    plt.gca().add_patch(p2)

    # 设置坐标图标题与字号
    plt.title(world_data.at[a,'country'], fontdict={'size':20})

    #在最好的位置显示图示
    plt.legend(loc='best')

#显示图示
plt.show()


