数据爬虫及可视化——东京奥运会奖牌榜
东京奥运会奖牌榜爬虫
- 通过手机浏览器实时查看奥运会奖牌信息
- 将手机浏览器访问的地址复制,通过计算机浏览器访问
-
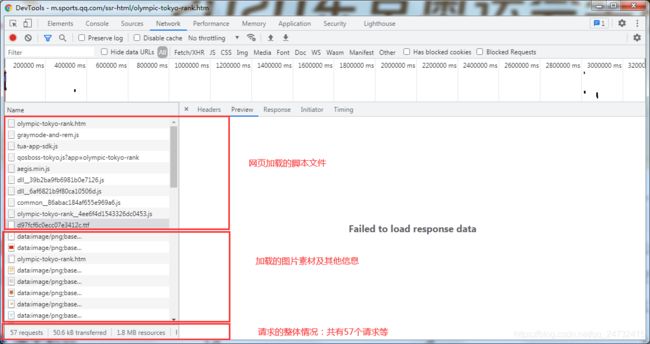
- 打开谷歌浏览器的开发者工具,切换到network选项卡,刷新页面重新请求。
- 拖动滚动条,找到具体获取本届奥运会的请求
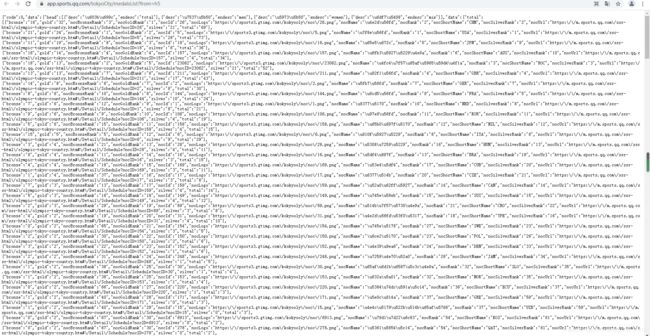
- 复制该请求,直接用浏览器访问
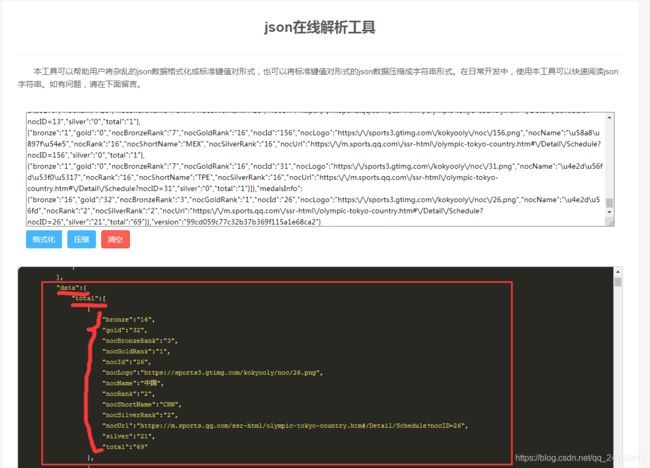
- 使用在线json解析工具,简单解析
- 数据爬取和解析
-
- 数据爬取
- 解析金牌榜信息
- 提取金牌榜信息
- 选择金牌榜前10国家和金牌数并封装数据
- 绘制饼图
正值东京奥运会期间,除了为奥运健儿们加油,被他们“更高、更快,更强,更团结”的拼搏精神所折服外,作为一个热血青年,其实想更多地了解中国奥运天团一路走来的历史。所以,就让我用简单的数据爬取和分析来一次时空的旅行,探索被掩盖在数据下的故事。
今天就先来了解2020东京奥运会的相关情况吧。
通过手机浏览器实时查看奥运会奖牌信息
将手机浏览器访问的地址复制,通过计算机浏览器访问
访问地址:
https://m.sports.qq.com/ssr-html/olympic-tokyo-rank.htm
打开谷歌浏览器的开发者工具,切换到network选项卡,刷新页面重新请求。
拖动滚动条,找到具体获取本届奥运会的请求
复制该请求,直接用浏览器访问
请求地址为:
https://app.sports.qq.com/tokyoOly/medalsList?from=h5
使用在线json解析工具,简单解析
在线json工具:
https://www.daimadog.com/json
将复制好的json数据直接复制到在线解析工具的输入框中,点击格式化:
通过简单的解析,知道获取对象结构后,就可以使用Python进行数据爬取和解析了。
数据爬取和解析
数据爬取
import requests

url = 'https://app.sports.qq.com/tokyoOly/medalsList?from=h5'

text = requests.get(url).json()

print(text)
解析金牌榜信息
#查看数据类型:字典类型
print(type(text))


#通过键值对访问得到
l = text["data"]["data"]["total"]
print(l)
提取金牌榜信息
#查看有多少国家获得奖牌
print(len(l))
#查看国家或地区名称
print(l[0]["nocName"])

#遍历读取每个国家获取的奖牌数
strs = []#存储文本
imgs = []#存储图片链接
r = 1#金牌榜排名计数
for i in l:
    m = {}
    #通过format格式化,得到想要的信息串
    s = "{}位列金牌榜第{}位,获取了{}块金牌,{}块金牌,{}块金牌,共计{}块奖牌。".format(i["nocName"],r,i["gold"],i["silver"],i["bronze"],i["total"])
    print(s)
    r=r+1
    imgUrl= i["nocUrl"]
    print(imgUrl)
    #imName="%s.jpg"%(i["nocName"])
    #将国家或地区名及国旗图片地址保存在map中
    m[i["nocName"]]=imgUrl
    #分别追加在列表中
    strs.append(s)
    imgs.append(m)
选择金牌榜前10国家和金牌数并封装数据
#饼图可视化金牌榜前十国家及地区占比总金牌数
#金牌总数
total = 0
for i in l:
    total += int(i["gold"])

#金牌榜前十
top10=[]
top10Total = 0
print("国家和地区名\t金牌数")
for i in range(0,10):
    top10Total += int(l[i]["gold"])
    top10.append([l[i]["nocName"],int(l[i]["gold"])])
    print(l[i]["nocName"],"\t\t",l[i]["gold"])
top10.append(["其他",total-top10Total])
print("金牌总数%d"%total)
print("第10位以后金牌数%d"%(total-top10Total))

#分别将国家及地区名和金牌数封装在列表中
Type=[]
Rate=[]
for a in top10:
    Type.append(a[0])
    Rate.append(a[1])
绘制饼图
import numpy as np
import matplotlib.pyplot as plt
import matplotlib as mpl

#导入设置库,对可视化图形直接设置字体及大小
from matplotlib import rcParams
mpl.rcParams['font.family'] = 'simhei'
mpl.rcParams['font.size']=15

#饼图可视化方法
def pie(x,y):
    # make a square figure
    plt.figure(1, figsize=(6,6))
    # For China, make the piece explode a bit
    expl = [0,0.1,0,0,0,0,0,0,0,0,0]   #第二块即China离开圆心0.1
    # Colors used. Recycle if not enough.
    colors  = ["blue","red","coral","green","yellow","orange"]  #设置颜色(循环显示)
    # Pie Plot
    # autopct: format of "percent" string;百分数格式
    plt.pie(y, explode=expl, colors=colors, labels=x, autopct='%1.1f%%',pctdistance=0.8, shadow=True)
    plt.title('东京奥运会金牌榜前十', bbox={'facecolor':'0.8', 'pad':5})

    #建议先保存图片再显示,调换顺序的话,图片生成后是空白的。
    plt.savefig("pie.png")

    plt.show()
    plt.close()

# Rate: 金牌数
# Type: 国家及地区名

#调用方法
pie(Type,Rate)


