在Google Chrome和Visual Studio Code中调试JavaScript
Learning to debug is an essential skill for taking the next step as a developer. It's important to understand and leverage the vast array of tools that exist for a given languge. Unfortunately, debugging might not seem as obvious when working with JavaScript outside of a full-fledged IDE. At least not initially. Let's take a look at getting started debugging JavaScript in the Google Chrome Dev Tools as well as my favorite text editor for Web Development, Visual Studio Code.
学习调试是开发人员下一步要做的一项基本技能。 重要的是要了解和利用针对给定语言的大量工具。 不幸的是,在成熟的IDE之外使用JavaScript时,调试似乎并不明显。 至少最初不是这样。 让我们看一下开始在Google Chrome开发者工具中调试JavaScript以及我最喜欢的Web开发文本编辑器Visual Studio Code。
Check out Learn Visual Studio Code to learn everything you need to know about about the hottest editor in Web Development for only $10!
查看“ 学习Visual Studio Code” ,仅需10美元,即可了解有关Web开发中最热的编辑器所需的所有知识!
TLDR-在Chrome中调试JavaScript? ( TLDR - Debugging JavaScript in Chrome? )
- Open the 'Sources' tab 打开“来源”标签
- Inspect code 检查代码
- Set breakpoints, inspect variables, etc. 设置断点,检查变量等。
TLDR-在Visual Studio代码中调试JavaScript? ( TLDR - Debugging JavaScript in Visual Studio Code? )
- Download the Debugger for Chrome extension 下载Debugger for Chrome扩展程序
- Create Debug configuration 创建调试配置
- Launch Debug configuration 启动调试配置
- Set breakpoints, inspect variables, etc. 设置断点,检查变量等。
建立 ( Setup )
For this article, I'm giong to be debugging an application called 'Quick Chat'.
对于本文,我非常希望调试一个名为“快速聊天”的应用程序。
While it is not required for you to run the same application, you can easily follow this video series to build the application yourself or clone the source code if you choose.
尽管不需要运行相同的应用程序,但是您可以轻松按照以下视频系列自行构建应用程序,也可以根据需要克隆源代码 。
Whatever project you decide to run, you'll need to start it up. You can serve your applicatin from Node, like I'm doing, or from the Live Server extension for a simple static site. If you're new to the Live Server extension, check out this getting started video.
无论您决定运行哪个项目,都需要启动它。 您可以像我正在做的那样从Node或从Live Server扩展为简单的静态站点提供您的应用程序。 如果您不熟悉Live Server扩展,请查看此入门视频 。
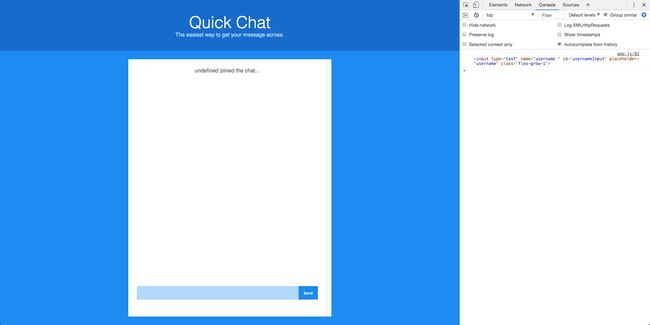
With my project, I've added a tiny bug that fails to register who the user is after they've logged in. Technically speaking, I'm incorrectly grabbing the user's username by referencing usernameInput.text instead of usernameInput.value. If I made this mistake in real life, my first instinct is to use console.log() to print out the DOM element reference (bad James....BAD JAMES), which isn't all that help as you can see. If this is you're first instinct also, don't worry, that's why you're here!!
在我的项目中,我添加了一个小错误,该错误无法注册用户登录后的身份。从技术上来说,我通过引用usernameInput.text而不是usernameInput.text来错误地抓住用户的用户usernameInput.value 。 如果我在现实生活中犯了这个错误,我的第一个直觉是使用console.log()打印出DOM元素引用(坏James .... BAD JAMES),这并不是您所看到的全部帮助。 如果这也是您的本能,请不用担心,这就是为什么您在这里!
调试基础 ( Debugging Basics )
Let's start with the basics. The idea of debugging is being able to (conditionally) trigger what are called breakpoints to pause the execution of your code. This provides you, the developer, the opportunity to look at the state of your application by inspecting variables for example. You can even take it a step further and 'watch' variables of your choosing, so that whenever your application gets paused, you can inspect them specifically. After triggering a breakpoint, you will typically have the following options.
让我们从基础开始。 调试的想法是能够(有条件地)触发所谓的断点来暂停代码的执行。 这为开发人员提供了机会,例如通过检查变量来查看应用程序的状态。 您甚至可以更进一步,并“观察”您选择的变量,以便每当您的应用程序暂停时,您都可以对其进行专门检查。 触发断点后,通常将具有以下选项。
- continue execution of your program 继续执行程序
- step through your code line by line 逐行浏览代码
- step out of the current function that you are in 退出当前所在的功能
- step into the next function call. 进入下一个函数调用。
You'll additionally have access to view the call stack. In other words, as functions call other functions in your program, you can inspect the history of those function calls.
您还将有权查看调用堆栈。 换句话说,当函数调用程序中的其他函数时,您可以检查这些函数调用的历史记录。
在Google Chrome浏览器中进行调试 ( Debugging in Google Chrome )
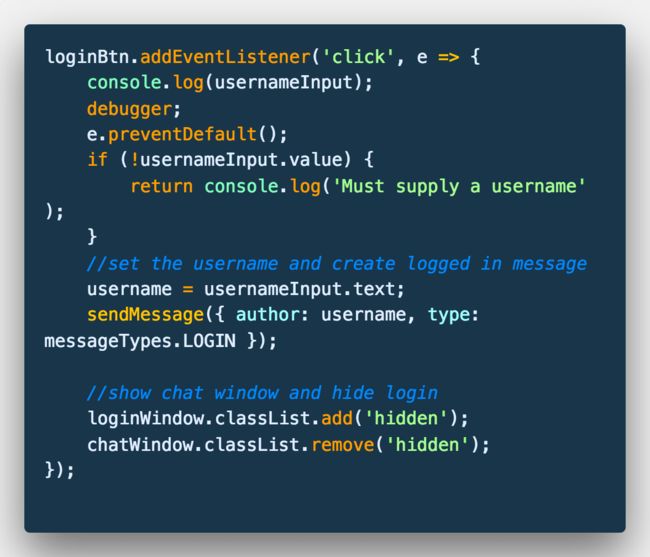
To get started with debugging in Chrome, add a debugger statement to the application as I have below in the loginBtn click event handler.
要开始在Chrome中进行debugger ,请按照下面在loginBtn click事件处理程序中的步骤向应用程序中添加debugger语句。
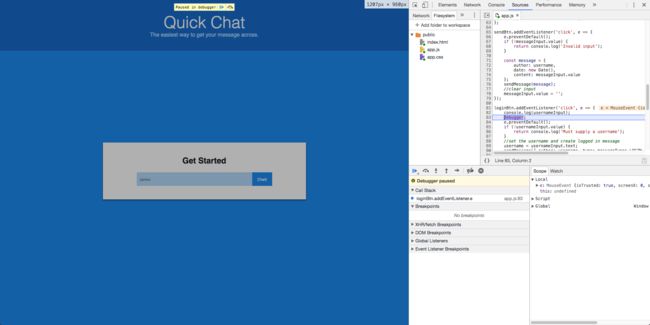
When this statement is reached, your application will be paused and the debug tools will automatically be activated. Noticed how the application is greyed out to signify that it has been stopped. Notice also how the Sources tab in the Chrom Dev Tools has popped up open proudly.
达到此语句后,您的应用程序将被暂停,调试工具将被自动激活。 注意应用程序如何变灰以表示它已被停止。 还请注意,Chrom开发工具中的“源”选项卡如何自豪地弹出。
Let's breakdown what we're seeing.
让我们分解一下我们所看到的。
源代码 (Source Code)
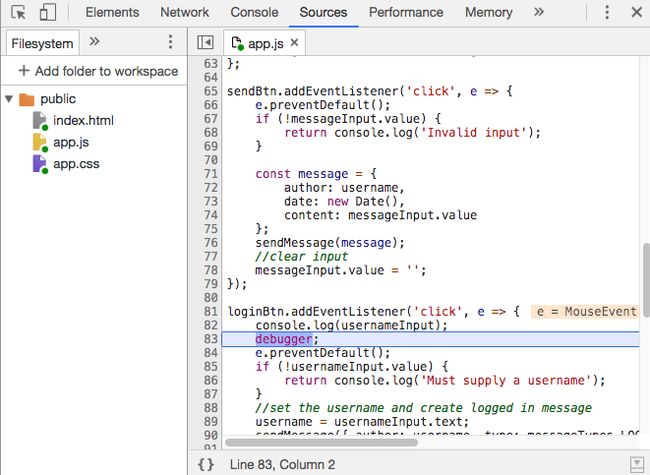
The first thing you might notice is what appears to be a copy of your code. This is the code that the browser has loaded and is running as your application. You can also see that the debugger line is higlighted a blue color to let us know that this is where our application has been paused.
您可能会注意到的第一件事似乎是代码的副本。 这是浏览器已加载并作为您的应用程序运行的代码。 您还可以看到debugger行显示为蓝色,以告知我们这是我们的应用程序已暂停的地方。
Chrome gives you the ability to view this code for a reason. With the code in front of you, you can now set breakpoints. A breakpoint is intentional stopping or pausing place in a program. The debugger statement we used above functions as a breakpoint, but isn't necessarily picked up by Chrome as one.
Chrome使您能够出于某种原因查看此代码。 现在有了代码,您就可以设置断点了。 断点是故意在程序中停止或暂停的地方。 我们上面使用的debugger语句用作断点,但Chrome不一定会将其作为断点。
Breakpoint - intentional stopping or pausing place in a program
断点-程序中有意停止或暂停的地方
To add a breakpoint, click in the gutter, or empty space, to the left of the line numbers. As your do, notice that Chrome now adds this breakpoint to the list of breakpoints further down.
要添加断点,请单击行号左侧的装订线或空白区域。 在执行操作时,请注意,Chrome现在将此断点添加到了更进一步的断点列表中。
范围 ( Scope )
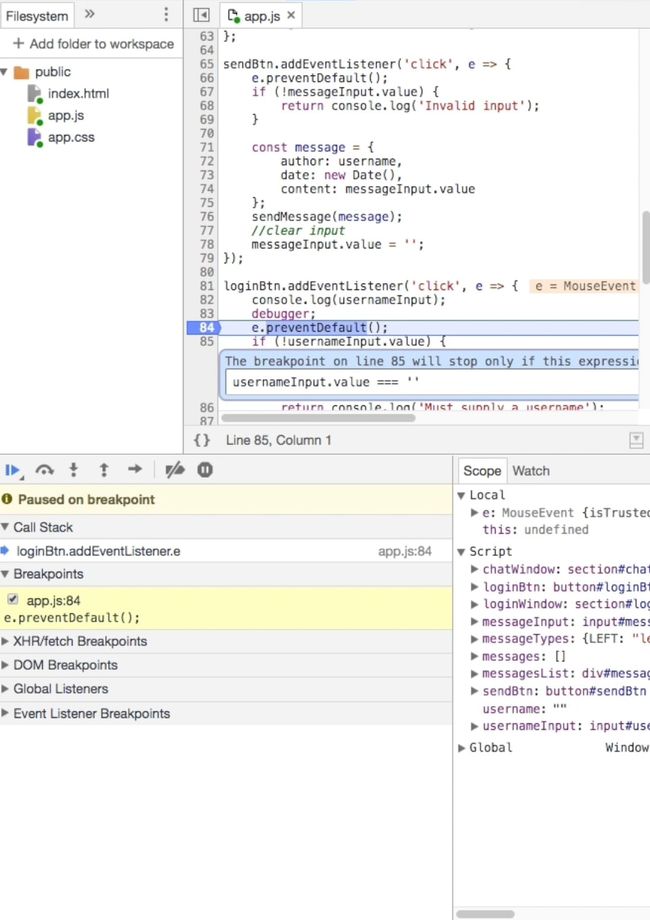
In the scope tab, you have the ability to inspect variables in your application. You'll notice there is a local section (local scope to the function where the breakpoint is), a global section (the global scope), and a scripts section. In the scripts section, you can view variables within the scope of the current script.
在作用域选项卡中,您可以检查应用程序中的变量。 您会注意到有一个本地节(断点所在的函数的本地作用域),一个全局节(全局作用域)和一个脚本节。 在脚本部分,您可以查看当前脚本范围内的变量。
This is where a significant amount of your debugging time will be spent. This is a much more efficient replacement for writing out many console.log() statements.
这是您将花费大量调试时间的地方。 这是写出许多console.log()语句的更有效的替代方法。
看 ( Watch )
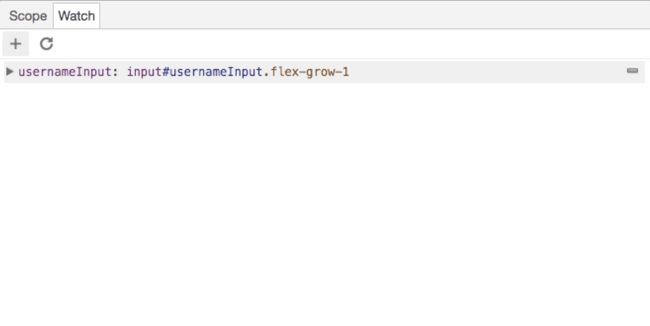
As I mentioned earlier, in addition to viewing variables in the scope tab, you can also define variables that you want to look into specifically. By adding a variable to the watch tab, each time you hit a breakpoint, you can quickly find the value of that variable (which may be undefined depending on where you are in the code). Hit the add icon and enter the name of the variable you want to watch to track, in this case, usernameInput.
如前所述,除了在“作用域”选项卡中查看变量之外,您还可以定义要专门研究的变量。 通过将变量添加到监视选项卡,每次您遇到断点时,您都可以快速找到该变量的值(根据您在代码中的位置,该值可能是未定义的)。 点击添加图标,然后输入要监视的变量名称,在本例中为usernameInput 。
步骤功能,调用堆栈和断点列表 ( Step Functions, Call Stack, and Breakpoints List )
The last section, located in the bottom left of the Sources tab in my configuration, will allow you to view the list of breakpoints, call stack, etc.
最后一部分位于我的配置中“源”选项卡的左下方,可让您查看断点列表,调用堆栈等。
In the call stack above, there is one function listed which is the event handler for my login button. This function is listed because it is the only function that has been called so far. As functions call more functions, that chain will be updated appropriately.
在上面的调用堆栈中,列出了一个函数,该函数是我的登录按钮的事件处理程序。 之所以列出此函数,是因为它是迄今为止唯一被调用的函数。 随着函数调用更多函数,该链将得到适当更新。
Notice also the arrow buttons at the top of this screenshot. These correspond to the functions referenced above for continuing execution of your code or stepping through it line by line or by function. I would recommend testing these buttons for a bit to get used to how you navigate the execution of your code.
还要注意此屏幕截图顶部的箭头按钮。 这些与上面引用的用于继续执行代码或逐行或逐功能地执行代码的功能相对应。 我建议稍微测试一下这些按钮,以习惯于如何导航代码的执行。
Lastly, there are different kinds of breakpoints that can be set. Let's take a look at creating a conditional breakpoint, one that will only get triggered if a certain condition is met. For example, let's say we want to break on the login button callback only when the user attempted to login without entering a username. We can do this, by right-clicking in the gutter and choosing conditional breakpoint with the following condition, usernameInput.text === ''.
最后,可以设置不同种类的断点。 让我们看一下创建一个条件断点,该断点只有在满足特定条件时才会被触发。 例如,假设我们只想在用户尝试登录而不输入用户名时中断登录按钮回调。 我们可以通过右键单击装订线并选择具有以下条件的条件断点usernameInput.text === ''来做到这一点。
In the case of debugging Quick Chat, if you press the login button without entering a username, this breakpoint will be triggered. Otherwise code will continue to execute as normal.
在调试快速聊天的情况下,如果您在未输入用户名的情况下按下登录按钮,则会触发此断点。 否则,代码将继续正常执行。
Note that there are even more breakpoint options available that are not covered here.
请注意,这里没有涵盖更多可用的断点选项。
VS代码中的调试 ( Debugging in VS Code )
The Chrome Developer Tools are some of the best in the business. As you've seen so far, they offer a great experience to debug your application with lots of functionality. However, Visual Studio Code has worked really hard to match that debugging functionality in a more seamless way. In my mind, I absolutely love VS Code and want to spend as much time there, and not in other tools, as possible. This includes debugging.
Chrome开发人员工具是业内最好的工具。 正如您到目前为止所看到的,它们为您提供调试功能丰富的应用程序的丰富经验。 但是,Visual Studio Code一直非常努力地以更无缝的方式匹配该调试功能。 在我看来,我绝对喜欢VS Code,并希望在该处花费更多的时间,而不是在其他工具中花费尽可能多的时间。 这包括调试。
I absolutely love VS Code and want to spend as much time there, and not in other tools, as possible. This includes debugging.
我绝对喜欢VS Code,并希望在这里花费更多的时间,而不是在其他工具中花费尽可能多的时间。 这包括调试。
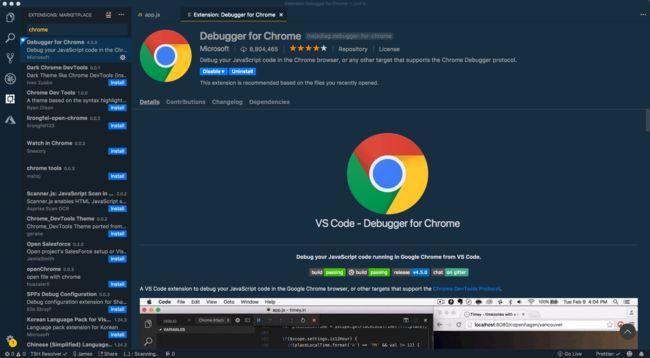
To get started debugging in VS Code, you will need to install the Debugger for Chrome extension.
要开始使用VS Code进行调试,您需要安装Debugger for Chrome扩展程序。
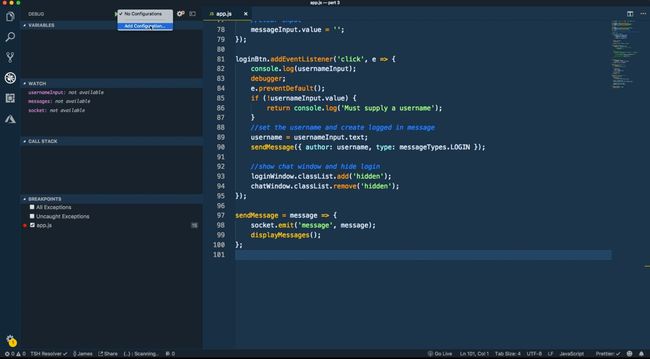
Let's take a quick look at the Debug tab in the sidebar (on the left side of your editor by default). Open the debug tab by clicking on the icon that... well looks like a bug. With this pane open, you should recognize very similar tools to what we saw in Chrome... variables, watch, call stack, and breakpoints.
让我们快速看一下边栏中的“调试”选项卡(默认情况下位于编辑器的左侧)。 通过单击图标,打开调试选项卡。 打开此窗格,您应该认识到与我们在Chrome中看到的工具非常相似的工具...变量,监视,调用堆栈和断点。
The majority of the functionality that you get in Chrome Dev Tools is available right here inside of VS Code.
您可以在VS Code中找到Chrome开发工具中提供的大多数功能。
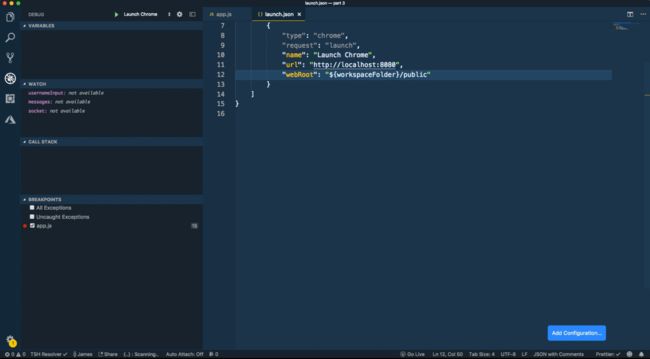
Now that we've seen the Debug tab, we need to create a launch configuration that tells VS Code how to debug your application. VS Code stores debug configurations in a file called launch.json inside of a folder .vscode. To have VS Code create this file for us, click on the 'No Configurations' dropdown and choose 'Add Configuration'.
现在我们已经看到了Debug选项卡,我们需要创建一个启动配置,告诉VS Code如何调试您的应用程序。 VS Code将调试配置存储在文件夹.vscode内名为launch.json的文件中。 要让VS Code为我们创建此文件,请单击“无配置”下拉菜单,然后选择“添加配置”。
VS Code stores debug configurations in a file called launch.json inside of a folder .vscode.
VS Code将调试配置存储在文件夹.vscode内名为launch.json的文件中。
Then choose 'Chrome' in this case.
然后在这种情况下选择“ Chrome”。
Then, choose the 'Chrome: Launch' configuration from the popup dropdown list.
然后,从弹出式下拉列表中选择“ Chrome:启动”配置。
The specific configuration that we created will automatically attach to the application at the defined port. We need to make one small change to this configuration to correctly point to the source code for the app. The source code is located in the public directory, which is why I have updated the 'webRoot' property.
我们创建的特定配置将自动在定义的端口连接到应用程序。 我们需要对此配置进行一些小的更改,以正确指向应用程序的源代码。 源代码位于公共目录中,这就是为什么我更新了'webRoot'属性。
**Keep in mind that your application must already be running locally at a certain port for this to work.
**请记住,您的应用程序必须已经在某个端口上本地运行才能正常工作。
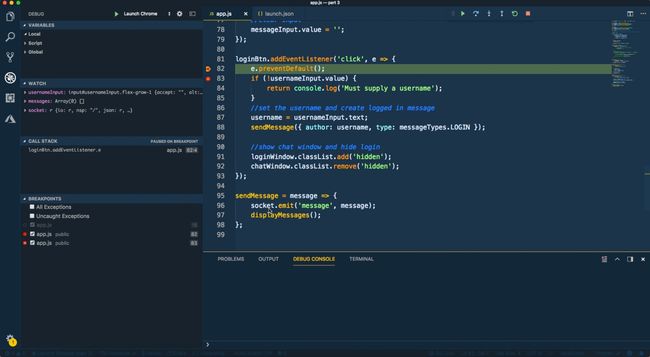
With the configuration defined, you can now start your debug session by clicking the green play button. Your application should pop up in a Chrome window as shown. Also, notice the debug menu bar that popped up in the background inside of VS Code. With this debug toolbar, you can pause, restart, continue, and use step functions to navigate your code and interact with the debugger.
定义好配置后,您现在可以通过单击绿色的播放按钮来启动调试会话。 您的应用程序应在Chrome窗口中弹出,如图所示。 另外,请注意VS Code内部背景中弹出的调试菜单栏。 使用此调试工具栏,您可以暂停,重新启动,继续,并使用步进功能来浏览代码并与调试器进行交互。
With this debug toolbar, you can pause, restart, continue, and use step functions to navigate your code and interact with the debugger.
使用此调试工具栏,您可以暂停,重新启动,继续,并使用步进功能来浏览代码并与调试器进行交互。
With debugging connected, you can set a breakpoint in the code, just like we did in Chrome. Click in the 'gutter' next to the line number. I'm keeping my breakpoint in the same location as before, just inside the login event callback.
连接调试后,您可以像在Chrome中一样在代码中设置断点。 单击行号旁边的“装订线”。 我将断点保持在与以前相同的位置,就在登录事件回调内部。
Now, when trying to login without entering a username, the breakpoint should trigger swiching the contect back to VS Code for further investigation.
现在,当尝试在不输入用户名的情况下登录时,断点应触发将连接切换回VS Code,以进行进一步调查。
From here, the functionality that we discussed in Chrome maps over directly to VS Code. If you want to add a conditional breakpoint, right-click in the gutter and choose 'conditional breakpoint' with some condition. If you want to watch a variable, click to add a new one, and type the name of the variable to watch. If you want to explore variables, go to the variables tab and explore away!
从这里开始,我们在Chrome中讨论的功能直接映射到VS Code。 如果要添加条件断点,请在装订线中单击鼠标右键,然后选择带有某些条件的“条件断点”。 如果要监视变量,请单击添加一个新变量,然后键入要监视的变量的名称。 如果要浏览变量,请转到“变量”选项卡,然后继续浏览!
回顾 ( Recap )
As I said ealier, to take that next step as a developer means more than just writing better code. It means taking advantage of the ecosystem of tools that your language lives in. Debugging is one of those topics that takes some time and effort to get started with, but ultimately, the benefit will vastly outweigh the cost.
正如我所说的,以开发人员的身份迈出下一步不仅意味着编写更好的代码。 这意味着要利用您的语言所居住的工具生态系统。调试是开始时需要花费一些时间和精力的主题之一,但是最终,收益将大大超过成本。
My recommendation is to spend some time debugging with both Chrome and VS Code, and see what you like best. If you have any questions or comments, find me on twitter, @jamesqquick.
我的建议是花一些时间使用Chrome和VS Code进行调试,然后看看您最喜欢的是什么。 如果您有任何疑问或意见,请在Twitter上找到我, @ jamesqquick 。
翻译自: https://scotch.io/tutorials/debugging-javascript-in-google-chrome-and-visual-studio-code


