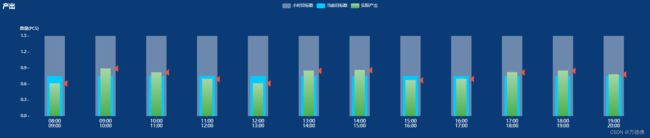
Echars柱状图嵌套 居中对齐 柱子占比宽度由大到小嵌套包含 并用小箭头标记当前产出位置
效果图:
DOCTYPE html>
<html>
	<head>
		<meta charset="utf-8">
		<title>Echars柱状图嵌套 title>
		<style type="text/css">
			body{
				height: 100%;
				width: 100%;
				background-color: #0a3b76;
			}
		style>
	head>
	<body>
		<div style="width: 100%;height: 400px;" id="echarts">div>
	body>
	<script src="https://cdnjs.cloudflare.com/ajax/libs/echarts/5.3.2/echarts.min.js" type="text/javascript" charset="utf-8">script>
	<script type="text/javascript">
		echars()
		function echars() {
			let xAxis = ['08:00~09:00', '09:00~10:00', '10:00~11:00', '11:00~12:00', '12:00~13:00', '13:00~14:00',
				'14:00~15:00', '15:00~16:00', '16:00~17:00', '17:00~18:00', '18:00~19:00',
				'19:00~20:00'
			]

			var dl1 = [];
			var dl2 = [];
			var dl3 = [];
			for (let item of xAxis) {
				dl1.push(750 * 2)
				dl2.push(750)
				dl3.push(parseInt(Math.random() * 300 + 600))
			}

			var legend = ["小时目标数", "当前目标数", "实际产出"];
			let color = [
				['rgba(255,255,255,0.4)', '#00cbff', '#a5d6a7'],
				['rgba(255,255,255,0.4)', '#00cbff', '#4caf50']
			]
			//定义两个上下箭头的矢量路径
			var icon = 'data:image/png;base64,iVBORw0KGgoAAAANSUhEUgAAACAAAAAgCAYAAABzenr0AAAAAXNSR0IArs4c6QAAAdBJREFUWEfFlz9Lw0AYh39vC0VRXBQcxMVBFCdRxMFeUgtFBIXmUnFQ1E0KLkrBQTDgIBRBEKT5EuIncPADCZqrlWqbkysESrG2zb9mDcnz3O/e996EMOSL4uBLy0qQZbl/sSIXqBb0LbgyN/70eh67gDDYNYgsAu5jFajts9nGD9kEbKtVxypQ4xnelK4NwpQXeWwCDtfKBJQ69zpygTrXF75bqyatS6FFVwMOZ0cEqgAY7dbSkSUgDO0RhGKvsyR0gc9CZqXpuqrKV3vBQ+8CYWhFEB77AYfaBfJYHxFCrZqOBoGHksCXwViDyAawOCg8sIDDtRIBZT/gQFvg5LOTlGzYkDCDwH0n8M435pJIqv7ODUXAgwqT3UDSVRCJwOeAw7UdAlQaM35EAgsoaHU3Oy1TjQok8oNKhCLgQR2uXxLk7SASoQoo8HuebSYTrQE0349I6AIKKg9zY6JWV/PgoJdEJAIe9MPQzhKEh/8kIhVQ4FohvdZ0E+qoXo79g6QdKDirAHTaKRF5Au3AqqmdSCltgFKBZkGvwvrvvuCZJcBVXZL2PQuCCHjPVk39Tkp5EesWdIoLzvYItB7rn1GnhBrtE88vb106JIyw/b/jF+LXtiFzcqxuAAAAAElFTkSuQmCC';
			let myChart = echarts.getInstanceByDom(document.getElementById('echarts'));
			if (myChart === undefined) {
				myChart = echarts.init(document.getElementById('echarts'));
			};
			// 显示标题,图例和空的坐标
			myChart.showLoading({
				text: 'loading',
				color: '#19ecff',
				textColor: '#fff',
				maskColor: 'rgba(58, 186, 255, 0.1)',
				zlevel: 0,
			}); //数据加载完之前先显示一段简单的loading动画
			var option = {
				title: {
					text: "产出",
					textStyle: {
						//文字颜色
						color: '#fff',
						fontSize: 18
					}
				},
				tooltip: {
					trigger: 'axis',
					backgroundColor: 'rgba(42, 47, 53, 0.9)',
					borderColor: '#ffffff',
					textStyle: {
						color: "#fff"
					},
					axisPointer: {
						lineStyle: {
							color: '#fff'
						}
					},
					formatter: function(params) {
						let html = "";
						html = params[0].name + '
';
						for (let i = 0; i < params.length; i++) {
							html +=
								'+
								params[i].color.colorStops[0].color + ';">'
							html += params[i].seriesName + " : " + params[i].value + " PCS
";
						}
						return html;
					},
				},
				legend: {
					data: legend,
					top: "0%",
					x: 'center', //居右显示
					// right: '3%',
					textStyle: {
						"color": "rgba(255,255,255,0.9)" //图例文字
					}
				},
				grid: {
					containLabel: true,
					left: '3%',
					right: '3%',
					bottom: '4%',
					top: '25%',
				},
				xAxis: [{
					axisLabel: {
						color: '#fff',
						fontSize: 14,
						interval: 0,
						formatter: function(value) {
							value = value.replace(/~/g, "");
							var ret = ""; //拼接加\n返回的类目项
							var max = 5; //每行显示的文字字数
							var val = value.length; //X轴内容的文字字数
							var rowN = Math.ceil(val / max); //需要换的行数
							if (rowN > 1) { //判断 如果字数大于2就换行
								for (var i = 0; i < rowN; i++) {
									var temp = ""; //每次截取的字符串
									var start = i * max; //开始截取的位置
									var end = start + max; //结束截取的位置
									temp = value.substring(start, end) + "\n";
									ret += temp; //最终的字符串
								}
								return ret;
							}
							return value
						}
					},
					axisTick: {
						show: true, // 隐藏坐标轴的刻度线
						alignWithLabel: true, // 图形于标题居中
					},
					splitLine: {
						show: false,
					},
					axisLine: {
						show: false
					},
					data: xAxis,
					type: 'category',
				},
				{
					type: 'category',
					axisLine: {
						show: false
					},
					axisTick: {
						show: false
					},
					axisLabel: {
						show: false
					},
					splitArea: {
						show: false
					},
					splitLine: {
						show: false
					},
					data: xAxis
				},
				{
					type: 'category',
					axisLine: {
						show: false
					},
					axisTick: {
						show: false
					},
					axisLabel: {
						show: false
					},
					splitArea: {
						show: false
					},
					splitLine: {
						show: false
					},
					data: xAxis
				},
				{
					type: 'category',
					axisLine: {
						show: false
					},
					axisTick: {
						show: false
					},
					axisLabel: {
						show: false
					},
					splitArea: {
						show: false
					},
					splitLine: {
						show: false
					},
					data: xAxis
				}],
				yAxis: {
					type: "value",
					name: "数量(PCS)",
					axisLabel: {
						"show": true,
						formatter: function(param) {
							let value = (param / 1000).toFixed(1);
							return value;
						}
					},
					axisTick: {
						show: true, // 隐藏坐标轴的刻度线
						alignWithLabel: true, // 图形于标题居中
					},
					axisLine: {
						show: false,
						lineStyle: {
							color: '#ffffff'
						}
					}, //右线色
					splitLine: {
						show: false,
						lineStyle: {
							color: "#b0c1d0"
						}
					}, //x轴线, //左线色
				},
				series: [
					{
						name: legend[0],
						data: dl1,
						type: 'bar',
						barWidth: '40%',
						barGap: 0,
						xAxisIndex: 0,
						itemStyle: {
							normal: {
								color: {
									type: "linear",
									x: 0,
									y: 0,
									x2: 0,
									y2: 1,
									colorStops: [{
											offset: 0,
											color: color[0][0]
										},
										{
											offset: 1,
											color: color[1][0]
										}
									],
									globalCoord: false
								}
							}
						},
						label: {
							normal: {
								show: false,
								position: "inside",
								textStyle: {
									color: "#fff",
									fontSize: 10
								}
							}
						},
					},
					{
						name: legend[1],
						data: dl2,
						type: 'bar',
						barWidth: '30%',
						barGap: 0,
						xAxisIndex: 1,
						itemStyle: {
							normal: {
								color: {
									type: "linear",
									x: 0,
									y: 0,
									x2: 0,
									y2: 1,
									colorStops: [{
											offset: 0,
											color: color[0][1]
										},
										{
											offset: 1,
											color: color[1][1]
										}
									],
									globalCoord: false
								}
							}
						},
						label: {
							normal: {
								show: false,
								position: "inside",
								textStyle: {
									color: "#fff",
									fontSize: 10
								}
							}
						},
					},
					{
						name: legend[2],
						data: dl3,
						type: 'bar',
						barWidth: '20%',
						barGap: 0,
						xAxisIndex: 2,
						itemStyle: {
							normal: {
								color: {
									type: "linear",
									x: 0,
									y: 0,
									x2: 0,
									y2: 1,
									colorStops: [{
											offset: 0,
											color: color[0][2]
										},
										{
											offset: 1,
											color: color[1][2]
										}
									],
									globalCoord: false
								}
							}
						},
						label: {
							normal: {
								show: false,
								position: "inside",
								textStyle: {
									color: "#fff",
									fontSize: 10
								}
							}
						},
					},
					{
						name: legend[2],
						data: dl3,
						type: 'bar',
						barWidth: '20%',
						barGap: 0,
						xAxisIndex: 3,
						itemStyle: {
							normal: {
								color: {
									type: "linear",
									x: 0,
									y: 0,
									x2: 0,
									y2: 1,
									colorStops: [{
											offset: 0,
											color: color[0][2]
										},
										{
											offset: 1,
											color: color[1][2]
										}
									],
									globalCoord: false
								}
							}
						},
						label: {
							show: true,
							position: ['120%',-11],
							color: '#DB5E6A',
							backgroundColor: {
								image: icon
							},
							formatter: function(params) {return ""},
							padding: [15, 15, 8, 5],
						},
					}
				]
			};
			myChart.hideLoading(); //隐藏加载动画
			myChart.clear();
			myChart.setOption(option, true);
		}
	script>
html>