机器学习-学习曲线(过拟合与欠拟合的判断)
Section I: Brief Introduction on LearningCurves
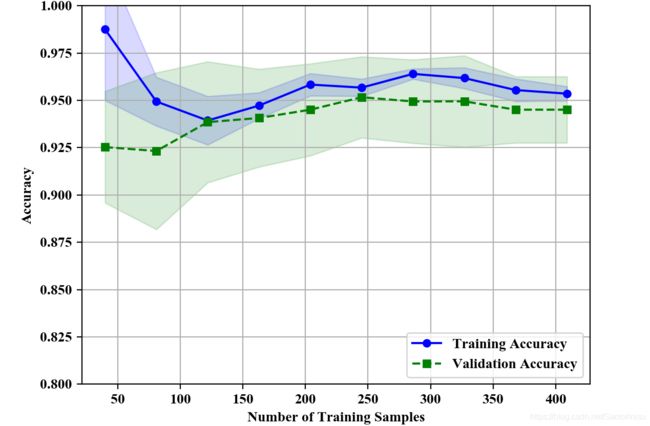
If a model is too complex for a given training dataset-there are too many degrees of freedom or paramters in this model-the model tends to overfit the training data and does not generalize well to unseen data. Often, it can help to collect more training samples to reduce the degree of overfitting. However, in practice, it can often be very expensive or simply not feasible to collect more data. By plotting the model training and validation accuracies as functions of the training set size, we can easily detect whether the model suffers from high variance or high bias, and whether the collection of more data could help address the problem.
FROM
Sebastian Raschka, Vahid Mirjalili. Python机器学习第二版. 南京:东南大学出版社,2018.
Section II: Code Bundle and Analyses
代码
from sklearn import datasets
from sklearn.model_selection import train_test_split
from sklearn.preprocessing import StandardScaler
from sklearn.decomposition import PCA
from sklearn.linear_model import LogisticRegression
from sklearn.pipeline import make_pipeline
import numpy as np
from sklearn.model_selection import learning_curve
import matplotlib.pyplot as plt
import warnings
warnings.filterwarnings("ignore")

plt.rcParams['figure.dpi']=200
plt.rcParams['savefig.dpi']=200
font = {'family': 'Times New Roman',
        'weight': 'light'}
plt.rc("font", **font)

#Section 1: Load Breast data, i.e., Benign and Malignant
breast=datasets.load_breast_cancer()
X=breast.data
y=breast.target
X_train,X_test,y_train,y_test=\
    train_test_split(X,y,test_size=0.2,stratify=y,random_state=1)

#Section 2: Define PipeLine Model
pipe_lr=make_pipeline(StandardScaler(),
                      PCA(n_components=2),
                      LogisticRegression(penalty='l2',
                                         random_state=1))

#Section 3: Analyze the Trend of Train Sample Versus Train/Test Performance
train_sizes,train_scores,test_scores=learning_curve(estimator=pipe_lr,
                                                    X=X_train,
                                                    y=y_train,
                                                    train_sizes=np.linspace(0.1,1.0,10),
                                                    cv=10,
                                                    n_jobs=1)
train_mean=np.mean(train_scores,axis=1)
train_std=np.std(train_scores,axis=1)
test_mean=np.mean(test_scores,axis=1)
test_std=np.std(test_scores,axis=1)

#Section 4: Visualize progressive trend between Train/Test learning curves
plt.plot(train_sizes,train_mean,color='blue',marker='o',markersize=5,label='Training Accuracy')
plt.fill_between(train_sizes,
                 train_mean+train_std,
                 train_mean-train_std,
                 alpha=0.15,color='blue')

plt.plot(train_sizes,test_mean,color='green',linestyle='--',marker='s',markersize=5,label='Validation Accuracy')
plt.fill_between(train_sizes,
                 test_mean+test_std,
                 test_mean-test_std,
                 alpha=0.15,color='green')
plt.grid()
plt.xlabel('Number of Training Samples')
plt.ylabel('Accuracy')
plt.legend(loc='lower right')
plt.ylim([0.8,1.0])
plt.savefig('./fig1.png')
plt.show()
结果

由上图可以得知,随着训练数据规模的增大,验证集和训练集的训练精度逐步逼近,由此说明模型的泛化性能较好。当然,若训练集随着规模的增大而精度增大,而验证集精度反而逐步下降,说明当前模型“过拟合”;反之,若验证集和训练集的精度均随着数据规模的增大而无明显提升,且精度较低,则说明当前模型存在较大偏差,即“欠拟合”。
参考文献:
Sebastian Raschka, Vahid Mirjalili. Python机器学习第二版. 南京:东南大学出版社,2018.