深度学习4大激活函数
如果不用激励函数(其实相当于激励函数是f(x) = x),在这种情况下你每一层输出实际上都是上层输入的线性函数。
这样就使得无论神经网络有多少层,输出都是输入的线性组合,与没有隐藏层效果相当,模型的表达力仍然不够。
我们决定引入非线性函数作为激励函数,这样深层神经网络才有意义(不再是输入的线性组合)。
本文将介绍深度学习中的4个常见的激活函数,从原函数公式、导数函数及二者的可视化来进行对比:
- Sigmoid函数
- Tanh函数
- ReLu函数
- Leaky ReLu函数
激活函数特征
- 非线性:激活函数满足非线性时,才不会被单层网络替代,神经网络才有了意义
- 可微性:优化器大多数是用梯度下降来更新梯度;如果不可微的话,就不能求导,也就不能更新参数
- 单调性:激活函数是单调的,能够保证网络的损失函数是凸函数,更容易收敛
Sigmoid函数
表示形式为tf.nn.sigmoid(x)
f ( x ) = 1 1 + e − x f(x)=\frac{1}{1+e^{-x}} f(x)=1+e−x1
原函数
In [1]:
# import tensorflow as

import matplotlib.pyplot as plt
import numpy as np
import pandas as pd
%matplotlib inline


def sigmoid(x):
    """
    返回sigmoid函数
    """
    return 1 / (1 + np.exp(-x))


def plot_sigmoid():
    # param:起点,终点,间距
    x = np.arange(-10, 10, 0.2)
    y = sigmoid(x)
    plt.plot(x, y)
    plt.grid()
    plt.show()


if __name__ == '__main__':
    plot_sigmoid()
导数函数
该函数的导数为:
f ′ ( z ) = ( 1 1 + e − z ) ′ = e − z ( 1 + e − z ) 2 = 1 + e − z − 1 ( 1 + e − z ) 2 = 1 ( 1 + e − z ) ( 1 − 1 ( 1 + e − z ) ) = f ( z ) ( 1 − f ( z ) ) \begin{aligned} f^{\prime}(z) &=\left(\frac{1}{1+e^{-z}}\right)^{\prime} \\ &=\frac{e^{-z}}{\left(1+e^{-z}\right)^2} \\ &=\frac{1+e^{-z}-1}{\left(1+e^{-z}\right)^2} \\ &=\frac{1}{\left(1+e^{-z}\right)}\left(1-\frac{1}{\left(1+e^{-z}\right)}\right) \\ &=f(z)(1-f(z)) \end{aligned} f′(z)=(1+e−z1)′=(1+e−z)2e−z=(1+e−z)21+e−z−1=(1+e−z)1(1−(1+e−z)1)=f(z)(1−f(z))
另一种求解方法:
步骤1:
d y d x = − ( 1 + e − x ) − 2 ⋅ ( 1 + e − x ) ′ = − ( 1 + e − x ) − 2 ⋅ 1 ⋅ ( e − x ) ′ = − ( 1 + e − x ) − 2 ⋅ 1 ⋅ ( e − x ) ⋅ ( − x ) ′ = − ( 1 + e − x ) − 2 ⋅ 1 ⋅ ( e − x ) ⋅ ( − 1 ) = ( 1 + e − x ) − 2 ⋅ ( e − x ) = e − x ( 1 + e − x ) 2 \begin{aligned} \frac{\mathrm{d} y}{\mathrm{~d} x} &=-\left(1+e^{-x}\right)^{-2} \cdot\left(1+e^{-x}\right)^{\prime} \\ &=-\left(1+e^{-x}\right)^{-2} \cdot 1 \cdot\left(e^{-x}\right)^{\prime} \\ &=-\left(1+e^{-x}\right)^{-2} \cdot 1 \cdot\left(e^{-x}\right) \cdot(-x)^{\prime} \\ &=-\left(1+e^{-x}\right)^{-2} \cdot 1 \cdot\left(e^{-x}\right) \cdot(-1) \\ &=\left(1+e^{-x}\right)^{-2} \cdot\left(e^{-x}\right) \\ &=\frac{e^{-x}}{\left(1+e^{-x}\right)^2} \end{aligned} dxdy=−(1+e−x)−2⋅(1+e−x)′=−(1+e−x)−2⋅1⋅(e−x)′=−(1+e−x)−2⋅1⋅(e−x)⋅(−x)′=−(1+e−x)−2⋅1⋅(e−x)⋅(−1)=(1+e−x)−2⋅(e−x)=(1+e−x)2e−x
步骤2:
1 − y = 1 − 1 1 + e − x = 1 + e − x − 1 1 + e − x = e − x 1 + e − x 1-y=1-\frac{1}{1+e^{-x}}=\frac{1+e^{-x}-1}{1+e^{-x}}=\frac{e^{-x}}{1+e^{-x}} 1−y=1−1+e−x1=1+e−x1+e−x−1=1+e−xe−x
步骤3:
d y d x = e − x ( 1 + e − x ) ∗ 1 ( 1 + e − x ) = y ( 1 − y ) \frac {dy}{dx}=\frac{e^{-x}}{(1+e^{-x})} * \frac{1}{(1+e^{-x})}=y(1-y) dxdy=(1+e−x)e−x∗(1+e−x)1=y(1−y)
# import tensorflow as

import matplotlib.pyplot as plt
import numpy as np
import pandas as pd
%matplotlib inline


def der_sigmoid(x):
    """
    返回sigmoid函数
    """
    sig = 1 / (1 + np.exp(-x))  # sigmoid函数

    return sig * (1 - sig)  # 输出为导数函数


def plot_der_sigmoid():
    # param:起点,终点,间距
    x = np.arange(-10, 10, 0.2)
    y = der_sigmoid(x)  # 导数函数
    plt.plot(x, y)
    plt.grid()
    plt.show()


if __name__ == '__main__':
    plot_der_sigmoid()
特点
Sigmoid函数是二分类算法,尤其是逻辑回归中算法中的常用激活函数;也可以作为较少层数的神经网络的激活函数。
它主要是有下面几个特点:
- 能够将自变量∈的值全部缩放到(0,1)之间。
- 当X无穷大的时候,函数值趋于1;X无穷小的时候,趋于0。相当于对输入进行了归一化操作。
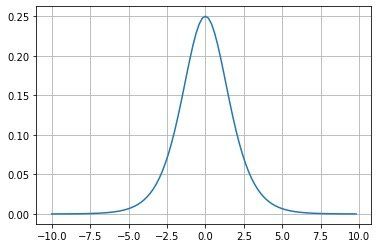
- 该函数是一个连续可导的函数;通过导数函数的图像能够观察到:0点时候,导函数的值最大,并且两边逐渐减小
缺陷
- 从导数函数的图像中观察到,X在正无穷大或者负无穷小的时候,导数(梯度)为0,即出现了梯度弥散现象;
- 导数的值在(0,0.25)之间;在多层神经网络中,我们需要对输出层到输入层逐层进行链式求导。这样就导致多个0到0.25之间的小数相乘,造成了结果取0,造成了梯度消失。
- Sigmod函数存在幂运算,计算复杂度大,训练时间长。
下面解释下Sigmoid最为致命的缺点(参考一位网友的回答,解释很全面)
对于Sigmoid激活函数最致命的缺点就是容易发生梯度弥散(Gradient vanishing)现象(当然也可能会发生梯度爆炸Exploding gradient,前面层的梯度通过模型训练变的很大,由于反向传播中链式法则的原因,导致后面层的梯度值会以指数级增大。 但是在Sigmoid激活函数中梯度保障发生的概率非常小),所谓梯度弥散故名思议就是梯度值越来越小。
在深度学习中,梯度更新是从后向前更新的,这也就是所谓的反向传播(Backpropagation algorithm),而反向传播的核心是链式法则。如果使用Sigmoid激活函数,训练的网络比较浅还比较好,但是一旦训练较深的神经网络,会导致每次传过来的梯度都会乘上小于1的值,多经过几层之后,梯度就会变得非常非常小(逐渐接近于0),因此梯度消失了,对应的参数得不到更新。
参考:https://zhuanlan.zhihu.com/p/104318223
现在神经网络中很少使用Sigmoid作为激活函数。
tanh函数
tanh 是一个双曲正切函数。tanh 函数和 sigmoid 函数的曲线相似。
该函数是一个奇函数,经过原点且严格单调递增。函数取值分布在(-1,1)之间。
原函数
下面是原函数的具体表达形式,我们还发现tanh函数和sigmoid函数的关系:
tanh x = sinh x cosh x = e x − e − x e x + e − x = 1 − e − 2 x 1 + e − 2 x = 2 ∗ S i g m o i d ( 2 ∗ x ) − 1 \tanh x=\frac{\sinh x}{\cosh x}=\frac{e^x-e^{-x}}{e^x+e^{-x}}=\frac{1-e^{-2x}}{1+e^{-2x}}=2*Sigmoid(2*x)-1 tanhx=coshxsinhx=ex+e−xex−e−x=1+e−2x1−e−2x=2∗Sigmoid(2∗x)−1
import math
import matplotlib.pyplot as plt
import numpy as np
import matplotlib as mpl


def tanh(x):
    return (np.exp(x) - np.exp(-x)) / (np.exp(x) + np.exp(-x))

fig = plt.figure(figsize=(12, 8))
ax = fig.add_subplot(111)

x = np.linspace(-10, 10)
y = tanh(x)

ax.spines['top'].set_color('none')
ax.spines['right'].set_color('none')

ax.xaxis.set_ticks_position('bottom')
ax.spines['bottom'].set_position(('data', 0))
ax.set_xticks([-10, -5, 0, 5, 10])
ax.yaxis.set_ticks_position('left')
ax.spines['left'].set_position(('data', 0))
ax.set_yticks([-1, -0.5, 0.5, 1])

plt.plot(x, y, label="Tanh", color="red")
plt.legend()
plt.grid()
plt.show()
导函数
下面是具体的求导过程:
f ( x ) = tanh ( x ) = e x − e − x e x + e − x f(x)=\tanh (x)=\frac{e^x-e^{-x}}{e^x+e^{-x}} f(x)=tanh(x)=ex+e−xex−e−x
首先公布结果,导数函数为:
f ( x ) ′ = 1 − ( tanh ( x ) ) 2 f(x)^{\prime}=1-(\tanh (x))^2 f(x)′=1−(tanh(x))2
下面是具体过程:
步骤1、在除法的求导公式中有:
( μ ν ) ′ = μ ′ ν − μ ν ′ ν 2 \left(\frac{\mu}{\nu}\right)^{\prime}=\frac{\mu^{\prime} \nu-\mu \nu^{\prime}}{\nu^2} (νμ)′=ν2μ′ν−μν′
步骤2、定义两个中间变量:
a = e x a=e^x a=ex
b = e − x b=e^{-x} b=e−x
步骤3、第一次求导
( e x − e − x e x + e − x ) ′ = ( a − b a + b ) ′ = ( a − b ) ′ × ( a + b ) − ( a − b ) × ( a + b ) ′ ( a + b ) 2 \left(\frac{e^x-e^{-x}}{e^x+e^{-x}}\right)^{\prime}=\left(\frac{a-b}{a+b}\right)^{\prime}=\frac{(a-b)^{\prime} \times(a+b)-(a-b) \times(a+b)^{\prime}}{(a+b)^2} (ex+e−xex−e−x)′=(a+ba−b)′=(a+b)2(a−b)′×(a+b)−(a−b)×(a+b)′
步骤4、其中有
( a − b ) ′ = ( e x − e − x ) = e x − ( − 1 ) × e − x = e x + e − x (a-b)^{\prime}=\left(e^x-e^{-x}\right)=e^x-(-1) \times e^{-x}=e^x+e^{-x} (a−b)′=(ex−e−x)=ex−(−1)×e−x=ex+e−x
( a + b ) ′ = ( e x + e − x ) = e x + ( − 1 ) × e − x = e x − e − x (a+b)^{\prime}=\left(e^x+e^{-x}\right)=e^x+(-1) \times e^{-x}=e^x-e^{-x} (a+b)′=(ex+e−x)=ex+(−1)×e−x=ex−e−x
步骤5、将a+b和a-b进行整理:
( a − b ) ′ = e x + e − x = a + b (a-b)^{\prime}=e^{x} + e^{-x} = a+b (a−b)′=ex+e−x=a+b
( a + b ) ′ = e x − e − x = a − b (a+b)^{\prime}=e^{x} - e^{-x} = a-b (a+b)′=ex−e−x=a−b
步骤6、化简上面的结果
( a − b ) ′ × ( a + b ) − ( a − b ) × ( a + b ) ′ ( a + b ) 2 = ( a + b ) 2 − ( a − b ) 2 ( a + b ) 2 = 1 − ( a − b ) 2 ( a + b ) 2 = 1 − ( e x − e − x e x + e − x ) 2 = 1 − tanh ( x ) 2 \begin{array}{l} \frac{(a-b)^{\prime} \times(a+b)-(a-b) \times(a+b)^{\prime}}{(a+b)^2} \\ =\frac{(a+b)^2-(a-b)^2}{(a+b)^2} \\ =1-\frac{(a-b)^2}{(a+b)^2} \\ =1-\left(\frac{e^x-e^{-x}}{e^x+e^{-x}}\right)^2 \\ =1-\operatorname{tanh}(x)^2 \end{array} (a+b)2(a−b)′×(a+b)−(a−b)×(a+b)′=(a+b)2(a+b)2−(a−b)2=1−(a+b)2(a−b)2=1−(ex+e−xex−e−x)2=1−tanh(x)2
# 绘制图

import math
import matplotlib.pyplot as plt
import numpy as np
import matplotlib as mpl


def der_tanh(x):
    """
    tanh(x)函数的导数求解
    """
    tanh = (np.exp(x) - np.exp(-x)) / (np.exp(x) + np.exp(-x))

    return 1-tanh ** 2

fig = plt.figure(figsize=(12, 8))
ax = fig.add_subplot(111)

x = np.linspace(-10, 10)
y = der_tanh(x)

ax.spines['top'].set_color('none')
ax.spines['right'].set_color('none')

ax.xaxis.set_ticks_position('bottom')
ax.spines['bottom'].set_position(('data', 0))
ax.set_xticks([-10, -5, 0, 5, 10])
ax.yaxis.set_ticks_position('left')
ax.spines['left'].set_position(('data', 0))
ax.set_yticks([-1, -0.5, 0.5, 1])

plt.plot(x, y, label="der_tanh", color="red")
plt.legend()
plt.grid()
plt.show()
特点
- Tanh函数输出满足0均值;
- 当输入较大或者较小时,输出的值变化很小,导致导函数几乎为0,也就是梯度很小,从而不利于W、b的值更新(二者的更新都和梯度有关)。
- 梯度(导数)的取值在(0,1]之间,最大梯度为1,能够保证梯度在变化过程中不削减,缓解了Sigmoid函数梯度消失的问题;但是取值过大或者过小,仍存在梯度消失
- 同样地函数本身存在幂运算,计算力度大
Sigmoid和Tanh关系
# encoding:utf-8

import math
import matplotlib.pyplot as plt
import numpy as np
import matplotlib as mpl
mpl.rcParams['axes.unicode_minus']=False

def  sigmoid(x):
    return 1.0 / (1.0 + np.exp(-x))

fig = plt.figure(figsize=(10,6))
ax = fig.add_subplot(111)

x = np.linspace(-10, 10)

# sigmoid函数
y = sigmoid(x)
# tanh函数
tanh = 2*sigmoid(2*x) - 1

plt.xlim(-11,11)
plt.ylim(-1.1,1.1)

ax.spines['top'].set_color('none')
ax.spines['right'].set_color('none')

ax.xaxis.set_ticks_position('bottom')
ax.spines['bottom'].set_position(('data',0))
ax.set_xticks([-10,-5,0,5,10])
ax.yaxis.set_ticks_position('left')
ax.spines['left'].set_position(('data',0))
ax.set_yticks([-1,-0.5,0.5,1])

plt.plot(x,y,label="Sigmoid",color = "blue")
# tanh函数这里是2*x
plt.plot(2*x,tanh,label="Tanh", color = "red")
plt.legend()
plt.grid()
plt.show()
在一般的二分类问题中,Sigmoid函数一般用输出层,而tanh函数一般用于隐藏层(非固定,经验之谈)。
Relu函数
ReLu函数是目前深度学习中比较流行的一种激活函数。
原函数
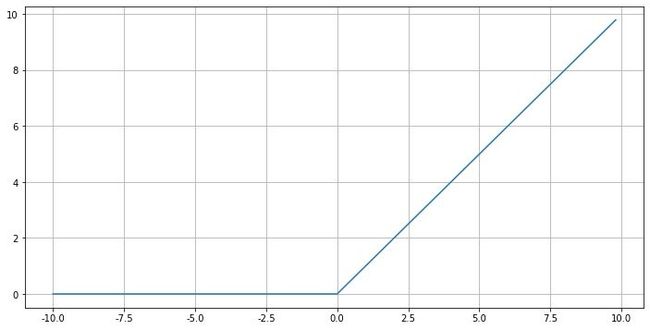
ReLU函数, 也称之为线性整流函数(Rectified Linear Unit), 是神经网络结构中常用的非线性激活函数。下面是简写形式:
f ( x ) = m a x ( x , 0 ) f(x)=max(x,0) f(x)=max(x,0)
下面是完整的表达式:
ReLU ( x ) = { 0 , x ⩽ 0 x , x > 0 \operatorname{ReLU}(x)=\left\{\begin{array}{ll} 0, & x \leqslant 0 \\ x, & x>0 \end{array}\right. ReLU(x)={0,x,x⩽0x>0
# import tensorflow as tf

import matplotlib.pyplot as plt
import numpy as np
import pandas as pd
%matplotlib inline


def relu(x):
    """
    返回Relu函数
    """
    # 不能直接使用max函数,报错
    return np.maximum(0, x)


def plot_relu():
    # param:起点,终点,间距
    plt.figure(figsize=(12,6))
    x = np.arange(-10, 10, 0.2)
    y = relu(x)  # 导数函数
    plt.plot(x, y)
    plt.grid()
    plt.show()


if __name__ == '__main__':
    plot_relu()
导数函数
y ′ = f ′ ( x ) = { 1 , x > 0 0 , x ≤ 0 y^{\prime}=f^{\prime}(x)=\left\{\begin{array}{ll} 1, & x>0 \\ 0, & x \leq 0 \end{array}\right. y′=f′(x)={1,0,x>0x≤0
# import tensorflow as tf

import matplotlib.pyplot as plt
import numpy as np
import pandas as pd
%matplotlib inline


def der_relu(x):
    """
    返回Relu导数函数
    """
    # 重点:通过numpy的where函数进行判断
    return np.where(x>0,1,0)


def plot_der_relu():
    # param:起点,终点,间距
    plt.figure(figsize=(12,6))
    x = np.arange(-10, 10, 0.2)
    y = der_relu(x)  # 导数函数
    plt.plot(x, y)
    plt.grid()
    plt.show()


if __name__ == '__main__':
    plot_der_relu()
特点
- 函数本身在输入大于为0的时候,输出逐渐增加,这样梯度值也一直存在,从而避免了梯度的饱和:正区间解决梯度消失问题
- 函数本身是线性函数,比Sigmoid或者Tanh函数要计算速度快;同时函数的收敛速度要大于Sigmoid或者Tanh函数
- 函数的输出不是以0为均值,收敛慢
- Dead Relu问题:在负输入部分,输入的值为0,从而梯度为0,导致参数无法更新,造成神经元死亡;在实际处理中,我们可以减少过多的负数特征进入网络
Leaky ReLu 函数
Leaky ReLu 函数是为了解决Relu函数负区间的取值为0而产生的。
- 左:ReLu
- 右:Leaky ReLu
原函数
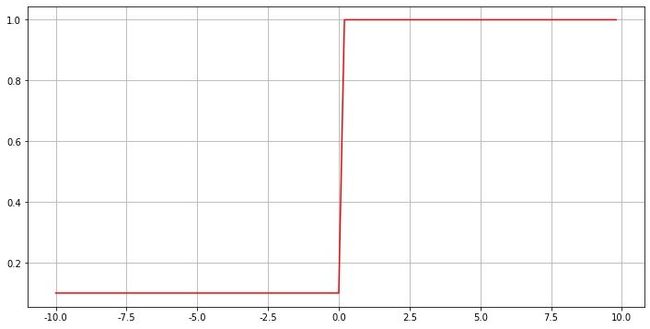
在小于0的部分引入了一个斜率,使得小于0的部分取值不再全部是0(通常 a 的值为 0.01 左右)
y = f ( x ) = { x , x > 0 a ⋅ x , x ≤ 0 y=f(x)=\left\{\begin{array}{ll} x, & x>0 \\ a \cdot x, & x \leq 0 \end{array}\right. y=f(x)={x,a⋅x,x>0x≤0
# import tensorflow as tf

import matplotlib.pyplot as plt
import numpy as np
import pandas as pd
%matplotlib inline


def leaky_relu(x):
    """
    返回Leaky Relu函数图像
    """
    a = 0.01  # 斜率a的取值
    return np.maximum(a * x, x)  # 通过np.maximum函数实现


def plot_Leaky_relu():
    # param:起点,终点,间距
    plt.figure(figsize=(12,6))
    x = np.arange(-10, 10, 0.2)
    y = leaky_relu(x)  # 导数函数
    plt.plot(x, y, color="red")
    plt.grid()
    plt.show()


if __name__ == '__main__':
    plot_Leaky_relu()
导数函数
y ‘ = f ‘ ( x ) = { 1 , x > 0 a , x ≤ 0 y`=f`(x)=\left\{\begin{array}{ll} 1, & x>0 \\ a, & x \leq 0 \end{array}\right. y‘=f‘(x)={1,a,x>0x≤0
# import tensorflow as tf

import matplotlib.pyplot as plt
import numpy as np
import pandas as pd
%matplotlib inline


def der_leaky_relu(x):
    """
    返回Leaky Relu函数图像
    """
    # 斜率a的取值
    a = 0.1
    # 通过where判断来取值
    return np.where(x>0,1,a)


def plot_Leaky_relu():
    # param:起点,终点,间距
    plt.figure(figsize=(12,6))
    x = np.arange(-10, 10, 0.2)
    y = der_leaky_relu(x)  # 导数函数
    plt.plot(x, y, color = "red")
    plt.grid()
    plt.show()


if __name__ == '__main__':
    plot_Leaky_relu()
特点
- 具有和ReLu完全相同的特点,而且不会造成Dead ReLu问题
- 函数本身的取值在负无穷到正无穷;负区间梯度也存在,从而避免了梯度消失。
- 但是实际运用中,尚未完全证明 Leaky ReLU 总是比 ReLU 更好。


