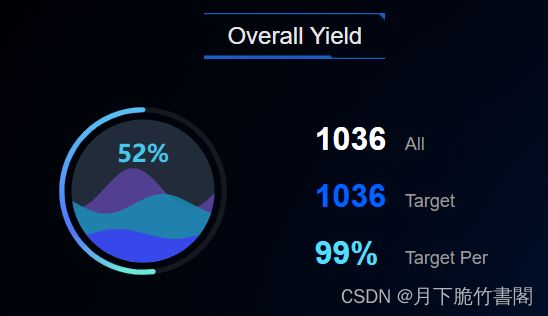
Echarts之球形水波纹
球形水波纹是比较与饼图展现方式 更灵动 更高级的一种
echarts-liquidfill 水球图插件官网: https://www.npmjs.com/package/echarts-liquidfill
1.展示图:【左侧即为水波图,右侧是想要展示的信息列】

2.实现过程
①、 需要下载echarts及liquidfill 插件
安装命令:
npm install echarts
npm install echarts-liquidfill
以下为我的版本号:
"echarts": "^4.1.0",
"echarts-liquidfill": "^2.0.2",
注意:【echarts-liquidfill@3兼容echarts@5、 echarts-liquidfill@2兼容echarts@4】
②、引用
import * as echarts from 'echarts';
import 'echarts-liquidfill'
③、代码
<template>
	<div class="pie-overall-yield-container">
		<div class="content-title">Overall Yield</div>
		<div id="pie-overall-yield" class="chart"></div>
		<div class="nums-overall-yield">
			<div class="nums">
				<span class="num white">1036</span>
				<span class="type">All</span>
			</div>
			<div class="nums">
				<span class="num blue">1036</span>
				<span class="type">Target</span>
			</div>
			<div class="nums">
				<span class="num turquoise">99%</span>
				<span class="type">Target Per</span>
			</div>
		</div>
	</div>
</template>

<script>
import * as echarts from "echarts";
import "echarts-liquidfill";
export default {
	name: "PieOverallYield",
	props: {
		completeList: Array,
		productionList: Array,
	},
	watch: {
	},
	data() {
		return {
			nums: [
				{ num: 1036, type: "All" },
				{ num: 1036, type: "Target" },
				{ num: "99%", type: "Target Per" },
			],
		};
	},
	methods: {
		// OverallYield 饼图
		pieChart(id) {
			const value = 0.52;
			let count = echarts.init(document.getElementById(id));
			let option = {
				title: {
					// 标题
					text: (value * 100).toFixed(0) + "%",
					textStyle: {
						// 标题的样式
						color: "#47c7ec", // 字体颜色
						fontFamily: "Microsoft YaHei", // 字体
						fontSize: 24,
						fontWeight: "bold",
						align: "center", // 文字的水平方式
						baseline: "middle",
						position: "inside",
						verticalAlign: "middle", // 文字的垂直方式
					},
					left: "center", // 定位
					top: "30%",
				},
				polar: {
					radius: ["65%", "60%"],
					center: ["50%", "50%"],
				},
				angleAxis: {
					max: 100,
					clockwise: false,
					axisLine: {
						show: false,
					},
					axisTick: {
						show: false,
					},
					axisLabel: {
						show: false,
					},
					splitLine: {
						show: false,
					},
				},
				radiusAxis: {
					type: "category",
					show: true,
					axisLabel: {
						show: false,
					},
					axisLine: {
						show: false,
					},
					axisTick: {
						show: false,
					},
				},
				series: [
					{
						type: "liquidFill",//定义类型
						radius: "55%",
						waveAnimation: true,
						z: 1,
						data: [
							{
								value: 0.52,
								direction: "left",//移动方向
								amplitude: 20, // 水波纹的振幅
								itemStyle: {//一个波浪设置透明度
									normal: {
										color: "#58419a",
									},
								},
								// 悬浮后的样式
								emphasis: {
									itemStyle: {
										opacity: 0.9,
									},
								},
							},
							{
								value: 0.41,
								direction: "right",
								amplitude: 10, // 水波纹的振幅
								itemStyle: {
									normal: {
										color: "#1b87b1",
									},
								},
								// 悬浮后的样式
								emphasis: {
									itemStyle: {
										opacity: 0.9,
									},
								},
							},
							{
								value: 0.2,
								direction: "left",
								amplitude: 5, // 水波纹的振幅
								itemStyle: {
									normal: {
										color: "#3a41ef",
									},
								},
								// 悬浮后的样式
								emphasis: {
									itemStyle: {
										opacity: 0.9,
									},
								},
							},
						],
						// 改变水球图的形状,比如 'circle', 'rect', 'roundRect', 'triangle', 'diamond', 'pin', 'arrow'(默认为circle)
						shape: 'circle'
						//水球图边框属性设定
						outline: {
							show: true,
							borderDistance: 0, // 设置和外层轮廓的间距
							itemStyle: {
							    borderWidth: 0, // 设置外层边框宽度
	                           // borderColor: 'red', // 设置外层边框颜色
	                          //  shadowBlur: 'none' // 消除外层边框阴影
							},
						},
						itemStyle: {
							opacity: 0.9, // 波浪的透明度
							shadowBlur: 0, // 波浪的阴影范围
						},
						backgroundStyle: {
	                      //  borderWidth: 4, // 修改背景边框宽度
	                      //  borderColor: 'green' // 修改背景边框的颜色
							color: "#212b3a", // 图表的背景颜色
						},
						label: {
							// 数据展示样式
							show: false,
							color: "#000",
							insideColor: "#fff",
							fontSize: 24,
							fontWeight: 400,
							align: "center",
							baseline: "middle",
							position: "inside",
						},
					},
					{
						name: "",
						type: "bar",
						roundCap: true,
						z: 2,
						showBackground: true,
						backgroundStyle: {
							color: "#15181e",
						},
						data: [52],
						coordinateSystem: "polar",
						itemStyle: {
							normal: {
								color: new echarts.graphic.LinearGradient(0, 0, 0.5, 1, [
									{
										offset: 0,
										color: "#5acef2",
									},
									{
										offset: 0.7,
										color: "#5073fb",
									},
									{
										offset: 1,
										color: "#6ae8d8",
									},
								]),
							},
						},
					},
				],
			};
			count.setOption(option);
			window.addEventListener("resize", () => {
				if (count) {
					count.resize(); // 不报错
				}
			});
		},
	},
	mounted() {
		this.pieChart("pie-overall-yield");
	},
};
</script>

<style scoped lang="scss">
.pie-overall-yield-container {
	width: 100%;
	height: 100%;
	.content-title {
		height: 0.5rem;
		background: url("../../../assets/images/smtMonitor/sip/overall-title.png") no-repeat center;
		background-size: 30%;
		color: #e8e7e7;
		text-align: center;
		line-height: 0.5rem;
		font-size: 0.24rem;
		font-weight: 350;
		letter-spacing: 0em;
	}
	.chart {
		width: 50%;
		height: calc(100% - 20px);
		float: left;
	}
	.nums-overall-yield {
		display: inline-block;
		width: 50%;
		height: calc(100% - 20px);
		padding: 0.4rem 0;
		.nums {
			margin: 0.2rem 0.2rem 0;
			.num {
				font-size: 0.32rem;
				display: inline-block;
				margin-right: 0.1rem;
				width: 0.8rem;
				font-weight: bold;
			}
			.type {
				color: #9b9a9a;
				font-size: 0.18rem;
			}
			.white {
				color: #fff;
			}
			.blue {
				color: #0063ff;
			}
			.turquoise {
				color: #54defe;
			}
		}
	}
}
</style>