Python机器学习笔记之降维
文章目录
- 前言
- 算法
- PCA-鸢尾花数据集降维
- NMF、PCA-人脸图像特征提取
- 总结
前言
对中国大学MOOC-北京理工大学-“Python机器学习应用”上的实例进行分析和修改:记录一些算法、函数的使用方法;对编程思路进行补充;对代码中存在的问题进行修改。
课程中所用到的数据
算法
1、PCA-主成分分析
from sklearn.decomposition import PCA
pca = PCA(n_components)#创建实例,n_components主成分个数/降维后的维度;svd_solver特征值分解方法。
#按行存储数据data
data_reduced = pca.fit_transform(data)#降维计算(fit);按行返回降维后的数据(transform)。
2、NMF-非负矩阵分解
from sklearn.decomposition import NMF
nmf = NMF(n_components,init,tol)#创建实例,n_components主成分个数/降维后的维度;init初始化方法;tol最小迭代差值。
#按行存储数据data
data_reduced = pca.fit_transform(data)#降维计算(fit);按行返回降维后的数据(transform)。
PCA-鸢尾花数据集降维
1、引入库
import matplotlib.pyplot as plt
from sklearn.decomposition import PCA
from sklearn.datasets import load_iris#加载鸢尾花数据集
2、加载数据
(1)load_iris(return_X_y=False)加载鸢尾花数据集,为False时以字典形式返回data、target;为True时返回(data,target)。
data = load_iris()
x, y = data.data, data.target#返回数据、标签
3、训练
(1)plt.scatter(x, y, c,marker):绘制散点图,x,y数据;c颜色;marker样式。
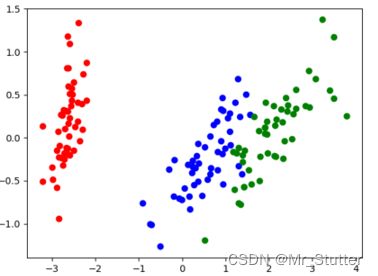
pca = PCA(n_components=2)#降为2维
xr = pca.fit_transform(x)#返回降维后的数据
red_x, red_y = [], []#_x,_y存取两个维度的数据
blue_x, blue_y = [], []
green_x, green_y = [], []
for i in range(len(xr)):#逐行存取
    if y[i] == 0:#存取标签为0的数据
        red_x.append(xr[i][0])
        red_y.append(xr[i][1])
    elif y[i] == 1:
        blue_x.append(xr[i][0])
        blue_y.append(xr[i][1])
    else:
        green_x.append(xr[i][0])
        green_y.append(xr[i][1])
plt.scatter(red_x, red_y, c='r')#绘制散点图
plt.scatter(blue_x, blue_y, c='b')
plt.scatter(green_x, green_y, c='g')
plt.show()
NMF、PCA-人脸图像特征提取
1、引入库
import matplotlib.pyplot as plt
from sklearn.decomposition import PCA
from sklearn.decomposition import NMF
from numpy.random import RandomState#随机数函数
from sklearn.datasets import fetch_olivetti_faces#人脸数据集
import sklearn.datasets
2、加载数据
(1)fetch_olivetti_faces():加载人脸数据集。
(2)plt.figure(num=None, figsize=None):建立作图区域,num图像编号; figsize图像宽高。
(3)plt.suptitle(t, size):设置标题t;size大小。
(4)enumerate:遍历,第一个返回值为序号;第二个返回值为元素。
(5)plt.subplot(nrows, ncols, index):划分子区域,nrows行数, ncols列数, index序号。
(6)plt.imshow((img,cmap,interpolation, vmin, vmax):显示热度图,img图片;cmap图谱;interpolation插值;vmin、vmax范围。
(7)plt.xticks(list):设置坐标轴刻度范围。
(8)plt.subplots_adjust( left=None, bottom=None, right=None, top=None):调整与边框的距离。
n_row, n_col = 2, 3#显示列数与行数
n_components = n_row*n_col#特征数
image_shape = (64, 64)#图像大小
dataset = fetch_olivetti_faces(shuffle=True,random_state=RandomState(0))#打乱样本,随机选取
data = dataset.data#保存数据
#展示图片
def Show(title, images, n_col=n_col, n_row=n_row):
    plt.figure(figsize=(2*n_col, 2.26*n_row))#设置总区域尺寸
    plt.suptitle(title, size=16)#设置标题
    for i, comp in enumerate(images):#返回(序号,元素)
        plt.subplot(n_row, n_col, i+1)#划分子区域
        vmax = max(comp.max(),-comp.min())#最大像素值
        plt.imshow(comp.reshape(image_shape), cmap=plt.cm.gray,
                   interpolation='nearest', vmin=-vmax, vmax=vmax)#绘制热度图
        plt.xticks(())#隐藏坐标轴
        plt.yticks(())
    plt.subplots_adjust(0.01, 0.05, 0.99, 0.93, 0.04, 0)#调整位置
3、训练
(1)pca.components_、nmf.components_:主成分。
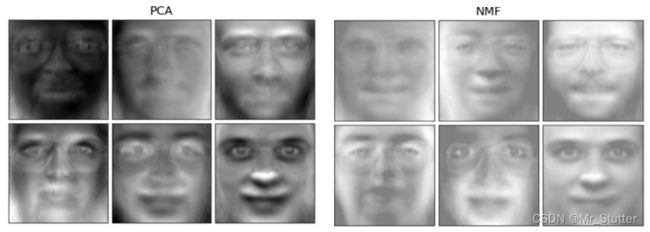
estimators = [('PCA',PCA(n_components=6,whiten=True)),
              ('NMF',NMF(n_components=6,init='nndsvda',tol=5e-3))]#建立两种降维算法
for name,estimator in estimators:
    estimator.fit(data)
    images = estimator.components_#400张脸的主成分/共同特征,W:4096*6。
    #feature = estimator.transform(data)#各张脸在6个维度上的强度,H:6*400。
    Show(name, images)
plt.show()
总结
降维可用于对高维数据集的探索与可视化,作为其他任务的数据预处理部分。代码部分,真正涉及机器学习的部分较短,主要是对数据的提取、转化,以及最后结果评价与可视化作图。

