【空间分析】空间自相关指数Python实现与栗子
title: 计算莫兰指数和Geary’s C 空间自相关程度
date: 2022-10-06 12:32:32
tags: 空间分析
categories: 不想学辣
cover: https://w.wallhaven.cc/full/e7/wallhaven-e7ek7k.jpg
计算莫兰指数和Geary’s C 空间自相关程度
卷积核类型
常见的卷积核为Rook,Bishop,Queen,如上图所示。
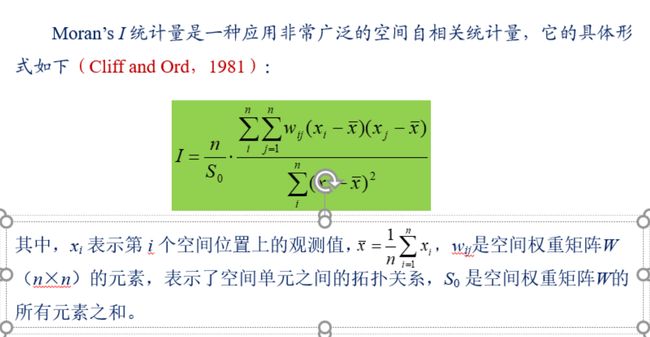
Molan’s I
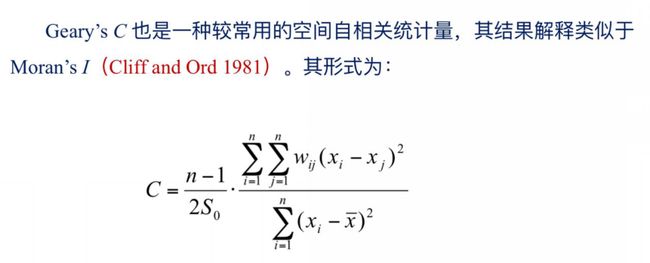
Geary’s C
代码实现为
# 利用空间统计量Moran和Geary计算遥感数据的自相关程度
import numpy as np
import pandas as pd

def getMoranV(path,t=0,method="Moran"):
    '''
    :param path: 图像路径
    :param t: 卷积核类型
    :param method: 空间自相关方法
    :return:
    '''
    # 读取数据
    wb1 = pd.read_excel(path, index_col=0)
    data = wb1.values
    n, m = wb1.shape

    # 定义卷积核

    # queen 卷积
    dir2 = [[1, 0], [-1, 0], [0, 1], [0, -1], [1, 1], [1, -1], [-1, 1], [-1, -1]]
    # Rook 卷积
    dir1 = [[1, 0], [0, 1], [-1, 0], [0, -1]]
    # Bishop 卷积
    dir3=[[1,1],[1,-1],[-1,1],[-1,-1]]

    if t==0:
        dir=dir1
    elif t==1:
        dir=dir2
    else:
        dir=dir3

    # 开辟O(n^4)权重矩阵
    # 这玩意很耗内存,所以可以考虑用局部计算代替全局计算
    a = [[0]*(n*m) for _ in range((n*m))]
    for i in range(n):
        for j in range(m):
            # 二维的点转到一维
            loc = i * m + j  # 一维上的坐标
            # 找到他在二维上的临界点
            for detX, detY in dir:
                x = i + detX
                y = j + detY
                # 转化为一维
                # 边界处理
                if 0 <= x < m and 0 <= y < m:
                    a[loc][x * m + y] = 1  # 表示临接

    def moranIndex(data,weight):
        # 莫兰指数计算
        s_0=np.sum(np.sum(weight))
        n,m=len(data),len(data[0])
        x_hat=np.mean(data)
        up_sum=0
        down_sum=0
        for i in range(n):
            for j in range(m):
                # 下一轮
                for x in range(n):
                    for y in range(m):
                        if not (val:=weight[i*m+j][x*m+y]):
                            continue
                        up_sum+=val*(data[i][j]-x_hat)*(data[x][y]-x_hat)
                down_sum+=(data[i][j]-x_hat)**2
        return (n*m/s_0)*(up_sum/down_sum)

    def Geary_C(data,weight):
        # Geary's C计算
        s_0=np.sum(np.sum(weight))*2
        n, m = len(data), len(data[0])
        x_hat = np.mean(data)
        up_sum = 0
        down_sum = 0
        for i in range(n):
            for j in range(m):
                # 下一轮
                for x in range(n):
                    for y in range(m):
                        if not (val := weight[i * m + j][x * m + y]):
                            continue
                        up_sum += val * (data[i][j] - data[x][y])**2
                down_sum += (data[i][j] - x_hat) ** 2
        return ((n*m-1)/(s_0))*(up_sum/down_sum)

    if (M:=method.upper())=="MORAN":
        return moranIndex(data,a)
    elif M=="GEARY":
        return Geary_C(data,a)

def getHelp():
    print("Method: {'Moran','Geary'}")
    print("t: {0:Rook,1:Queen,2:bishop}")

if __name__ == '__main__':
    getHelp()
    path = r"data.xlsx"
    print("墨兰指数为: %s"%getMoranV(path,0))
    print("Geary's C为: %s"%getMoranV(path,0,"Geary"))
输出结果为
Method: {'Moran','Geary'}
t: {0:Rook,1:Queen,2:bishop}
墨兰指数为: 0.5579039646993681
Geary's C为: 0.4355131948652942
优化
我们发现,这样子需要开辟 n 4 n^4 n4大小的权重矩阵,且需要 O ( 4 n 2 + n 4 ) O(4n^2+n^4) O(4n2+n4)也就是 O ( n 4 ) O(n^4) O(n4)的时间复杂度,那能不能对其做一些剪枝,降低复杂度呢?
我们可以动态开辟空间权重矩阵,从而将空间复杂度降低到 O ( M ∗ n 2 ) O(M*n^2) O(M∗n2),其中, M M M表示卷积核的有效大小。(非空洞大小)
这样子也能将时间复杂度降低为 O ( M ∗ n 2 ) O(M*n^2) O(M∗n2) ,也就是 O ( n 2 ) O(n^2) O(n2)级别。
# 利用空间统计量Moran和Geary计算遥感数据的自相关程度
import numpy as np
import pandas as pd

def getMoranV(path,val=1,t=0,method="Moran"):
    '''
    :param path: 图像路径
    :param t: 卷积核类型
    :param method: 空间自相关方法
    :param val: 空间权重
    :return:
    '''
    # 读取数据
    wb1 = pd.read_excel(path, index_col=0)
    data = wb1.values
    n, m = wb1.shape

    # 定义卷积核

    # queen 卷积
    dir2 = [[1, 0], [-1, 0], [0, 1], [0, -1], [1, 1], [1, -1], [-1, 1], [-1, -1]]
    # Rook 卷积
    dir1 = [[1, 0], [0, 1], [-1, 0], [0, -1]]
    # Bishop 卷积
    dir3=[[1,1],[1,-1],[-1,1],[-1,-1]]

    if t==0:
        dir=dir1
    elif t==1:
        dir=dir2
    else:
        dir=dir3

    # 开辟O(n^4)权重矩阵
    # 这玩意很耗内存,所以可以考虑用局部计算代替全局计算
    a = [[] for _ in range(n*m)]
    a_weight=0
    for i in range(n):
        for j in range(m):
            # 找到他在二维上的临界点
            loc=i*m+j
            for detX, detY in dir:
                x = i + detX
                y = j + detY
                # 转化为一维
                # 边界处理
                if 0 <= x < n and 0 <= y < m:
                    a[loc].append([x,y,val])
                    a_weight+=val

    def moranIndex(data,weight):
        # 莫兰指数计算
        # s_0=np.sum(np.sum(weight))
        s_0=a_weight
        n,m=len(data),len(data[0])
        x_hat=np.mean(data)
        up_sum=0
        down_sum=0
        for i in range(n):
            for j in range(m):
                # 下一轮
                loc=i*m+j
                for v in weight[loc]:
                    up_sum+=v[2]*(data[i][j]-x_hat)*(data[v[0]][v[1]]-x_hat)
                down_sum+=(data[i][j]-x_hat)**2
        return (n*m/s_0)*(up_sum/down_sum)

    def Geary_C(data,weight):
        # Geary's C计算
        s_0=a_weight*2
        n, m = len(data), len(data[0])
        x_hat = np.mean(data)
        up_sum = 0
        down_sum = 0
        for i in range(n):
            for j in range(m):
                # 下一轮
                loc = i * m + j
                for v in weight[loc]:

                    up_sum += v[2] * (data[i][j] - data[v[0]][v[1]])**2
                down_sum += (data[i][j] - x_hat) ** 2
        return ((n*m-1)/(s_0))*(up_sum/down_sum)

    if (M:=method.upper())=="MORAN":
        return moranIndex(data,a)
    elif M=="GEARY":
        return Geary_C(data,a)

def getHelp():
    print("Method: {'Moran','Geary'}")
    print("t: {0:Rook,1:Queen,2:bishop}")

if __name__ == '__main__':
    getHelp()
    path = r"\data.xlsx"
    print("墨兰指数为: %s"%getMoranV(path,val=1,t=0))
    print("Geary's C为: %s"%getMoranV(path,val=1,t=0,method="Geary"))
栗子----海洋表面温度(SST)逐月计算空间自相关变化情况
数据
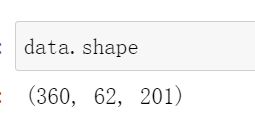
dim0表示时间维度,dim1表示维度,dim2表示经度
我们需要对数据进行处理,此时并不是excel数据,直接转为DataFrame,并在API中修改:
wb1 = path.read_excel(path)
为
wb1=path
处理
逐月遍历数据即可
List=[]
for i in range(data.shape[0]):
    List.append(getMoranV(pd.DataFrame(data[i]),val=1,t=1))
结果可视化
plt.figure(figsize=(20,6))
plt.plot(range((v:=data.shape[0])),List,'r-')
Mean=sum(List)/(len(List))
plt.plot(range(v),[Mean]*v,'b',linestyle='--',alpha=0.2)
plt.title("基于Queen邻接的SST空间自相关月变化")
plt.ylabel("时间")
plt.xlabel("日期")
T=[]
M,Y=1,1990
for i in range(360):
    T.append("%s年%s月"%(Y,M))
    if M%12==0:
        M=1
        Y+=1
    else:
        M+=1
plt.xticks(range(360)[::20],T[::20])
plt.show()
绘制逐月动图
List=[[]]
t=0
while t<data.shape[0]:

    if len(List[-1])==12:
        List.append([])
    List[-1].append(getMoranV(pd.DataFrame(data[t]),val=1,t=1))
    t+=1
我们通过二维列表的方式对年份加以区分,这也是常见的手段。
# 逐年绘制
path=r"\yourpath"
timeList=[]
for i in range(len(List)):
    lis=List[i]
    plt.figure(figsize=(20,6))
    plt.plot(range(12),lis,'r-')
    Mean=sum(lis)/12
    plt.plot(range(12),[Mean]*12,'b',linestyle='--',alpha=0.2)
    plt.title("%s年"%(i+1990))
    plt.xticks(range(12),["%s月"%(m+1) for m in range(12)])
    plt.savefig((val:=path+"\\"+"%s.png"%i),dpi=200)
    timeList.append(val)
接着就是正常的绘制,我们需要将图像存储下来,并记录存储位置。
通过imageio模块制作动图。
IMG=[]
import os
import imageio
path=r"\yourpath"
lis=os.listdir(path)
for i in lis:
    if i.endswith(".png"):
        IMG.append(imageio.imread(path+"\\"+i))
imageio.mimsave(path+"\\"+"GIF1.gif",IMG,"GIF",duration=0.5)


