opencv c++ 图像直方图(24)
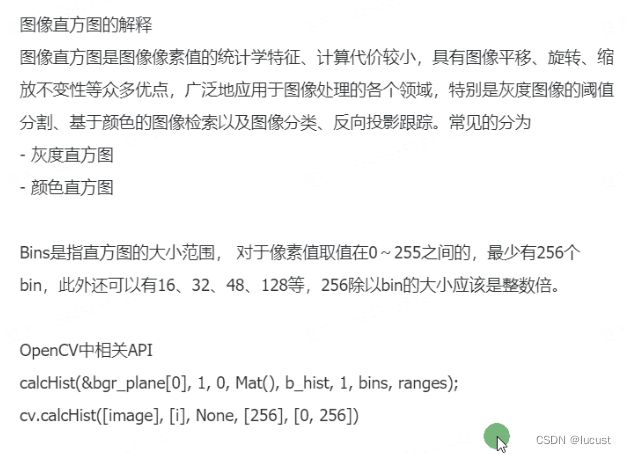
图像直方图:
对图像中各个像素点点值的统计(即对每段像素值计算其出现次数)。
在对图像进行平移、旋转、缩放等操作时,其直方图反馈不会变,故此直方图能广泛应用于图像处理各个领域。
Bins:
直方图的大小范围,像素取值范围0~255时,最少有256个bin,256除以bin的大小应是整数结果。
API
calcHist(const Mat * images, int nimages, const int * channels, InputArray mask, OutputArray hist, int dims, const int * histSize, const float ** ranges, bool uniform =true, bool accumulate =false)Parameters
images 输入图像Source arrays. They all should have the same depth, CV_8U, CV_16U or CV_32F , and the same size. Each of them can have an arbitrary number of channels. nimages 图像数量Number of source images. channels 通道数(输入为0时表示只有1个通道,如果有多个通道需要定义数组) mask 特定图像中需要绘制直方图的区域。 hist 输出Output histogram, which is a dense or sparse dims -dimensional array. dims 维度Histogram dimensionality that must be positive and not greater than CV_MAX_DIMS (equal to 32 in the current OpenCV version). histSize 对应维度里的直方图像素值尺寸Array of histogram sizes in each dimension. ranges 像素值范围 uniform Flag indicating whether the histogram is uniform or not (see above). accumulate Accumulation flag. If it is set, the histogram is not cleared in the beginning when it is allocated. This feature enables you to compute a single histogram from several sets of arrays, or to update the histogram in time.
代码:
void QuickDemo::histogram_demo(Mat& image)
{
	// 三通道分离
	std::vector bgr_plane;
	split(image, bgr_plane);
	// 定义参数变量
	const int channels[1] = { 0 };
	const int bins[1] = { 256 };
	float hranges[2] = { 0,255 };
	const float* ranges[1] = { hranges };
	Mat b_hist;
	Mat g_hist;
	Mat r_hist;
	// 计算Blue, Green, Red通道的直方图
	calcHist(&bgr_plane[0], 1, 0, Mat(), b_hist, 1, bins, ranges);
	calcHist(&bgr_plane[1], 1, 0, Mat(), g_hist, 1, bins, ranges);
	calcHist(&bgr_plane[2], 1, 0, Mat(), r_hist, 1, bins, ranges);

	// 显示直方图
	int hist_w = 512;
	int hist_h = 400;
	int bin_w = cvRound((double)hist_w / bins[0]);
	Mat histImage = Mat::zeros(hist_h, hist_w, CV_8UC3);
	// 归一化直方图数据
	normalize(b_hist, b_hist, 0, histImage.rows, NORM_MINMAX, -1, Mat());
	normalize(g_hist, g_hist, 0, histImage.rows, NORM_MINMAX, -1, Mat());
	normalize(r_hist, r_hist, 0, histImage.rows, NORM_MINMAX, -1, Mat());
	// 绘制直方图曲线
	for (int i = 1; i < bins[0]; i++) {
		line(histImage, Point(bin_w * (i - 1), hist_h - cvRound(b_hist.at(i - 1))),
			Point(bin_w * (i), hist_h - cvRound(b_hist.at(i))), Scalar(255, 0, 0), 2, 8, 0);
		line(histImage, Point(bin_w * (i - 1), hist_h - cvRound(g_hist.at(i - 1))),
			Point(bin_w * (i), hist_h - cvRound(g_hist.at(i))), Scalar(0, 255, 0), 2, 8, 0);
		line(histImage, Point(bin_w * (i - 1), hist_h - cvRound(r_hist.at(i - 1))),
			Point(bin_w * (i), hist_h - cvRound(r_hist.at(i))), Scalar(0, 0, 255), 2, 8, 0);
	}
	// 显示直方图
	namedWindow("Histogram Demo", WINDOW_AUTOSIZE);
	imshow("Histogram Demo", histImage);
}
结果:


