【python画图_决策树可视化、随机森林可视化(graphviz、pydotplus)】
有时候我们想更清晰的知道我们建立的决策树是怎样进行分裂的,这里跟大家分享一个决策树可视化的方法~
1、安装相关包(graphviz、pydotplus)
graphviz是一个专门绘制dot语言脚本描述的图形的软件,所以我们单纯的pip install graphviz 会报以下错误。

那么要怎么安装我们想要的包呢?
1)打开graphviz官网http://www.graphviz.org/download/,下载我们需要的版本软件包;

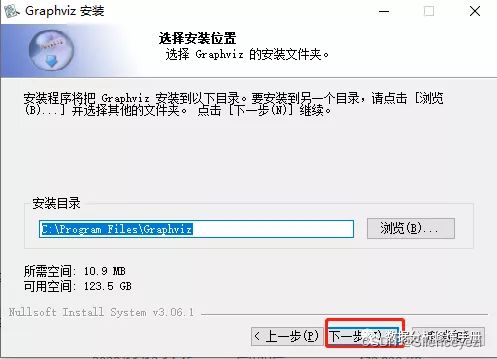
2)安装graphviz软件:双击我们下载的graphviz软件包,按照以下图片显示步骤进行安装;
3)点击图中的位置,输入下面语句,进行包的安装;
pip install graphviz
pip install pydotplus
4)重启电脑!
2、决策树可视化
1)生成pdf文件
################### 决策树的树形图
import numpy as np
import pandas as pd
from pandas import DataFrame as df
from sklearn.datasets import load_boston
from sklearn.datasets import load_breast_cancer
from matplotlib import pyplot as plt
import seaborn as sns
from sklearn.model_selection import train_test_split

# 提取数据
data = df(load_breast_cancer().data, columns=load_breast_cancer().feature_names)
data['target'] =  load_breast_cancer().target
data1 = data.iloc[:,-6:]
x_train, x_test, y_train, y_teest = train_test_split(data1.iloc[:,:-1], data1['target'], test_size=0.2, random_state=1)

# 建模
from sklearn.tree import DecisionTreeClassifier
DT = DecisionTreeClassifier(random_state=1, max_depth=4) # 深度设置为4
DT.fit(x_train, y_train)

# 决策树可视化
from sklearn import tree
import graphviz
import pydotplus
dot_data = tree.export_graphviz(DT, out_file=None,
                         feature_names=x_train.columns,
                         class_names=['0','1'],
                         filled=True, rounded=True,
                         special_characters=True)
graph = pydotplus.graph_from_dot_data(dot_data)
graph.write_pdf("DTtree.pdf")
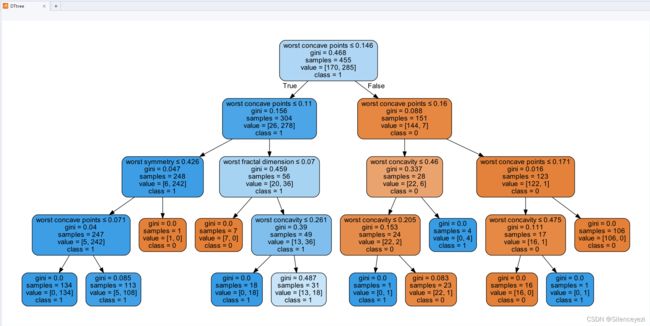
2)在IPython console中直接生成图片
from IPython.display import Image
dot_data = tree.export_graphviz(DT, out_file=None,
                         feature_names=x_train.columns,
                         class_names=['0','1'],
                         filled=True, rounded=True,
                         special_characters=True)
graph = pydotplus.graph_from_dot_data(dot_data)
Image(graph.create_png())
3、参数解读
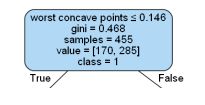
3)gini:当前节点的gini不纯度
这里节点分裂我们选择的是默认的gini,基尼指数(Gini不纯度):在样本集合中一个随机选中的样本被分错的概率,所以越小越好,当集合中所有样本为一个类时,基尼指数为0。
4)class:类别
5)分裂点


(哭了,没有搞懂样本数为啥差1,懂行的小伙伴不吝赐教啊。。)


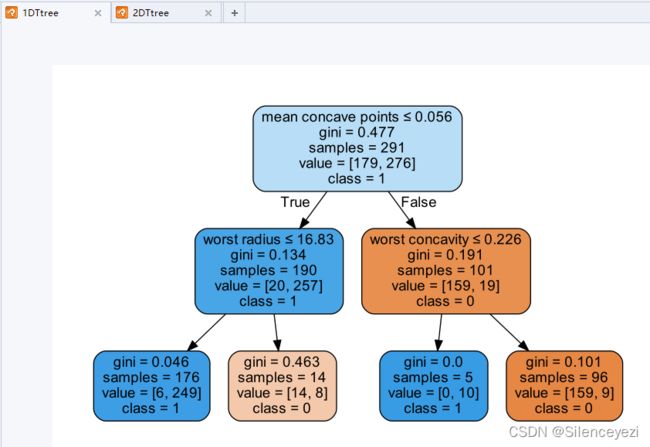
4、随机森林可视化
from sklearn.ensemble import RandomForestClassifier
rf = RandomForestClassifier(n_estimators=2, max_depth=2, random_state=1)
rf.fit(x_train, y_train)

# 随机森林画图
i=0
for per_rf in rf.estimators_:
    dot_data = tree.export_graphviz(per_rf, out_file=None,
                         feature_names=x_train.columns,
                         class_names=['0','1'],
                         filled=True, rounded=True,
                         special_characters=True)
    graph = pydotplus.graph_from_dot_data(dot_data)
    i = i+1
    graph.write_pdf(str(i)+"DTtree.pdf")
详细内容请看我公众号~
【python画图_决策树可视化】


