吴恩达 机器学习EX1学习笔记 MATLAB实现
前言
第一部分是关于线性回归
具体的概念其实在课程视频中都讲的比较清楚,但是在接触第一个练习之前,我一直不知道实际上如何coding,但是通过这种类似程序填空的形式能帮助我们理解这个实现。
单变量线性回归
1----读取数据并绘制图形
%% ======================= Part 2: Plotting =======================
fprintf('Plotting Data ...\n')
data = load('ex1data1.txt');
X = data(:, 1); y = data(:, 2);
m = length(y); % number of training examples

% Plot Data
% Note: You have to complete the code in plotData.m
plotData(X, y);
2-----计算COST FUNCTION----J(/theta)
%% =================== Part 3: Cost and Gradient descent ===================

X = [ones(m, 1), data(:,1)]; % Add a column of ones to x
theta = zeros(2, 1); % initialize fitting parameters

% Some gradient descent settings
iterations = 1500;
alpha = 0.01;

fprintf('\nTesting the cost function ...\n')
% compute and display initial cost
J = computeCost(X, y, theta);
fprintf('With theta = [0 ; 0]\nCost computed = %f\n', J);
fprintf('Expected cost value (approx) 32.07\n');

% further testing of the cost function
J = computeCost(X, y, [-1 ; 2]);
fprintf('\nWith theta = [-1 ; 2]\nCost computed = %f\n', J);
fprintf('Expected cost value (approx) 54.24\n');
具体的cost function的计算如下
function J = computeCost(X, y, theta)
%COMPUTECOST Compute cost for linear regression
%   J = COMPUTECOST(X, y, theta) computes the cost of using theta as the
%   parameter for linear regression to fit the data points in X and y

% Initialize some useful values
m = length(y); % number of training examples

% You need to return the following variables correctly
J = 0;

% ====================== YOUR CODE HERE ======================
% Instructions: Compute the cost of a particular choice of theta
%               You should set J to the cost.
H=X*theta;
J=sum(1/(2*m)*((H-y).^2));

% =========================================================================

end
需要注意上面的
H=X*theta;
这里我们采用向量化的方法,相比于for循环的迭代,能较大的提升程序的简洁性以及效率。这里在吴恩达老师在讲复习线性代数矩阵乘法中有提及。点这里进入这一节的传送门。
3------使cost function最小化,求出/theta
**这里使用的是梯度下降的方法,在线性回归模型中,还有另一种方法叫做 正规方程法 **
正规方程法
 这里是在多变量里用到的正规方程法,单变量当然也适用。需要注意X扩展了一列值为1的向量。
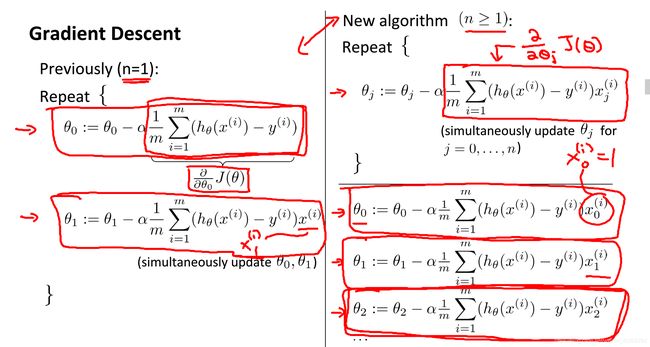
梯度下降法(左为单特征/即n=1,右为多特征变量/即n>=1)

(可选)4—可视化
其实我认为在线性回归(包括后面的逻辑回归),目的就是求出那个参数,求出参数,问题就可以解决了,就可以用这个 假设方程H去预测值
%% ============= Part 4: Visualizing J(theta_0, theta_1) =============
fprintf('Visualizing J(theta_0, theta_1) ...\n')

% Grid over which we will calculate J
theta0_vals = linspace(-10, 10, 100);
theta1_vals = linspace(-1, 4, 100);

% initialize J_vals to a matrix of 0's
J_vals = zeros(length(theta0_vals), length(theta1_vals));

% Fill out J_vals
for i = 1:length(theta0_vals)
    for j = 1:length(theta1_vals)
	  t = [theta0_vals(i); theta1_vals(j)];
	  J_vals(i,j) = computeCost(X, y, t);
    end
end


% Because of the way meshgrids work in the surf command, we need to
% transpose J_vals before calling surf, or else the axes will be flipped
J_vals = J_vals';
% Surface plot
figure;
surf(theta0_vals, theta1_vals, J_vals)
xlabel('\theta_0'); ylabel('\theta_1');

% Contour plot
figure;
% Plot J_vals as 15 contours spaced logarithmically between 0.01 and 100
contour(theta0_vals, theta1_vals, J_vals, logspace(-2, 3, 20))
xlabel('\theta_0'); ylabel('\theta_1');
hold on;
plot(theta(1), theta(2), 'rx', 'MarkerSize', 10, 'LineWidth', 2);
