【阿旭机器学习实战】【6】普通线性线性回归原理及糖尿病进展预测实战
【阿旭机器学习实战】系列文章主要介绍机器学习的各种算法模型及其实战案例,欢迎点赞,关注共同学习交流。
本文对机器学习中的线性回归模型原理进行了简单介绍,并且通过实战案例糖尿病进展预测,介绍了其基本使用方法。
目录
- 1、原理
-
- 最小二乘法
- 2、实例--糖尿病进展预测
-
- 2.1 导入数据集并查看数据特征
- 2.2 建立线性回归模型,并进行预测
- 2.3 模型评估
- 2.4 绘图:查看实际值与预测值的情况
- 3.总结
1、原理
回归是对连续型的数据做出预测。分类的目标变量是标称型数据。
如何从一大堆数据里求出回归方程呢?
假定输人数据存放在矩阵X中,而回归系数存放在向量W中。那么对于给定的数据X1, 预测结果将会通过
Y=X*W
给出。现在的问题是,手里有一些X和对应的Y,怎样才能找到W呢?
一个常用的方法就是找出使误差最小的W。这里的误差是指预测Y值和真实Y值之间的差值,使用该误差的简单累加将使得正差值和负差值相互抵消,所以我们采用平方误差。通常我们使用最小二乘法来求解误差最小值。
最小二乘法
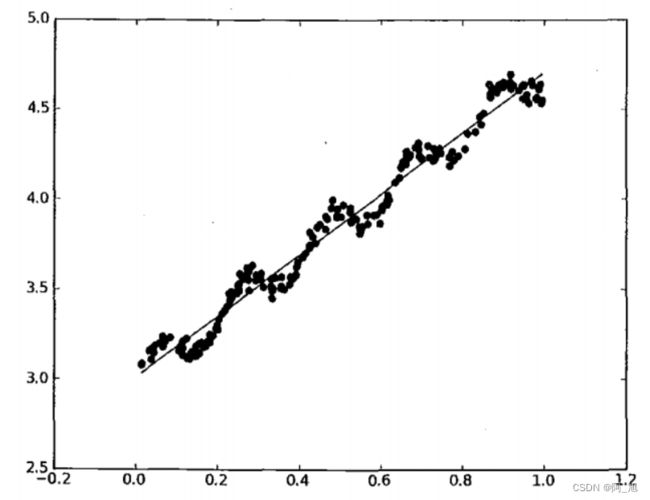
例如有下面一张图片:
2、实例–糖尿病进展预测
2.1 导入数据集并查看数据特征
# 导入线性回归器算法模型
from sklearn.linear_model import LinearRegression
import numpy as np
#糖尿病数据集 ,训练一个回归模型来预测糖尿病进展
from sklearn import datasets
dia = datasets.load_diabetes()
dia
{'data': array([[ 0.03807591,  0.05068012,  0.06169621, ..., -0.00259226,
          0.01990842, -0.01764613],
        [-0.00188202, -0.04464164, -0.05147406, ..., -0.03949338,
         -0.06832974, -0.09220405],
        [ 0.08529891,  0.05068012,  0.04445121, ..., -0.00259226,
          0.00286377, -0.02593034],
        ...,
        [ 0.04170844,  0.05068012, -0.01590626, ..., -0.01107952,
         -0.04687948,  0.01549073],
        [-0.04547248, -0.04464164,  0.03906215, ...,  0.02655962,
          0.04452837, -0.02593034],
        [-0.04547248, -0.04464164, -0.0730303 , ..., -0.03949338,
         -0.00421986,  0.00306441]]),
 'target': array([151.,  75., 141., 206., 135.,  97., 138.,  63., 110., 310., 101.,
         69., 179., 185., 118., 171., 166., 144.,  97., 168.,  68.,  49.,
         68., 245., 184., 202., 137.,  85., 131., 283., 129.,  59., 341.,
         87.,  65., 102., 265., 276., 252.,  90., 100.,  55.,  61.,  92.,
        259.,  53., 190., 142.,  75., 142., 155., 225.,  59., 104., 182.,
        128.,  52.,  37., 170., 170.,  61., 144.,  52., 128.,  71., 163.,
        150.,  97., 160., 178.,  48., 270., 202., 111.,  85.,  42., 170.,
        200., 252., 113., 143.,  51.,  52., 210.,  65., 141.,  55., 134.,
         42., 111.,  98., 164.,  48.,  96.,  90., 162., 150., 279.,  92.,
         83., 128., 102., 302., 198.,  95.,  53., 134., 144., 232.,  81.,
        104.,  59., 246., 297., 258., 229., 275., 281., 179., 200., 200.,
        173., 180.,  84., 121., 161.,  99., 109., 115., 268., 274., 158.,
        107.,  83., 103., 272.,  85., 280., 336., 281., 118., 317., 235.,
         60., 174., 259., 178., 128.,  96., 126., 288.,  88., 292.,  71.,
        197., 186.,  25.,  84.,  96., 195.,  53., 217., 172., 131., 214.,
         59.,  70., 220., 268., 152.,  47.,  74., 295., 101., 151., 127.,
        237., 225.,  81., 151., 107.,  64., 138., 185., 265., 101., 137.,
        143., 141.,  79., 292., 178.,  91., 116.,  86., 122.,  72., 129.,
        142.,  90., 158.,  39., 196., 222., 277.,  99., 196., 202., 155.,
         77., 191.,  70.,  73.,  49.,  65., 263., 248., 296., 214., 185.,
         78.,  93., 252., 150.,  77., 208.,  77., 108., 160.,  53., 220.,
        154., 259.,  90., 246., 124.,  67.,  72., 257., 262., 275., 177.,
         71.,  47., 187., 125.,  78.,  51., 258., 215., 303., 243.,  91.,
        150., 310., 153., 346.,  63.,  89.,  50.,  39., 103., 308., 116.,
        145.,  74.,  45., 115., 264.,  87., 202., 127., 182., 241.,  66.,
         94., 283.,  64., 102., 200., 265.,  94., 230., 181., 156., 233.,
         60., 219.,  80.,  68., 332., 248.,  84., 200.,  55.,  85.,  89.,
         31., 129.,  83., 275.,  65., 198., 236., 253., 124.,  44., 172.,
        114., 142., 109., 180., 144., 163., 147.,  97., 220., 190., 109.,
        191., 122., 230., 242., 248., 249., 192., 131., 237.,  78., 135.,
        244., 199., 270., 164.,  72.,  96., 306.,  91., 214.,  95., 216.,
        263., 178., 113., 200., 139., 139.,  88., 148.,  88., 243.,  71.,
         77., 109., 272.,  60.,  54., 221.,  90., 311., 281., 182., 321.,
         58., 262., 206., 233., 242., 123., 167.,  63., 197.,  71., 168.,
        140., 217., 121., 235., 245.,  40.,  52., 104., 132.,  88.,  69.,
        219.,  72., 201., 110.,  51., 277.,  63., 118.,  69., 273., 258.,
         43., 198., 242., 232., 175.,  93., 168., 275., 293., 281.,  72.,
        140., 189., 181., 209., 136., 261., 113., 131., 174., 257.,  55.,
         84.,  42., 146., 212., 233.,  91., 111., 152., 120.,  67., 310.,
         94., 183.,  66., 173.,  72.,  49.,  64.,  48., 178., 104., 132.,
        220.,  57.]),
 'DESCR': 'Diabetes dataset\n================\n\nNotes\n-----\n\nTen baseline variables, age, sex, body mass index, average blood\npressure, and six blood serum measurements were obtained for each of n =\n442 diabetes patients, as well as the response of interest, a\nquantitative measure of disease progression one year after baseline.\n\nData Set Characteristics:\n\n  :Number of Instances: 442\n\n  :Number of Attributes: First 10 columns are numeric predictive values\n\n  :Target: Column 11 is a quantitative measure of disease progression one year after baseline\n\n  :Attributes:\n    :Age:\n    :Sex:\n    :Body mass index:\n    :Average blood pressure:\n    :S1:\n    :S2:\n    :S3:\n    :S4:\n    :S5:\n    :S6:\n\nNote: Each of these 10 feature variables have been mean centered and scaled by the standard deviation times `n_samples` (i.e. the sum of squares of each column totals 1).\n\nSource URL:\nhttp://www4.stat.ncsu.edu/~boos/var.select/diabetes.html\n\nFor more information see:\nBradley Efron, Trevor Hastie, Iain Johnstone and Robert Tibshirani (2004) "Least Angle Regression," Annals of Statistics (with discussion), 407-499.\n(http://web.stanford.edu/~hastie/Papers/LARS/LeastAngle_2002.pdf)\n',
 'feature_names': ['age',
  'sex',
  'bmi',
  'bp',
  's1',
  's2',
  's3',
  's4',
  's5',
  's6']}
# 数据特征含义
dia.feature_names
['age', 'sex', 'bmi', 'bp', 's1', 's2', 's3', 's4', 's5', 's6']
# 提取特征数据和标签数据
data = dia.data
target = dia.target
data.shape
(442, 10)
2.2 建立线性回归模型,并进行预测
# 训练样本和测试样本的分离,测试集10%
from sklearn.model_selection import train_test_split
x_train,x_test,y_train,y_test = train_test_split(data,target,test_size=0.1)
x_train.shape
(397, 10)
# 创建线性回归模型
linear = LinearRegression()
# 用linear模型来训练数据:训练的过程是把x_train 和y_train带入公式W = (X^X)-1X^TY求出回归系数W
linear.fit(x_train,y_train)
LinearRegression(copy_X=True, fit_intercept=True, n_jobs=1, normalize=False)
# 对测试数据预测
y_ = linear.predict(x_test)
# 预测过程是把x_test依次带入回归方程得到对应的y_
# 查看截距与各特征线性拟合的系数
print('模型截距 w0 = {0:.3f}'.format(linear.intercept_))
print('模型系数 = {}'.format(linear.coef_))
模型截距 b= 153.101
模型系数 w= [ -28.26717302 -234.83445245  549.39279125  320.8755665  -825.20750432
  524.24205362  132.35723532  191.46312299  778.52539045   33.48522073]
# 查看实际值与预测值
y_[:50],y_test[:50]
(array([ 62.80628744, 129.50310918,  75.95424649, 202.76872408,
        197.41332437, 183.45107848, 126.32736709, 156.02144908,
        196.55335701,  61.47239162,  43.68195037, 178.2086671 ,
        104.66763656, 198.95379897, 219.62737502, 131.11988555,
         62.10724641, 123.95841231,  93.11450093,  86.93222582,
         99.17135234, 151.70998161,  71.90185513, 174.04776099,
        156.93364065, 113.32715311, 137.14848755,  59.96221965,
        126.22426198, 148.35722708, 208.70757214, 116.64584188,
         79.35346445, 221.82972164, 129.09191804, 162.95682445,
        126.64035226,  62.42385025, 125.97719065, 175.54327614,
        144.54016457, 170.22452745,  97.24012398,  41.31366272,
        169.53648083]),
 array([ 96., 135.,  59., 150., 131., 171., 178.,  85., 122.,  77., 116.,
        181., 125.,  68., 192.,  74.,  72.,  51., 158.,  74.,  72., 197.,
         75., 311.,  91., 107., 146.,  70.,  92.,  95., 268., 183.,  72.,
        332., 131., 151., 111.,  52.,  65.,  66.,  90., 121.,  69.,  55.,
        141.]))
2.3 模型评估
import sklearn.metrics as sm

print("平均绝对误差:", sm.mean_absolute_error(y_,y_test))
print("平均平方误差:", sm.mean_squared_error(y_,y_test))
print("中位绝对误差:", sm.median_absolute_error(y_,y_test))
# R2→1模型的数据拟合性就越好,反之,R2→0,表明模型的数据拟合度越差。
print("决定系数R2得分:", sm.r2_score(y_,y_test))
平均绝对误差: 42.021235318719555
平均平方误差: 2946.0370977009784
中位绝对误差: 33.193712560880385
决定系数R2得分: -0.18948366198589683
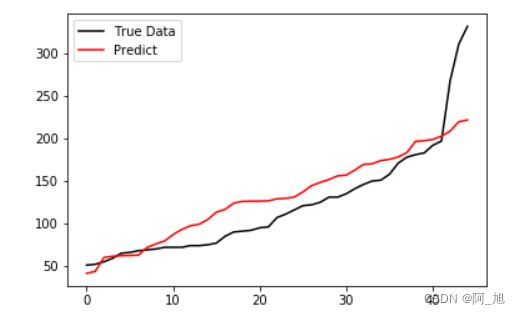
2.4 绘图:查看实际值与预测值的情况
# 绘图,查看预测与实际值的情况
from matplotlib import pyplot as plt

plt.plot(range(len(y_test)),sorted(y_test),c='black',label='True Data')
plt.plot(range(len(y_test)),sorted(y_),c='red',label='Predict')
plt.legend()
plt.show()
3.总结
本文主要介绍了以下几点:
1、线性回归模型的基本原理:最小二乘法
2、使用sklearn建立线性回归模型并进行训练与评估
后续:本文仅介绍了基础了回归模型,后续会进一步介绍线性回归中的
岭回归与Lasso回归,欢迎持续关注…
如果内容对你有帮助,感谢记得点赞+关注哦!
欢迎关注我的公众号:
阿旭算法与机器学习,共同学习交流。
更多干货内容持续更新中…


