计算两幅图像的相似度(PSNR、SSIM、MSE、余弦相似度、MD5、直方图、互信息、Hash)& 代码实现 与举例
MSE(Mean Squared Error)均方误差
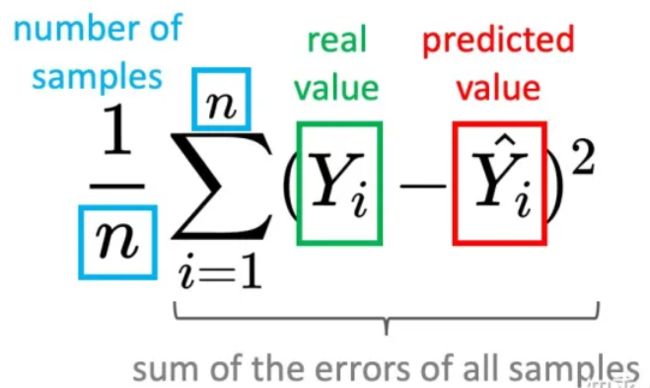
MSE公式
MSE 计算模型的预测 Ŷ 与真实标签 Y 的接近程度。公式表示为:
对于两个m×n的单通道图像I和K,它们的均方误差可定义为:
优点:MSE的函数曲线光滑、连续,处处可导,便于使用梯度下降算法,是一种常用的损失函数。而且,随着误差的减小,梯度也在减小,这有利于收敛,即使使用固定的学习速率,也能较快的收敛到最小值。
缺点:当真实值y和预测值f(x)的差值大于1时,会放大误差;而当差值小于1时,则会缩小误差,这是平方运算决定的。MSE对于较大的误差(>1)给予较大的惩罚,较小的误差(<1)给予较小的惩罚。也就是说,对离群点比较敏感,受其影响较大。
代码实现
# MSE

# 方法一:自定义函数

import numpy as np
def MSE(img1,img2):
    mse = np.mean( (img1 - img2) ** 2 )
    return mse

# 方法二:调用库函数
# 老版本的scikit-image,加载SSIM、PSNR、MSE的方式:
from skimage.measure import compare_mse as mse

# 新版本的scikit-image,加载方式:
from skimage.metrics import mean_squared_error as mse
PSNR(Peak Signal-to-Noise Ratio)峰值信噪比
PSNR(Peak Signal to Noise Ratio),峰值信噪比,是一种评价图像的客观标准。,应用场景有很多。它具有局性,PSNR是“Peak Signal to Noise Ratio”的缩写。peak的中文意思是顶点。而ratio的意思是比率或比列的。整个意思就是到达噪音比率的顶点信号,psnr一般是用于最大值信号和背景噪音之间的一个工程项目。通常在经过影像压缩之后,通常输出的影像都会在某种程度与原始影像不同。为了衡量经过处理后的影像品质,通常会参考PSNR值来衡量某个处理程序能否令人满意。它是原图像与被处理图 像之间的均方误差相对于(2n-1)2的对数值(信号最大值的平方,n是每个采样值的比特数),它的单位是dB。
PSNR是最普遍和使用最为广泛的一种图像客观评价指标,然而它是基于对应像素点间的误差,即 基于误差敏感的图像质量评价。由于并未考虑到人眼的视觉特性(人眼对空间频率较低的对比差异敏感度较高,人眼对亮度对比差异的敏感度较色度高,人眼对一个 区域的感知结果会受到其周围邻近区域的影响等),因而经常出现评价结果与人的主观感觉不一致的情况。
PSNR公式
PSNR是通过MSE得出来的,公式如下:
其中,MAXI是表示图像点颜色的最大数值,如果每个采样点用 8 位表示,那么就是 255。
所以MSE越小,则PSNR越大;所以PSNR越大,代表着图像质量越好。一般来说,
- PSNR高于40dB说明图像质量极好(即非常接近原始图像);
- 在30—40dB通常表示图像质量是好的(即失真可以察觉但可以接受);
- 在20—30dB说明图像质量差;
- 最后,PSNR低于20dB图像不可接受。
代码实现
# PSNR

# 方法一:自定义函数

import numpy
import math
def psnr(img1, img2):
    mse = numpy.mean( (img1 - img2) ** 2 )
    if mse == 0:
        return 100
    PIXEL_MAX = 255.0
    return 20 * math.log10(PIXEL_MAX / math.sqrt(mse))


# 方法二:调用库函数

# 老版本的scikit-image,加载SSIM、PSNR、MSE的方式:
from skimage.measure import compare_ssim as ssim
from skimage.measure import compare_psnr as psnr
from skimage.measure import compare_mse as mse

# 新版本的scikit-image,加载方式:
from skimage.metrics import structural_similarity as ssim
from skimage.metrics import peak_signal_noise_ratio as psnr
from skimage.metrics import mean_squared_error as mse
SSIM(structural similarity)结构相似性
SSIM(structural similarity),结构相似性,是一种衡量两幅图像相似度的指标。
SSIM算法主要用于检测两张相同尺寸的图像的相似度、或者检测图像的失真程度。
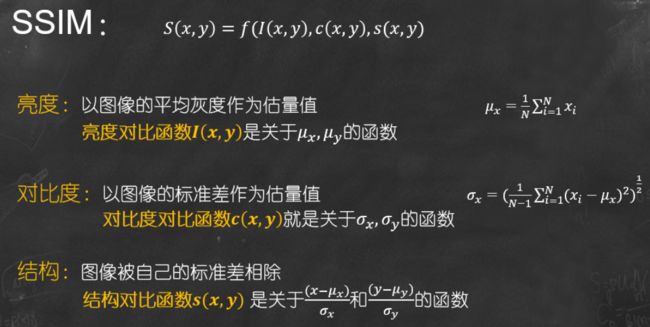
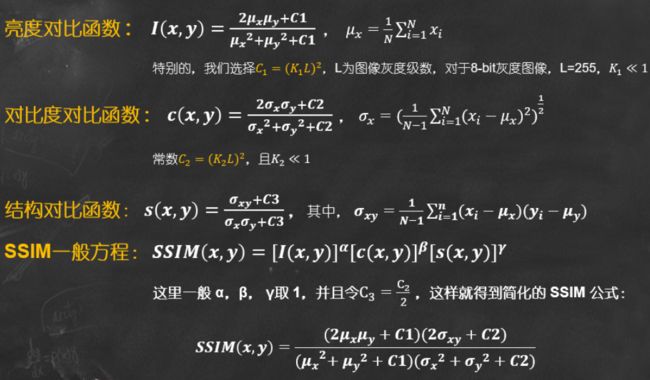
SSIM公式基于样本x和y之间的三个比较衡量:亮度 (luminance)、对比度 (contrast) 和结构 (structure)。
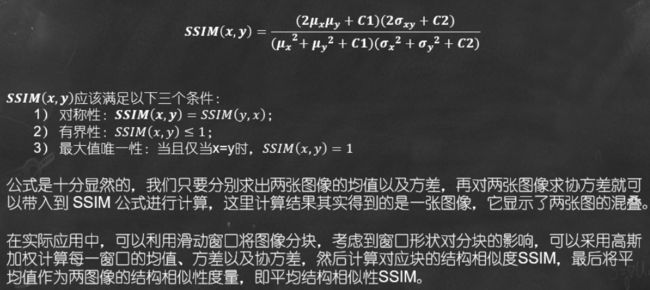
SSIM公式
常数, , 是为了避免当分母为 0 时造成的不稳定问题。
为均值, 为方差, 表示协方差。
![]()
SSIM取值范围为[0,1],值越大表示输出图像和无失真图像的差距越小,即图像质量越好。
缺点:结构相似性指标有其限制,对于影像出现位移、缩放、旋转(皆属于非结构性的失真)的情况无法有效的运作。
代码实现
# SSIM

# 方法一:自定义函数
# 很奇怪,计算出来和调用函数结果差异很大,建议直接调用函数
import numpy as np
def ssim(y_true , y_pred):
    u_true = np.mean(y_true)
    u_pred = np.mean(y_pred)
    var_true = np.var(y_true)
    var_pred = np.var(y_pred)
    std_true = np.sqrt(var_true)
    std_pred = np.sqrt(var_pred)
    c1 = np.square(0.01*7)
    c2 = np.square(0.03*7)
    ssim = (2 * u_true * u_pred + c1) * (2 * std_pred * std_true + c2)
    denom = (u_true ** 2 + u_pred ** 2 + c1) * (var_pred + var_true + c2)
    return ssim / denom


# 方法二:调用库函数

# 老版本的scikit-image,加载SSIM、PSNR、MSE的方式:
from skimage.measure import compare_ssim as ssim
from skimage.measure import compare_psnr as psnr
from skimage.measure import compare_mse as mse

# 新版本的scikit-image,加载方式:
from skimage.metrics import structural_similarity as ssim
from skimage.metrics import peak_signal_noise_ratio as psnr
from skimage.metrics import mean_squared_error as mse
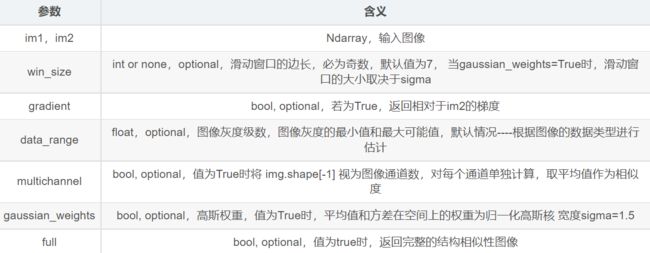
函数 structural_similarity
def structural_similarity(*, im1, im2,
                         win_size=None, gradient=False, data_range=None,
                         multichannel=False, gaussian_weights=False,
                         full=False, **kwargs)
处理RGB等多通道图像或划分为多块时
上述原始计算方式仅法针对单通道灰度图,
求RGB图或多通道图时,PSNR有三种方式,其他类似:
- 分别计算 RGB 三个通道的 PSNR,然后取平均值。
- 计算 RGB 三通道的 MSE ,然后再除以 3 。
- 将图片转化为 YCbCr 格式,然后只计算 Y 分量也就是亮度分量的 PSNR。
分为多块时,在实际应用中,可以利用滑动窗将图像分块,令分块总数为N,考虑到窗口形状对分块的影响,采用高斯加权计算每一窗口的均值、方差以及协方差,然后计算对应块的结构相似度SSIM,最后将平均值作为两图像的结构相似性度量,即平均结构相似性SSIM。
例:计算两个RGB图像的MSE(均方误差):
- 从红色通道开始;
- 计算两个图像的红色通道中每个像素的灰度值之间的差异(所有像素位置的(redA(0,0)-redB(0,0)等);
- 对每个像素的差异进行平方 (redA(0,0)-redB(0,0)^2;
- 计算红色通道中所有像素的平方差之和;
- 对绿色和蓝色通道重复上述操作;
- 将 3 个通道的总和相加并除以 3,即 (红色通道和+绿色通道和+蓝色通道和)/ 3;
- 除以图像面积(宽度高度)以形成平均值或平均值,即(红和+绿和+蓝和)/(3* 宽度*高度)= MSE。
余弦相似度
把图片表示成一个向量,通过计算向量之间的余弦距离来表征两张图片的相似度。
余弦相似度算法:一个向量空间中两个向量夹角间的余弦值作为衡量两个个体之间差异的大小,余弦值接近1,夹角趋于0,表明两个向量越相似,余弦值接近于0,夹角趋于90度,表明两个向量越不相似。
余弦公式
 二维空间余弦函数
 多维空间余弦函数
代码实现
图片相似度计算方法总结 - 知乎 (zhihu.com)
# -*- coding: utf-8 -*-
# !/usr/bin/env python
# 余弦相似度计算
from PIL import Image
from numpy import average, dot, linalg
# 对图片进行统一化处理
def get_thum(image, size=(64, 64), greyscale=False):
    # 利用image对图像大小重新设置, Image.ANTIALIAS为高质量的
    image = image.resize(size, Image.ANTIALIAS)
    if greyscale:
        # 将图片转换为L模式,其为灰度图,其每个像素用8个bit表示
        image = image.convert('L')
    return image
# 计算图片的余弦距离
def image_similarity_vectors_via_numpy(image1, image2):
    image1 = get_thum(image1)
    image2 = get_thum(image2)
    images = [image1, image2]
    vectors = []
    norms = []
    for image in images:
        vector = []
        for pixel_tuple in image.getdata():
            vector.append(average(pixel_tuple))
        vectors.append(vector)
        # linalg=linear(线性)+algebra(代数),norm则表示范数
        # 求图片的范数
        norms.append(linalg.norm(vector, 2))
    a, b = vectors
    a_norm, b_norm = norms
    # dot返回的是点积,对二维数组(矩阵)进行计算
    res = dot(a / a_norm, b / b_norm)
    return res
image1 = Image.open('010.jpg')
image2 = Image.open('011.jpg')
cosin = image_similarity_vectors_via_numpy(image1, image2)
print('图片余弦相似度', cosin)
哈希相似度 Hash
图片相相似度计算(Hash、SSIM、compareHist)_南苏月的博客-CSDN博客_图像相似度计算公式
哈希算法-图片相似度计算_chenghaoy的博客-CSDN博客_均值哈希算法相似度
实现图片相似度比较的hash算法有三种:均值哈希算法(AHash),差值哈希算法(DHash),感知哈希算法 (PHash)。
- aHash:平均值哈希。速度比较快,但是常常不太精确。
- pHash:感知哈希。精确度比较高,但是速度方面较差一些。
- dHash:差异值哈希。精确度较高,且速度也非常快。
哈希不是以严格的方式计算Hash值,而是以更加相对的方式计算哈希值,因为“相似”与否,就是一种相对的判定。值哈希算法、差值哈希算法和感知哈希算法都是值越小,相似度越高,取值为0-64,即汉明距离中,64位的hash值有多少不同。三直方图和单通道直方图的值为0-1,值越大,相似度越高。
均值哈希算法(AHash)
一张图片就是一个二维信号,它包含了不同频率的成分。亮度变化小的区域是低频成分,它描述大范围的信息。而亮度变化剧烈的区域(比如物体的边缘)就是高频的成分,它描述具体的细节。或者说高频可以提供图片详细的信息,而低频可以提供一个框架。 而一张大的,详细的图片有很高的频率,而小图片缺乏图像细节,所以都是低频的。所以我们平时的下采样,也就是缩小图片的过程,实际上是损失高频信息的过程。均值哈希算法就是利用图片的低频信息。
具体步骤:
- 缩小尺寸:将图片缩小到8x8的尺寸,总共64个像素。这一步的作用是去除图片的细节,只保留结构、明暗等基本信息,摒弃不同尺寸、比例带来的图片差异。
- 简化色彩:将缩小后的图片,转为64级灰度。也就是说,所有像素点总共只有64种颜色。
- 计算平均值:计算所有64个像素的灰度平均值
- 比较像素的灰度:将每个像素的灰度,与平均值进行比较。大于或等于平均值,记为1;小于平均值,记为0。
- 计算哈希值:将上一步的比较结果,组合在一起,就构成了一个64位的整数,这就是这张图片的指纹。组合的次序并不重要,只要保证所有图片都采用同样次序就行了。
最后得到两张图片的指纹信息后,计算两组64位数据的汉明距离,即对比数据不同的位数,不同位数越少,表明图片的相似度越大。
分析: 均值哈希算法计算速度快,不受图片尺寸大小的影响,但是缺点就是对均值敏感,例如对图像进行伽马校正或直方图均衡就会影响均值,从而影响最终的hash值。
感知哈希算法 (PHash)
感知哈希算法是一个比均值哈希算法更为健壮的一种算法,与均值哈希算法的区别在于感知哈希算法是通过DCT(离散余弦变换)来获取图片的低频信息。
离散余弦变换(DCT)是种图像压缩算法,它将图像从像素域变换到频率域。然后一般图像都存在很多冗余和相关性的,所以转换到频率域之后,只有很少的一部分频率分量的系数才不为0,大部分系数都为0(或者说接近于0)。经过DCT变换后的系数矩阵从左上角到右下角频率越来越高,因此图片的能量主要保留在左上角的低频系数上了。
具体步骤:
- 缩小尺寸:pHash以小图片开始,但图片大于8x8,32x32是最好的。这样做的目的是简化了DCT的计算,而不是减小频率。
- 简化色彩:将图片转化成灰度图像,进一步简化计算量。
- 计算DCT:计算图片的DCT变换,得到32x32的DCT系数矩阵。
- 缩小DCT:虽然DCT的结果是32x32大小的矩阵,但我们只要保留左上角的8x8的矩阵,这部分呈现了图片中的最低频率。
- 计算平均值:如同均值哈希一样,计算DCT的均值。
- 计算hash值:这是最主要的一步,根据8x8的DCT矩阵,设置0或1的64位的hash值,大于等于DCT均值的设为”1”,小于DCT均值的设为“0”。组合在一起,就构成了一个64位的整数,这就是这张图片的指纹。
分析: 结果并不能告诉我们真实性的低频率,只能粗略地告诉我们相对于平均值频率的相对比例。只要图片的整体结构保持不变,hash结果值就不变。能够避免伽马校正或颜色直方图被调整带来的影响。对于变形程度在25%以内的图片也能精准识别。
差值哈希算法(DHash)
比pHash,dHash的速度要快的多,相比aHash,dHash在效率几乎相同的情况下的效果要更好,它是基于渐变实现的。
主要步骤:
- 缩小尺寸:收缩到8x9(高x宽)的大小,一遍它有72的像素点
- 转化为灰度图:把缩放后的图片转化为256阶的灰度图。
- 计算差异值:dHash算法工作在相邻像素之间,这样每行9个像素之间产生了8个不同的差异,一共8行,则产生了64个差异值
- 获得指纹:如果左边的像素比右边的更亮,则记录为1,否则为0.
代码实现
import cv2
import numpy as np
#感知哈希算法
def pHash(image):
    image = cv2.resize(image,(32,32), interpolation=cv2.INTER_CUBIC)
    image = cv2.cvtColor(image,cv2.COLOR_BGR2GRAY)
#     cv2.imshow('image', image)
#     cv2.waitKey(0)
#     cv2.destroyAllWindows()
    # 将灰度图转为浮点型,再进行dct变换
    dct = cv2.dct(np.float32(image))
#     print(dct)
    # 取左上角的8*8,这些代表图片的最低频率
    # 这个操作等价于c++中利用opencv实现的掩码操作
    # 在python中进行掩码操作,可以直接这样取出图像矩阵的某一部分
    dct_roi = dct[0:8,0:8]
    avreage = np.mean(dct_roi)
    hash = []
    for i in range(dct_roi.shape[0]):
        for j in range(dct_roi.shape[1]):
            if dct_roi[i,j] > avreage:
                hash.append(1)
            else:
                hash.append(0)
    return hash

#均值哈希算法
def aHash(image):
    #缩放为8*8
    image=cv2.resize(image,(8,8),interpolation=cv2.INTER_CUBIC)
    #转换为灰度图
    image=cv2.cvtColor(image,cv2.COLOR_BGR2GRAY)
    avreage = np.mean(image)
    hash = []
    for i in range(image.shape[0]):
        for j in range(image.shape[1]):
            if image[i,j] > avreage:
                hash.append(1)
            else:
                hash.append(0)
    return hash

#差值感知算法
def dHash(image):
    #缩放9*8
    image=cv2.resize(image,(9,8),interpolation=cv2.INTER_CUBIC)
    #转换灰度图
    image=cv2.cvtColor(image,cv2.COLOR_BGR2GRAY)
#     print(image.shape)
    hash=[]
    #每行前一个像素大于后一个像素为1,相反为0,生成哈希
    for i in range(8):
        for j in range(8):
            if image[i,j]>image[i,j+1]:
                hash.append(1)
            else:
                hash.append(0)
    return hash

#计算汉明距离
def Hamming_distance(hash1,hash2):
    num = 0
    for index in range(len(hash1)):
        if hash1[index] != hash2[index]:
            num += 1
    return num
if __name__ == "__main__":
    image_file1 = './data/cartoon1.jpg'
    image_file2 = './data/cartoon3.jpg'
    img1 = cv2.imread(image_file1)
    img2 = cv2.imread(image_file2)
    hash1 = pHash(img1)
    hash2 = pHash(img2)
    dist = Hamming_distance(hash1, hash2)
    #将距离转化为相似度
    similarity = 1 - dist * 1.0 / 64
    print(dist)
    print(similarity)
直方图距离
图片的相似度--直方图距离 - 知乎 (zhihu.com)
直方图距离描述
方法描述:按照某种距离度量的标准对两幅图像的直方图进行相似度的测量。
图像直方图丰富的图像细节信息,反映了图像像素点的概率分布情况,统计每一个像素点强度值具有的像素个数。
- 优点:计算量比较小。
- 缺点: 直方图反应的是图像灰度值得概率分布,并没有图像的空间位置信息在里面,因此,会出现误判;比如纹理结构相同,但明暗不同的图像,应该相似度很高,但实际结果是相似度很低,而纹理结构不同,但明暗相近的图像,相似度却很高。
计算步骤:
- 将图片resize,得到相同大小的图片;
- 将图片灰度,灰度后图片的像素在[0-255]之间;
- 计算图片的直方图数据,统计相同像素点的概率分布;
- 根据相关性计算公式,计算两个图片直方图的相关性。
代码实现
import cv2
def calculate(image1, image2):
    # 灰度直方图算法
    # 计算单通道的直方图的相似值
    hist1 = cv2.calcHist([image1], [0], None, [256], [0.0, 255.0])
    hist2 = cv2.calcHist([image2], [0], None, [256], [0.0, 255.0])
    # 计算直方图的重合度
    degree = 0
    for i in range(len(hist1)):
        if hist1[i] != hist2[i]:
            degree = degree + (1 - abs(hist1[i] - hist2[i]) / max(hist1[i], hist2[i]))
        else:
            degree = degree + 1
    degree = degree / len(hist1)
    return degree

def classify_hist_with_split(image1, image2, size=(256, 256)):
    # RGB每个通道的直方图相似度
    # 将图像resize后,分离为RGB三个通道,再计算每个通道的相似值
    image1 = cv2.resize(image1, size)
    image2 = cv2.resize(image2, size)
    sub_image1 = cv2.split(image1)
    sub_image2 = cv2.split(image2)
    sub_data = 0
    for im1, im2 in zip(sub_image1, sub_image2):
        sub_data += calculate(im1, im2)
    sub_data = sub_data / 3
    return sub_data
互信息(Mutual Information)
归一化互信息(NMI)评价指标_易_的博客-CSDN博客_nmi指标
信息熵、相对熵、互信息
信息熵:对信息进行量化度量。可以理解为某种特定信息的出现概率。
相对熵:(relative entropy),又被称为Kullback-Leibler散度(Kullback-Leibler divergence,KL散度)或信息散度(information divergence),是两个概率分布(probability distribution)间差异的非对称性度量 。在在信息理论中,相对熵等价于两个概率分布的信息熵(Shannon entropy)的差值。
互信息:(Mutual Information)是信息论里一种有用的信息度量,它可以看成是一个随机变量中包含的关于另一个随机变量的信息量,或者说是一个随机变量由于已知另一个随机变量而减少的不肯定性。
归一化互信息:将互信息放在[0,1]之间,容易评价算法的好坏。
代码实现
from sklearn import metrics as mr

img1 = cv2.imread('1.png')
img2 = cv2.imread('2.png')
img2 = cv2.resize(img2, (img1.shape[1], img1.shape[0])
nmi = mr.normalized_mutual_info_score(img1.reshape(-1), img2.reshape(-1))
像素匹配 pixelmatch
GitHub - whtsky/pixelmatch-py: A fast pixel-level image comparison library, originally created to compare screenshots in tests.
利用像素之间的匹配来计算相似度
# https://github.com/whtsky/pixelmatch-py

# 第一步:

pip install pixelmatch


# 第二步:

from PIL import Image
from pixelmatch.contrib.PIL import pixelmatch

img_a = Image.open("a.png")
img_b = Image.open("b.png")
img_diff = Image.new("RGBA", img_a.size)
# note how there is no need to specify dimensions
mismatch = pixelmatch(img_a, img_b, img_diff, includeAA=True)
img_diff.save("diff.png")
举例1——使用四种方法计算图片相似度:MD5、直方图、PSNR、SSIM
有史以来最全的图像相似度算法_小殊小殊的博客-CSDN博客_图片相似度
使用四种方法计算图片相似度:MD5(粗暴的md5比较,判断是否完全相同)、直方图、PSNR、SSIM。
import numpy as np
from PIL import Image
from skimage.metrics import structural_similarity
import cv2
import os
import hashlib
import math

'''
    粗暴的md5比较 返回是否完全相同
'''
def md5_similarity(img1_path, img2_path):
    file1 = open(img1_path, "rb")
    file2 = open(img2_path, "rb")
    md = hashlib.md5()
    md.update(file1.read())
    res1 = md.hexdigest()
    md = hashlib.md5()
    md.update(file2.read())
    res2 = md.hexdigest()
    return res1 == res2

def normalize(data):
    return data / np.sum(data)

'''
    直方图相似度
    相关性比较 cv2.HISTCMP_CORREL:值越大,相似度越高
    相交性比较 cv2.HISTCMP_INTERSECT:值越大,相似度越高
    卡方比较 cv2.HISTCMP_CHISQR:值越小,相似度越高
    巴氏距离比较 cv2.HISTCMP_BHATTACHARYYA:值越小,相似度越高
'''
def hist_similarity(img1, img2, hist_size=256):
    imghistb1 = cv2.calcHist([img1], [0], None, [hist_size], [0, 256])
    imghistg1 = cv2.calcHist([img1], [1], None, [hist_size], [0, 256])
    imghistr1 = cv2.calcHist([img1], [2], None, [hist_size], [0, 256])

    imghistb2 = cv2.calcHist([img2], [0], None, [hist_size], [0, 256])
    imghistg2 = cv2.calcHist([img2], [1], None, [hist_size], [0, 256])
    imghistr2 = cv2.calcHist([img2], [2], None, [hist_size], [0, 256])

    distanceb = cv2.compareHist(normalize(imghistb1), normalize(imghistb2), cv2.HISTCMP_CORREL)
    distanceg = cv2.compareHist(normalize(imghistg1), normalize(imghistg2), cv2.HISTCMP_CORREL)
    distancer = cv2.compareHist(normalize(imghistr1), normalize(imghistr2), cv2.HISTCMP_CORREL)
    meandistance = np.mean([distanceb, distanceg, distancer])
    return meandistance

def PSNR(img1, img2):
    mse = np.mean((img1/255. - img2/255.) ** 2)
    if mse == 0:
        return 100
    PIXEL_MAX = 1
    return 20 * math.log10(PIXEL_MAX / math.sqrt(mse))

def SSIM(img1, img2):
    gray1 = cv2.cvtColor(img1, cv2.COLOR_BGR2GRAY)
    gray2 = cv2.cvtColor(img2, cv2.COLOR_BGR2GRAY)
    # 计算两个灰度图像之间的结构相似度
    score, diff = structural_similarity(gray1, gray2, win_size=101, full=True)
    # diff = (diff * 255).astype("uint8")
    # print("SSIM:{}".format(score))
    return score, diff

def ssim(img1, img2):
    u_true = np.mean(img1)
    u_pred = np.mean(img2)
    var_true = np.var(img1)
    var_pred = np.var(img2)
    std_true = np.sqrt(var_true)
    std_pred = np.sqrt(var_pred)
    c1 = np.square(0.01*7)
    c2 = np.square(0.03*7)
    ssim = (2 * u_true * u_pred + c1) * (2 * std_pred * std_true + c2)
    denom = (u_true ** 2 + u_pred ** 2 + c1) * (var_pred + var_true + c2)
    return ssim/denom

def MSE(img1,img2):
    mse = np.mean( (img1 - img2) ** 2 )
    return mse


if __name__ == '__main__':
    img1_path = '1_08.jpg'
    img2_path = '2_08.jpg'
    img1 = cv2.imread(img1_path)
    img2 = cv2.imread(img2_path)

    # 1.粗暴的md5比较 返回是否完全相同
    print('md5_similarity:', md5_similarity(img1_path, img2_path))
    # 2.直方图相似度
    print('hist_similarity:', hist_similarity(img1, img2))
    # 3.PSNR
    print('PSNR:', PSNR(img1, img2))
    # 4.SSIM
    print('灰度图SSIM:', SSIM(img1, img2)[0])
    print('RGB图_ssim:', ssim(img1, img2))
    print('RGB图_structural_similarity:', structural_similarity(img1,img2, multichannel=True))
    # 5.MSE
    print('MSE:', MSE(img1, img2))
效果展示:
 两图
两图
md5_similarity: False
hist_similarity: 0.1344447074377748
PSNR: 12.980832701995697
灰度图SSIM: 0.5966066785284522
RGB图_ssim: 0.9917382398395064
RGB图_structural_similarity: 0.525279441002218
MSE: 86.05895699395074
举例2——批量计算PSNR、SSIM、MSE
import os
import numpy as np
from glob import glob
import cv2
from skimage.measure import compare_mse,compare_ssim,compare_psnr

def read_img(path):
    return cv2.imread(path,cv2.IMREAD_GRAYSCALE)

def mse(tf_img1, tf_img2):
    return compare_mse(tf_img1,tf_img2)

def psnr(tf_img1, tf_img2):
    return compare_psnr(tf_img1,tf_img2)

def ssim(tf_img1, tf_img2):
    return compare_ssim(tf_img1,tf_img2)

def main():
    WSI_MASK_PATH1 = 'E:/test/A/'
    WSI_MASK_PATH2 = 'E:/test/B/'
    path_real = glob(os.path.join(WSI_MASK_PATH1, '*.jpg'))
    path_fake = glob(os.path.join(WSI_MASK_PATH2, '*.jpg'))
    list_psnr = []
    list_ssim = []
    list_mse = []

    for i in range(len(path_real)):
        t1 = read_img(path_real[i])
        t2 = read_img(path_fake[i])
        result1 = np.zeros(t1.shape,dtype=np.float32)
        result2 = np.zeros(t2.shape,dtype=np.float32)
        cv2.normalize(t1,result1,alpha=0,beta=1,norm_type=cv2.NORM_MINMAX,dtype=cv2.CV_32F)
        cv2.normalize(t2,result2,alpha=0,beta=1,norm_type=cv2.NORM_MINMAX,dtype=cv2.CV_32F)
        mse_num = mse(result1, result2)
        psnr_num = psnr(result1, result2)
        ssim_num = ssim(result1, result2)
        list_psnr.append(psnr_num)
        list_ssim.append(ssim_num)
        list_mse.append(mse_num)

        #输出每张图像的指标:
        print("{}/".format(i+1)+"{}:".format(len(path_real)))
        str = "\\"
        print("image:"+path_real[i][(path_real[i].index(str)+1):])
        print("PSNR:", psnr_num)
        print("SSIM:", ssim_num)
        print("MSE:",mse_num)

	#输出平均指标:
    print("平均PSNR:", np.mean(list_psnr))  # ,list_psnr)
    print("平均SSIM:", np.mean(list_ssim))  # ,list_ssim)
    print("平均MSE:", np.mean(list_mse))  # ,list_mse)

if __name__ == '__main__':
    main()
举例3——计算Y通道或RGB通道的PSNR和SSIM
Python计算Y通道或者RGB通道的PSNR_SSIM_未知量0520的博客-CSDN博客_folder_gt
- 添加:PSNR/SSIM计算结果,保存文件(txt),便于后期导入excel列表分析。
- 代码介绍:PSNR_SSIM效果和matlab计算的结果一致(本人没有验证)。
- 代码功能,能够计算图像的Y_channel 或者RGB_channel状态下的PSNR_SSIM结果
- 用法:将真实图片,生成图片分别放入两个文件夹,代码中有选择两种方式(only_Y, RGB),切换注释相应的代码行即可。
- 注意:安装相应的代码库。
'''
calculate the PSNR and SSIM.
same as MATLAB's results
https://blog.csdn.net/qq_45041702/article/details/120997743

'''
import os
import math
import numpy as np
import cv2
import glob
import os

def main():
    # Configurations

    # GT - Ground-truth;
    # Gen: Generated / Restored / Recovered images
    folder_GT = '/content/drive/MyDrive/Experiment/codes/26_PSNR_SSIM/All/groud_truth_png'
    folder_Gen = '/content/drive/MyDrive/Experiment/codes/26_PSNR_SSIM/All/1_ESPCN_png'

    #save the psnr and ssim score by txt
    PS_path = '/content/drive/MyDrive/Experiment/codes/26_PSNR_SSIM/Score'
    if not os.path.exists(PS_path):
        print('NO_path to sava the NIQE_Score,Making....')
        os.makedirs(PS_path)
    else:
        print("The NIQE_Score_path has existed")
    PS_txt = open(PS_path +'/score1.txt', 'a' )

    crop_border = 4  # same with scale
    suffix = ''  # suffix for Gen images
    test_Y = False  # True: test Y channel only; False: test RGB channels

    PSNR_all = []
    SSIM_all = []
    img_list = sorted(glob.glob(folder_GT + '/*'))

    if test_Y:
        print('Testing Y channel.')
    else:
        print('Testing RGB channels.')

    for i, img_path in enumerate(img_list):
        base_name = os.path.splitext(os.path.basename(img_path))[0]
        print(base_name)
        im_GT = cv2.imread(img_path) / 255.
        #不同格式图像
        # im_Gen = cv2.imread(os.path.join(folder_Gen, base_name + suffix + '.tif')) / 255.
        im_Gen = cv2.imread(os.path.join(folder_Gen, base_name + suffix + '.png')) / 255.

        if test_Y and im_GT.shape[2] == 3:  # evaluate on Y channel in YCbCr color space
            im_GT_in = bgr2ycbcr(im_GT)
            im_Gen_in = bgr2ycbcr(im_Gen)
        else:
            im_GT_in = im_GT
            im_Gen_in = im_Gen

        # crop borders
        if crop_border == 0:
            cropped_GT = im_GT_in
            cropped_Gen = im_Gen_in
        else:
            if im_GT_in.ndim == 3:
                cropped_GT = im_GT_in[crop_border:-crop_border, crop_border:-crop_border, :]
                cropped_Gen = im_Gen_in[crop_border:-crop_border, crop_border:-crop_border, :]
            elif im_GT_in.ndim == 2:
                cropped_GT = im_GT_in[crop_border:-crop_border, crop_border:-crop_border]
                cropped_Gen = im_Gen_in[crop_border:-crop_border, crop_border:-crop_border]
            else:
                raise ValueError('Wrong image dimension: {}. Should be 2 or 3.'.format(im_GT_in.ndim))

        #不同通道数(Y通道和RGB三个通道),需要更改
        # calculate PSNR and SSIM
        # PSNR = calculate_psnr(cropped_GT * 255, cropped_Gen * 255)
        PSNR = calculate_rgb_psnr(cropped_GT * 255, cropped_Gen * 255)

        SSIM = calculate_ssim(cropped_GT * 255, cropped_Gen * 255)
        print('{:3d} - {:25}. \tPSNR: {:.4f} dB, \tSSIM: {:.4f}'.format(
            i + 1, base_name, PSNR, SSIM))
        PSNR_all.append(PSNR)
        SSIM_all.append(SSIM)

        single_info = '[{}],PSNR(dB),{:.4f}, SSIM,{:.4f}'
        PS_txt.write(single_info.format(base_name,PSNR,SSIM))
        PS_txt.write("\n")

    Mean_format = 'Mean_PSNR: {:.4f}, Mean_SSIM: {:.4f}'
    Mean_PSNR =  sum(PSNR_all) / len(PSNR_all)
    Mean_SSIM =  sum(SSIM_all) / len(SSIM_all)
    print(Mean_format.format(Mean_PSNR,Mean_SSIM))

    PS_txt.write(Mean_format.format(Mean_PSNR,Mean_SSIM))
    PS_txt.write('\n')

def calculate_psnr(img1, img2):
    # img1 and img2 have range [0, 255]
    img1 = img1.astype(np.float64)
    img2 = img2.astype(np.float64)
    mse = np.mean((img1 - img2)**2)
    if mse == 0:
        return float('inf')
    return 20 * math.log10(255.0 / math.sqrt(mse))

def calculate_rgb_psnr(img1, img2):
    """calculate psnr among rgb channel, img1 and img2 have range [0, 255]
    """
    n_channels = np.ndim(img1)
    sum_psnr = 0
    for i in range(n_channels):
        this_psnr = calculate_psnr(img1[:,:,i], img2[:,:,i])
        sum_psnr += this_psnr
    return sum_psnr/n_channels

def ssim(img1, img2):
    C1 = (0.01 * 255)**2
    C2 = (0.03 * 255)**2

    img1 = img1.astype(np.float64)
    img2 = img2.astype(np.float64)
    kernel = cv2.getGaussianKernel(11, 1.5)
    window = np.outer(kernel, kernel.transpose())

    mu1 = cv2.filter2D(img1, -1, window)[5:-5, 5:-5]  # valid
    mu2 = cv2.filter2D(img2, -1, window)[5:-5, 5:-5]
    mu1_sq = mu1**2
    mu2_sq = mu2**2
    mu1_mu2 = mu1 * mu2
    sigma1_sq = cv2.filter2D(img1**2, -1, window)[5:-5, 5:-5] - mu1_sq
    sigma2_sq = cv2.filter2D(img2**2, -1, window)[5:-5, 5:-5] - mu2_sq
    sigma12 = cv2.filter2D(img1 * img2, -1, window)[5:-5, 5:-5] - mu1_mu2

    ssim_map = ((2 * mu1_mu2 + C1) * (2 * sigma12 + C2)) / ((mu1_sq + mu2_sq + C1) *
                                                            (sigma1_sq + sigma2_sq + C2))
    return ssim_map.mean()

def calculate_ssim(img1, img2):
    '''calculate SSIM
    the same outputs as MATLAB's
    img1, img2: [0, 255]
    '''
    if not img1.shape == img2.shape:
        raise ValueError('Input images must have the same dimensions.')
    if img1.ndim == 2:
        return ssim(img1, img2)
    elif img1.ndim == 3:
        if img1.shape[2] == 3:
            ssims = []
            for i in range(img1.shape[2]):
                ssims.append(ssim(img1[..., i], img2[..., i]))
            return np.array(ssims).mean()
        elif img1.shape[2] == 1:
            return ssim(np.squeeze(img1), np.squeeze(img2))
    else:
        raise ValueError('Wrong input image dimensions.')

def bgr2ycbcr(img, only_y=True):
    '''same as matlab rgb2ycbcr
    only_y: only return Y channel
    Input:
        uint8, [0, 255]
        float, [0, 1]
    '''
    in_img_type = img.dtype
    img.astype(np.float32)
    if in_img_type != np.uint8:
        img *= 255.
    # convert
    if only_y:
        rlt = np.dot(img, [24.966, 128.553, 65.481]) / 255.0 + 16.0
    else:
        rlt = np.matmul(img, [[24.966, 112.0, -18.214], [128.553, -74.203, -93.786],
                              [65.481, -37.797, 112.0]]) / 255.0 + [16, 128, 128]
    if in_img_type == np.uint8:
        rlt = rlt.round()
    else:
        rlt /= 255.
    return rlt.astype(in_img_type)


if __name__ == '__main__':
    main()
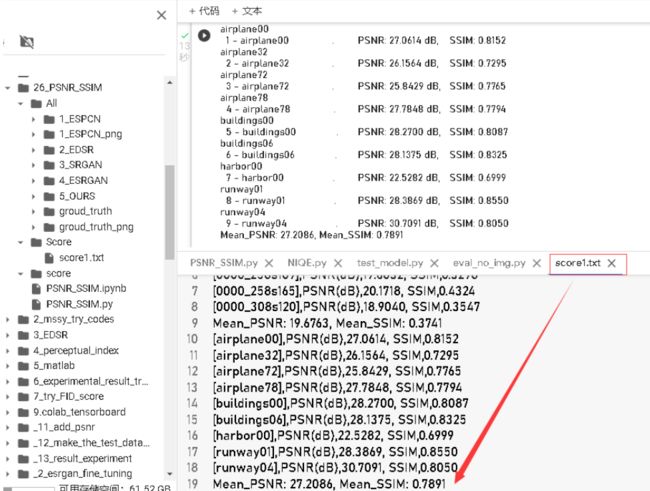
结果展示:
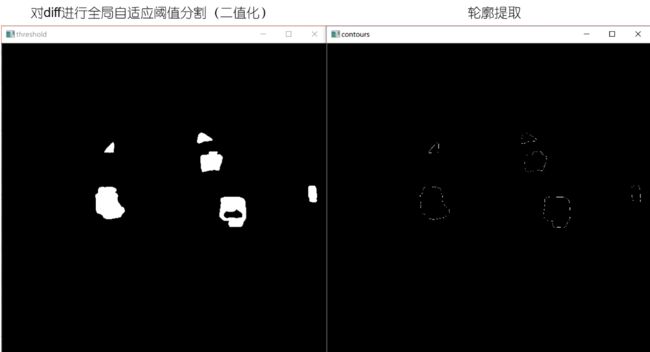
举例4——调用SSIM算法,结合opencv阈值分割和轮廓提取,找两图差异
SSIM---结构相似性算法(OpenCV+Python)_hedgehog__的博客-CSDN博客_python 结构相似性 通过调用skimage.metrics包下的SSIM算法,结合OpenCV的阈值分割及轮廓提取算法,找出两幅图像的差异。
# https://blog.csdn.net/hedgehog__/article/details/107257755

import cv2
import imutils
from skimage.metrics import structural_similarity
import time
from skimage import filters, img_as_ubyte
import numpy as np

start = time.time()
# 读入图像,转为灰度图像
src = cv2.imread('C:/Users/Hedgehog/Desktop/right.jpg')
img = cv2.imread('C:/Users/Hedgehog/Desktop/left.jpg')
grayA = cv2.cvtColor(src, cv2.COLOR_BGR2GRAY)
grayB = cv2.cvtColor(img, cv2.COLOR_BGR2GRAY)

# 计算两个灰度图像之间的结构相似度
(score, diff) = structural_similarity(grayA, grayB, win_size=101, full=True)
diff = (diff * 255).astype("uint8")
cv2.namedWindow("diff", cv2.WINDOW_NORMAL)
cv2.imshow("diff", diff)
print("SSIM:{}".format(score))

# 找到不同的轮廓以致于可以在表示为 '不同'的区域放置矩形
# 全局自适应阈值分割(二值化),返回值有两个,第一个是阈值,第二个是二值图像
dst = cv2.threshold(diff, 0, 255, cv2.THRESH_BINARY_INV | cv2.THRESH_OTSU)[1]
cv2.namedWindow("threshold", cv2.WINDOW_NORMAL)
cv2.imshow('threshold', dst)
# findContours找轮廓,返回值有两个,第一个是轮廓信息,第二个是轮廓的层次信息(“树”状拓扑结构)
# cv2.RETR_EXTERNAL:只检测最外层轮廓
# cv2.CHAIN_APPROX_SIMPLE:压缩水平方向、垂直方向和对角线方向的元素,保留该方向的终点坐标,如矩形的轮廓可用4个角点表示
contours, hierarchy = cv2.findContours(dst.copy(), cv2.RETR_EXTERNAL, cv2.CHAIN_APPROX_SIMPLE)
print(contours)
newimg = np.zeros(dst.shape, np.uint8)  # 定义一个和图像分割处理后相同大小的黑色图
# drawContours画轮廓,将找到的轮廓信息画出来
cv2.drawContours(newimg, contours, -1, (255, 255, 255), 1)
cv2.namedWindow("contours", cv2.WINDOW_NORMAL)
cv2.imshow('contours', newimg)
# cnts = cnts[0] if imutils.is_cv3() else cnts[0]    取findContours函数的第一个返回值,即取轮廓信息

# 找到一系列区域,在区域周围放置矩形
for c in contours:
    (x, y, w, h) = cv2.boundingRect(c)  # boundingRect函数:计算轮廓的垂直边界最小矩形,矩形是与图像上下边界平行的
    cv2.rectangle(src, (x, y), (x + w, y + h), (0, 255, 0), 2)  # rectangle函数:使用对角线的两点pt1,pt2画一个矩形轮廓
    cv2.rectangle(img, (x, y), (x + w, y + h), (0, 255, 0), 2)  # 画矩形的图, pt1, pt2,(对角线两点的坐标), 矩形边框的颜色,矩形边框的粗细

end = time.time()
print(end - start)
# 用cv2.imshow 展现最终对比之后的图片
cv2.namedWindow("right", cv2.WINDOW_NORMAL)
cv2.imshow('right', src)
cv2.namedWindow("left", cv2.WINDOW_NORMAL)
cv2.imshow('left', img)
cv2.waitKey(0)
cv2.destroyAllWindows()
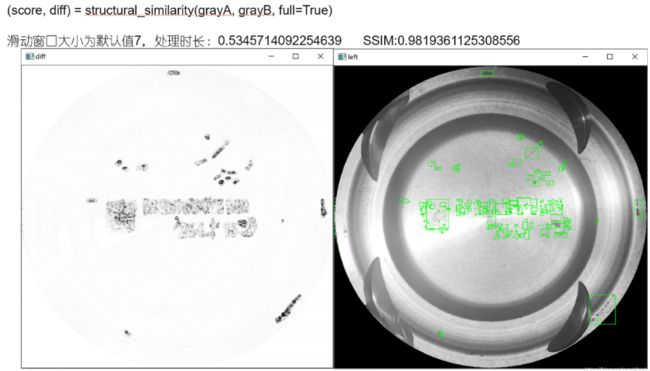
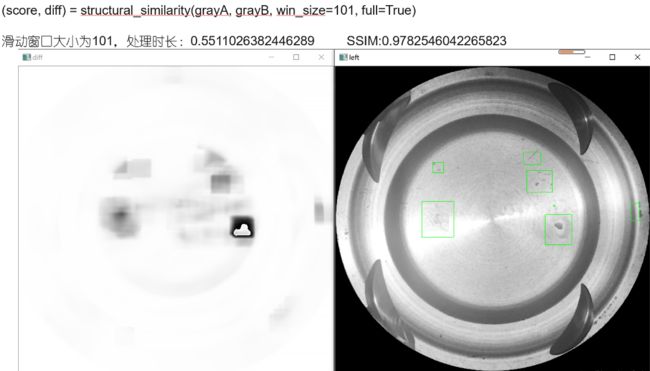
效果展示:
参考博客
计算两幅图像的相似度总结_JerrySing的博客-CSDN博客_compare_ssim
Python计算图片之间的相似度_~小疯子~的博客-CSDN博客_python 识别图片相似度
有史以来最全的图像相似度算法_小殊小殊的博客-CSDN博客_图片相似度
(超详细)实现计算图片相似度MSE和PSNR_Natuki丶的博客-CSDN博客_计算psnr和mse
Python批量计算PSNR、SSIM、MSE_杨杨杨Garrick的博客-CSDN博客
图像质量评价指标MSE/PSNR/SSIM_秋天的从从的博客-CSDN博客_图像mse
图片相相似度计算(Hash、SSIM、compareHist)_南苏月的博客-CSDN博客_图像相似度计算公式
【OpenCV-Python】:图像PSNR、SSIM、MSE计算_米开朗琪罗~的博客-CSDN博客_图像的mse计算
Python计算Y通道或者RGB通道的PSNR_SSIM_未知量0520的博客-CSDN博客_folder_gt
scikit-image 0.18.0版本计算PSNR、SSIM、MSE(Python代码)_YZBshanshan的博客-CSDN博客_scikit-image版本
图像质量评估中的PSNR和SSIM的定义,公式和含义_·如烟·的博客-CSDN博客_psnr定义
【基础知识】图像去噪评估—PSNR和SSIM - 梁君牧 - 博客园 (cnblogs.com)
SSIM---结构相似性算法(OpenCV+Python)_hedgehog__的博客-CSDN博客_python 结构相似性
图片相似度计算方法总结 - 知乎 (zhihu.com)
相似度计算方法(三) 余弦相似度_潘永青的博客-CSDN博客_余弦相似度
图片的相似度--直方图距离 - 知乎 (zhihu.com)

