TensorFlow2.0入门到进阶2.3 —— 一个服装分类项目轻松入门TensorFlow
本项目将用采用sklearn自带的数据集,带大家轻松入门TensorFlow。
开发环境:
tensorflow 2.0.0
sklearn 0.21.3
文章目录
- 1、导入所需模块
- 2、加载数据集
- 3、数据查看
- 4、创建训练模型(神经网络)
- 5、查看模型(神经网络)
- 6、模型训练
- 7、结果观察
1、导入所需模块
首先,导入所需模块,并打印各个模块的版本号等信息,有些模块本节可能未涉及到,但是未来会用,这里也先导入了,之后写程序直接复制粘贴即可,很方便。
import matplotlib as mpl
import matplotlib.pyplot as plt
#为了在jupyter notebook中画图
%matplotlib inline
import numpy as np
import sklearn
import pandas as pd
import os
import sys
import time
import tensorflow as tf
from tensorflow import keras

print(tf.__version__)
print(sys.version_info)
for module in mpl,np,pd,sklearn,tf,keras:
    print(module.__name__,module.__version__)
如果出现那个库没有安装的话,可以参考下面链接进行安装:
https://blog.csdn.net/caoyuan666/article/details/104935862
2、加载数据集
这里利用的是sklearn自带的一个数据集fashion_mnist,该数据集是一个不同服装种类的分类问题数据集。包含60,000个示例的训练集和10,000个示例的测试集。 每个示例都是一个28x28灰度图像,与来自10个类别的标签相关联。
如果想单独下载数据集(本项目没有必要),数据集地址:https://github.com/zalandoresearch/fashion-mnist
这里如果是第一次运行,请保持联网,执行第一条语句时将会自动从网络中下载fashion_mnist数据集,可能会花费一段时间,一般几分钟即可,之后再执行就会直接调用,无需等待。
fashion_mnist=keras.datasets.fashion_mnist
(x_train_all,y_train_all),(x_test,y_test)=fashion_mnist.load_data()
x_valid,x_train=x_train_all[:5000],x_train_all[5000:]
y_valid,y_train=y_train_all[:5000],y_train_all[5000:]

print(x_valid.shape,y_valid.shape)
print(x_train.shape,y_train.shape)
print(x_test.shape,y_test.shape)
加载数据后,在训练样本中抽取前5000个样本作文验证集,方便训练是用。
3、数据查看
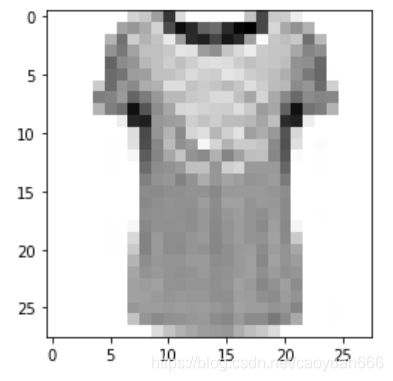
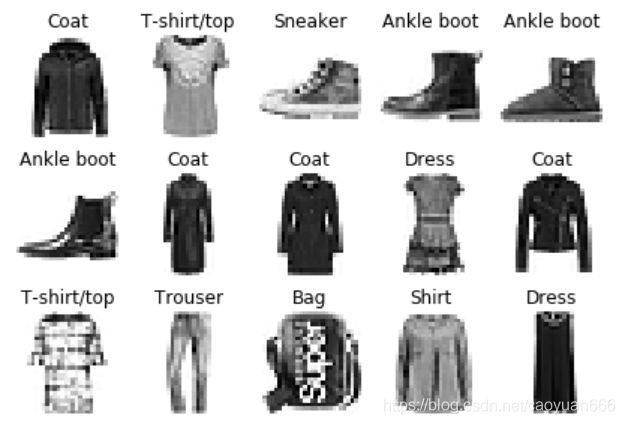
这里可以看一下数据集中的图片是什么样子的,首先查看单张图片。
def show_single_image(img_arr):
    #cmap为颜色图片,默认为RGB,binary为黑白图片
    plt.imshow(img_arr,cmap='binary')
    plt.show()
show_single_image(x_train[1])
#n_rows:行  n_cols:列   class_names:真实的类别名数组,非one-hot编码标签
def show_images(n_rows,n_cols,x_data,y_data,class_names):
    #assert:后面的条件成立则执行,不成立则报错
    assert len(x_data)==len(y_data)
    assert n_rows*n_cols<=len(x_data)
    #指定画布大小
    plt.figure(figsize=(n_cols*1.4,n_rows*1.6))
    for row in range(n_rows):
        for col in range(n_cols):
            index=row*n_cols+col
            #index要从1开始!!!
            plt.subplot(n_rows,n_cols,index+1)
            plt.imshow(x_data[index],cmap='binary',
                      interpolation='nearest')
            #interpolation:缩放图片的方法,nearest为采用最近的像素点
            #关闭横纵坐标
            plt.axis('off')
            plt.title(class_names[y_data[index]])
    plt.show()


class_names=['T-shirt/top','Trouser','Pullover','Dress','Coat',
            'Sandal','Shirt','Sneaker','Bag','Ankle boot']

show_images(3,5,x_train,y_train,class_names)
4、创建训练模型(神经网络)
#tf.keras.models.Sequential

#创建一个Sequential对象
model=keras.models.Sequential()
#添加输入层,输入的图片展开,Flatten为展平
model.add(keras.layers.Flatten(input_shape=[28,28]))
#加入两个个全连接层,单元数300,激活函数为'relu'
#和一个输出层,labels的种类为10,所以输出为10,激活函数为'softmax'
model.add(keras.layers.Dense(300,activation='relu'))
model.add(keras.layers.Dense(100,activation='relu'))
model.add(keras.layers.Dense(10,activation='softmax'))

'''
#也可以采用直接创建的方式
model=keras.models.Sequential([
    keras.layers.Flatten(input_shape=[28,28]),
    keras.layers.Dense(300,activation='relu'),
    keras.layers.Dense(100,activation='relu'),
    keras.layers.Dense(10,activation='softmax')
])
'''
model.compile(loss='sparse_categorical_crossentropy',
              optimizer='adam',
              metrics=['accuracy'])
激活函数:
- relu:y=max(0,x)
- softmax:将向量变成概率分布 x=[x1,x2,x3]
y=[ex1 /sum,ex2 /sum,ex3 /sum]
sum=ex1+ex2+e^x3
参数介绍:
- categorical_crossentropy:交叉熵损失函数
- sparse:由于本数据集的y为长度等于样本数量的向量,每个sample一个值y -> index y -> one_hot ->[] 这里y还是一个数,要用,如果是热编码后,无需加sparse
- optimizer:为模型求解方法,即优化方法,sgd:为随机梯度下降,用于陷入局部极小点 adam
- metrics:关心的指标 ,accuracy:准确性
5、查看模型(神经网络)
上一步已经创建了一个神经网络,相信大家都比较好奇创建的模型是什么样子的吧,下面将通过函数查看构建的模型:
#查看模型有多少层
model.layers
结果:
[<tensorflow.python.keras.layers.core.Flatten at 0x19bf7d48c88>,
 <tensorflow.python.keras.layers.core.Dense at 0x19bf7d48e88>,
 <tensorflow.python.keras.layers.core.Dense at 0x19bf8758ac8>,
 <tensorflow.python.keras.layers.core.Dense at 0x19bffb64288>]
查看每一次网络参数:
model.summary()
结果:
Model: "sequential"
_________________________________________________________________
Layer (type)                 Output Shape              Param #
=================================================================
flatten (Flatten)            (None, 784)               0
_________________________________________________________________
dense (Dense)                (None, 300)               235500
_________________________________________________________________
dense_1 (Dense)              (None, 100)               30100
_________________________________________________________________
dense_2 (Dense)              (None, 10)                1010
=================================================================
Total params: 266,610
Trainable params: 266,610
Non-trainable params: 0
第一层 (None,784)即样本数784的矩阵,784是2828,每一张图片的像素点数量。
第二层 第一次数据经过第二层的全连接层,变为samples数300的矩阵
[None,784] * W + b -> [None, 300]
其中W.shape=[784,300]
b.shape=[300]
param(参数量):784300+300=235500
6、模型训练
history=model.fit(x_train,y_train,epochs=10,
         validation_data=(x_valid,y_valid))
epochs:数据集遍历次数
validation:用验证集做验证
返回值为运行中的数据结果
7、结果观察
print(type(history))
print(history.history)
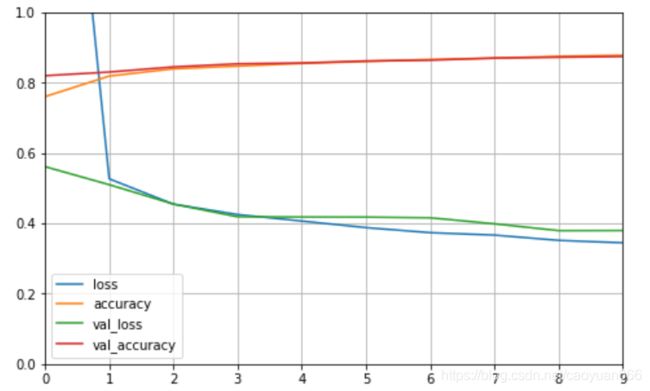
这里可以观察到训练过程中的各个参数,包括损失函数、准确率等。
一般大家通过统计图观察到的结果最为直观,下面将把训练过程中的各个数据通过图标展示出来:
def plot_learning_curves(history):
    #设置画布大小为8和5
    pd.DataFrame(history.history).plot(figsize=(8,5))
    #显示网格
    plt.grid(True)
    #set_ylim为设置y坐标轴的范围
    plt.gca().set_ylim(0,1)
    plt.show()

plot_learning_curves(history)


