python机器学习之sklearn分类、聚类、回归、模型选择、降维、数据预处理
文章目录
- 一. Sklearn工具包介绍
- 1.2 模型评估: 量化预测的质量
- 二. SciKit-Learn数据集
- 三. 模型评估-交叉验证(cross validation)
- 四. 模型评估——混淆矩阵(Confusion Matrix)
- 五. 模型评价指标——Precision/Recall
-
- 5.1 准确率、精确率、召回率、F值对比
- 5.2 精确率、召回率计算公式
-
- 5.4.1 precision_score函数
- 5.4.2 recall_score函数
- 六. 模型评价——选择合适阈值
-
- 6.2 recall变化precision的变化情况
- 七. 模型评价——ROC curves
-
- 7.2 ROC-AUC(ROC曲线下面积)
一. Sklearn工具包介绍
scikit-learn,又写作sklearn,是一个开源的基于python语言的机器学习工具包。它通过NumPy, SciPy和Matplotlib等python数值计算的库实现高效的算法应用,并且涵盖了几乎所有主流机器学习算法。
官网: scikit-learn: machine learning in Python — scikit-learn 1.1.1 documentation
搜索相关语法:
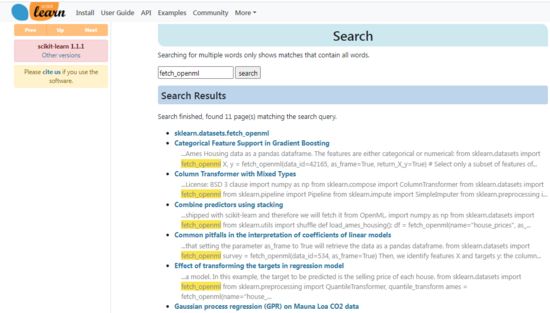
https://scikit-learn.org/stable/search.html?q=fetch_openml
安装sklearn
# 不是 pip install -U sklearn
pip install -U scikit-learn
1.1 常用模块
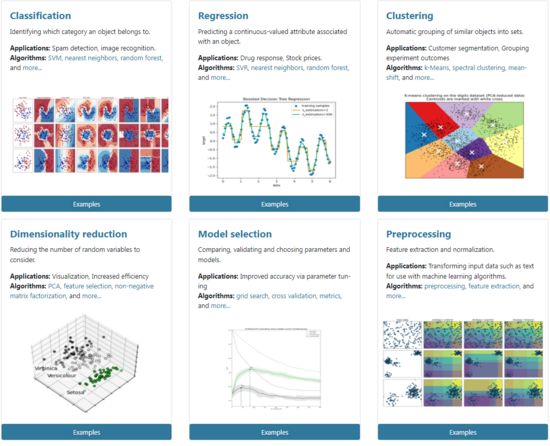
从官网的首页我们可以看到常用的模块如下图所示:
Sklearn中常用模块:分类(Classification)、回归(Regression)、聚类(Clustering)、降维(Dimensionality reduction)、模型选择(Model selection)、数据预处理(Preprocessing)。
-
分 类 \color{red}{分类} 分 类 :识别某个对象属于哪个类别,常用的算法有:SVM(支持向量机)、nearest neighbors(最近邻)、random forest(随机森林),常见的应用有:垃圾邮件识别、图像识别。
-
回 归 \color{red}{回归} 回 归 :预测与对象相关联的连续值属性,常见的算法有:SVR(支持向量机)、 ridge regression(岭回归)、Lasso,常见的应用有:药物反应,预测股价。
-
聚 类 \color{red}{聚类} 聚 类 :将相似对象自动分组,常用的算法有:k-Means、 spectral clustering、mean-shift,常见的应用有:客户细分,分组实验结果。
-
降 维 \color{red}{降维} 降 维 :减少要考虑的随机变量的数量,常见的算法有:PCA(主成分分析)、feature selection(特征选择)、non-negative matrix factorization(非负矩阵分解),常见的应用有:可视化,提高效率。
-
模 型 选 择 \color{red}{模型选择} 模 型 选 择 :比较,验证,选择参数和模型,常用的模块有:grid search(网格搜索)、cross validation(交叉验证)、 metrics(度量)。它的目标是通过参数调整提高精度。
-
预 处 理 \color{red}{预处理} 预 处 理 :特征提取和归一化,常用的模块有:preprocessing,feature extraction,常见的应用有:把输入数据(如文本)转换为机器学习算法可用的数据。
1.2 模型评估: 量化预测的质量
有 3 种不同的 API 用于评估模型预测的质量:
- Estimator score method(估计器得分的方法) : Estimators(估计器)有一个
score(得分)方法,为其解决的问题提供了默认的 evaluation criterion (评估标准)。 在这个页面上没有相关讨论,但是在每个 estimator (估计器)的文档中会有相关的讨论。 - Scoring parameter(评分参数) : Model-evaluation tools (模型评估工具)使用 cross-validation (如 model_selection.cross_val_score 和 model_selection.GridSearchCV ) 依靠 internal scoring strategy (内部 scoring(得分) 策略)。这在 scoring 参数: 定义模型评估规则 部分讨论。
- Metric functions(指标函数) :
metrics模块实现了针对特定目的评估预测误差的函数。这些指标在以下部分部分详细介绍 分类指标 , 多标签排名指标 , 回归指标 和 聚类指标 。
二. SciKit-Learn数据集
sklearn.datasets 模块 包含加载数据集的实用程序,包括加载和获取流行引用数据集的方法。它还具有一些人工数据生成器。
2.1 加载数据集
数据科学的第一步通常是加载数据,首先需要学会如何使用SciKit-Learn来加载数据集。
数据集的来源通常是自己准备或第三方处获取。非研究人员,通常是从第三方获取数据。可以下载获取数据集的网站:
- openml
- UCI 机器学习库
- Kaggle
SciKit-Learn库中,也有自带一些数据集可以尝试加载。
datasets 模块中也包含了获取其他流行数据集的方法,例如 datasets.fetch_openml 可以从 openml 存储库获取数据集。
代码:
def get_data():
    # 通过名称或数据集ID从openml获取数据集
    from sklearn.datasets import fetch_openml


    # Mnist 数据是图像数据:(28,28,1)的灰度图
    mnist = fetch_openml('mnist_784')
    # print(mnist)

    X, y = mnist["data"], mnist["target"]
    print (X.shape)    # (70000, 784)
    print (y.shape)    # (70000,)

get_data()
测试记录:
(70000, 784)
(70000,)
2.2 数据集切分
将数据集切分为训练集、测试集。
一般使用:
from sklearn.model_selection import train_test_split
# 划分训练集和测试集
X_train, X_test, y_train, y_test = train_test_split(X, y, test_size=0.1, random_state=42)
代码:
from sklearn.datasets import fetch_openml
import numpy as np

def get_data():
    # Mnist 数据是图像数据:(28,28,1)的灰度图
    mnist = fetch_openml('mnist_784')
    # print(mnist)

    X, y = mnist["data"], mnist["target"]
    X.shape    # (70000, 784)
    y.shape    # (70000,)

    # 切分为训练集和测试集
    X_train, X_test, y_train, y_test = X[:60000], X[60000:], y[:60000], y[60000:]

    # 洗牌操作,打乱当前数据集顺序
    shuffle_index = np.random.permutation(60000)
    X_train, y_train = X_train.iloc[shuffle_index], y_train.iloc[shuffle_index]   # 索引值回传相当于洗牌操作

    print(X_train, y_train)


get_data()
测试记录:
三. 模型评估-交叉验证(cross validation)
3.1 交叉验证定义
交叉验证是用来验证分类器的性能一种统计分析方法,基本思想是把在某种意义下将原始数据(data set)进行分组,一部分做为训练集(training set),另一部分做为测试集(validation set),首先用训练集对分类器进行训练,在利用测试集来测试训练得到的模型(model),以此来做为评价分类器的性能指标。
3.2 三种实现方法
3.2.1 留出法(holdout cross validation)
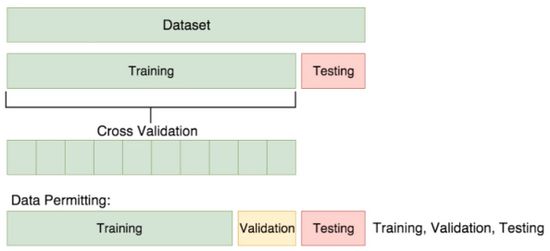
将原始数据集分为三部分:训练集、验证集和测试集。训练集用于训练模型,验证集用于模型的参数选择配置,测试集对于模型来说是未知数据,用于评估模型的泛化能力。
优点:操作简单
缺点:样本数比例,模型对数据划分敏感,分成三部分使得训练数据变少。
3.2.2 k折交叉验证(k-fold cross validation)
将数据集无替换的随机分为k份,k-1份用来训练模型,剩下一份用来模型性能评估。重复k次,得到k个模型和性能评估结果。得到k个性能评估后,取平均求出最终性能评估。即:
-
第一步:不重复抽样将原始数据随机分为k份。
-
第二步:每一次挑选其中 1 份作为测试集,剩余k-1份作为训练集用于模型训练。
-
第三步:重复第二步k次,每个子集都有一次作为测试集,其余子集作为训练集。在每个训练集上训练后得到一个模型,用这个模型在相应测试集上测试,计算并保存模型的评估指标。
-
第四步:计算k组测试结果的平均值作为模型精度的估计,并作为当前k折交叉验证下模型的性能指标。
优点:分组后取平均减少方差,使得模型对数据划分不敏感。
缺点:k取值需要尝试。
分成五份,示例如下所示:
3.2.3 留一法(leave one out cross validation)
当k折交叉验证法的k=m,m为样本总数时,称为留一法,即每次的测试集都只有一个样本,要进行m次训练和预测。
优点:适合数据缺乏时使用
缺点:计算繁琐,训练复杂度增加。
3.3 交叉验证代码实现
代码:
import numpy as np
import os
from sklearn.datasets import fetch_openml

import matplotlib as mpl
import matplotlib.pyplot as plt
import warnings

mpl.rcParams['axes.labelsize'] = 14
mpl.rcParams['xtick.labelsize'] = 12
mpl.rcParams['ytick.labelsize'] = 12

warnings.filterwarnings('ignore')
np.random.seed(42)

# 保存图片的地址
PROJECT_ROOT_DIR = "."
CHAPTER_ID = "classification"

def sort_by_target(mnist):
    reorder_train = np.array(sorted([(target, i) for i, target in enumerate(mnist.target[:60000])]))[:, 1]
    reorder_test = np.array(sorted([(target, i) for i, target in enumerate(mnist.target[60000:])]))[:, 1]
    mnist.data[:60000] = mnist.data.iloc[reorder_train]
    mnist.target[:60000] = mnist.target.iloc[reorder_train]
    mnist.data[60000:] = mnist.data.iloc[reorder_test + 60000]
    mnist.target[60000:] = mnist.target.iloc[reorder_test + 60000]


def get_data():
    # Mnist 数据是图像数据:(28,28,1)的灰度图
    """注意:
    fetch_openml返回的是未排序的MNIST数据集。
    fetch_mldata返回按目标排序的数据集。
    在SciKit-Learn 0.20后已经弃用fetch_mldata(),需要使用fetch_openml()。
    如果要得到和之前相同的结果,需要排序数据集。
    """
    mnist = fetch_openml('mnist_784', version=1, cache=True)   # fetch_openml返回一个未排序的数据集
    mnist.target = mnist.target.astype(np.int8)
    sort_by_target(mnist)
    # print(mnist.data.shape)    # (70000, 784)

    X, y = mnist["data"], mnist["target"]
    #print(X.shape)    # (70000, 784)
    #print(y.shape)    # (70000,)

    # 切分为训练集和测试集
    X_train, X_test, y_train, y_test = X[:60000], X[60000:], y[:60000], y[60000:]

    # 洗牌操作,打乱当前数据集顺序
    shuffle_index = np.random.permutation(60000)
    X_train, y_train = X_train.iloc[shuffle_index], y_train.iloc[shuffle_index]   # 索引值回传相当于洗牌操作
    #print(X_train, y_train)

    # 训练二分类器
    y_train_5 = (y_train == 5)   # 修改便签为是否等于5
    y_test_5 = (y_test == 5)

    from sklearn.linear_model import SGDClassifier     # 引入线性分类器

    # 使用scikit-learn的SGDClassifier类来创建分类器,区分图片是否是数字5
    sgd_clf = SGDClassifier(
        max_iter=5,       # 训练迭代次数
        tol=-np.infty,
        random_state=42   # 传入随机种子,每次随机结果一样
    )
    # fit方法:用随机梯度下降法拟合线性模型
    sgd_clf.fit(X_train, y_train)

    # predict方法:预测当前的结果
    sgd_clf.predict([X.iloc[35000]])

    # 采用准确率为衡量指标查看交叉验证的结果
    from sklearn.model_selection import cross_val_score
    cross_val_score(sgd_clf, X_train, y_train_5, cv=3, scoring='accuracy')
    """
    [0.96225 0.9645  0.94765]
    """

    # StratifiedKFold方法:按自己的想法平均切割数据集
    from sklearn.model_selection import StratifiedKFold
    from sklearn.base import clone         # 引入克隆可以在估算器中对模型进行深层复制,构造一个具有相同参数的新估算器

    skfolds = StratifiedKFold(
        n_splits=3,
        random_state=42,     # 设置随机种子
        shuffle=True
    )
    for train_index, test_index in skfolds.split(X_train, y_train_5):     # 切割训练的数据集和标签集
        clone_clf = clone(sgd_clf)    # 克隆构建模型
        X_train_folds = X_train.iloc[train_index]
        y_train_folds = y_train_5.iloc[train_index]
        X_test_folds = X_train.iloc[test_index]
        y_test_folds = y_train_5.iloc[test_index]

        # fit方法:用随机梯度下降法拟合线性模型
        clone_clf.fit(X_train_folds, y_train_folds)
        # 预测
        y_pred = clone_clf.predict(X_test_folds)
        # 做对了的个数
        n_correct = sum(y_pred == y_test_folds)
        print(n_correct / len(y_pred))


get_data()
测试记录:
0.88805
0.8514
0.8725
上面先是使用了sklearn.model_selection.cross_val_score()方法查看了交叉验证结果。
随后使用StratifiedKFold方法按自己的想法平均切割数据集,计算做对了的个数/预测数,计算得到交叉验证结果。
3.3.1 cross_val_score函数
使用交叉检验最简单的方法是在估计器上调用cross_val_score函数。该函数可返回交叉验证每次运行的评分数组。
def cross_val_score(estimator, X, y=None, *, groups=None, scoring=None,
                    cv=None, n_jobs=None, verbose=0, fit_params=None,
                    pre_dispatch='2*n_jobs', error_score=np.nan):
参数:
- estimator:数据对象
- X:数据
- y:预测数据
- scoring:定义模型评估规则
- cv:交叉验证生成器或可迭代的次数
- n_jobs:同时工作的cpu个数(-1代表全部)
- verbose:详细程度
- fit_params:传递给估计器的拟合方法的参数
- pre_dispatch:控制并行执行期间调度的作业数量。减少这个数量对于避免在CPU发送更多作业时CPU内存消耗的扩大是有用的。该参数可以是:
9.1) 没有,在这种情况下,所有的工作立即创建并产生。将其用于轻量级和快速运行的作业,以避免由于按需产生作业而导致延迟
9.2) 一个int,给出所产生的总工作的确切数量
9.3) 一个字符串,给出一个表达式作为n_jobs的函数,如’2 * n_jobs’
3.3.2 StratifiedKFold函数
分层K折交叉验证器:提供训练/测试索引以将数据拆分为训练/测试集。此交叉验证对象是KFold的变体,它返回分层的折叠。折叠是通过保留每个类别的样品百分比来进行的。
class StratifiedKFold(_BaseKFold):
    @_deprecate_positional_args
    def __init__(self, n_splits=5, *, shuffle=False, random_state=None):
        super().__init__(n_splits=n_splits, shuffle=shuffle,
                         random_state=random_state)
参数:
- n_splits:折数(int数据类型),默认为5,至少为2。(0.22版本中,将默认值从3改为5)
- shuffle:bool数据类型,默认为False。在拆分成批次之前是否对每个样本进行混洗。
- random_state:int或RandomState实例,默认为None。当shuffle为True时,random_state会影响索引的顺序,从而控制每个类别的每个折叠的随机性。否则,保留random_state为None。为多个函数调用传递可重复输出的int值。
四. 模型评估——混淆矩阵(Confusion Matrix)
混淆矩阵是机器学习中总结分类模型预测结果的情形分析表,以矩阵形式将数据集中的记录按照真实的类别与分类模型预测的类别判断两个标准进行汇总。
其中矩阵的行表示真实值,矩阵的列表示预测值。
4.1 案例
已知条件:班级总人数100人,其中男生80人,女生20人。
目标:找出所有的女生。
结果:从班级中选择了50人,其中20人是女生,还错误的把30名男生挑选出来了。
通过这张表,我们可以很容易得到这几个值:TP=20;FP=30;FN=0;TN=50;
-
TP(True Positive):将正类预测为正类数,positive 表示他判定为女生。 true表示,判定是对的。 TP=20
-
FN(False Negative):将正类预测为负类数,negative 表示他判定为男生。 false表示,判定是错的。 FN=0
-
FP(False Positive):将负类预测为正类数, positive 表示他判定为女生。 false表示,判定是错的。 FP=30
-
TN(True Negative):将负类预测为负类数,negative 表示他判定为男生。 true表示, 他的判定是对的。 TN=50
4.2 混淆矩阵代码实现
代码:
import numpy as np
import os
from sklearn.datasets import fetch_openml
import matplotlib as mpl
import matplotlib.pyplot as plt
import warnings

mpl.rcParams['axes.labelsize'] = 14
mpl.rcParams['xtick.labelsize'] = 12
mpl.rcParams['ytick.labelsize'] = 12

warnings.filterwarnings('ignore')
np.random.seed(42)

# 保存图片的地址
PROJECT_ROOT_DIR = "."
CHAPTER_ID = "classification"


def sort_by_target(mnist):
    reorder_train = np.array(sorted([(target, i) for i, target in enumerate(mnist.target[:60000])]))[:, 1]
    reorder_test = np.array(sorted([(target, i) for i, target in enumerate(mnist.target[60000:])]))[:, 1]
    mnist.data[:60000] = mnist.data.iloc[reorder_train]
    mnist.target[:60000] = mnist.target.iloc[reorder_train]
    mnist.data[60000:] = mnist.data.iloc[reorder_test + 60000]
    mnist.target[60000:] = mnist.target.iloc[reorder_test + 60000]


def get_data():
    # Mnist 数据是图像数据:(28,28,1)的灰度图
    """注意:
    fetch_openml返回的是未排序的MNIST数据集。
    fetch_mldata返回按目标排序的数据集。
    在SciKit-Learn 0.20后已经弃用fetch_mldata(),需要使用fetch_openml()。
    如果要得到和之前相同的结果,需要排序数据集。
    """
    mnist = fetch_openml('mnist_784', version=1, cache=True)   # fetch_openml返回一个未排序的数据集
    mnist.target = mnist.target.astype(np.int8)
    sort_by_target(mnist)
    # print(mnist.data.shape)    # (70000, 784)

    X, y = mnist["data"], mnist["target"]
    #print(X.shape)    # (70000, 784)
    #print(y.shape)    # (70000,)

    # 切分为训练集和测试集
    X_train, X_test, y_train, y_test = X[:60000], X[60000:], y[:60000], y[60000:]

    # 洗牌操作,打乱当前数据集顺序
    shuffle_index = np.random.permutation(60000)
    X_train, y_train = X_train.iloc[shuffle_index], y_train.iloc[shuffle_index]   # 索引值回传相当于洗牌操作
    #print(X_train, y_train)

    # 训练二分类器
    y_train_5 = (y_train == 5)   # 修改便签为是否等于5
    y_test_5 = (y_test == 5)

    from sklearn.linear_model import SGDClassifier     # 引入线性分类器

    # 使用scikit-learn的SGDClassifier类来创建分类器,区分图片是否是数字5
    sgd_clf = SGDClassifier(
        max_iter=5,       # 训练迭代次数
        tol=-np.infty,
        random_state=42   # 传入随机种子,每次随机结果一样
    )
    # fit方法:用随机梯度下降法拟合线性模型
    sgd_clf.fit(X_train, y_train)

    from sklearn.model_selection import cross_val_predict

    y_train_pred = cross_val_predict(sgd_clf, X_train, y_train_5, cv=3)
    #print(y_train_pred.shape)     # (60000,):60000个样本的预测结果
    #print(X_train.shape)       # (60000, 784):训练样本也是60000个,与预测结果数量一致

    from sklearn.metrics import confusion_matrix

    print (confusion_matrix(y_train_5, y_train_pred))
    """
    array([[53417  1162],
           [1350  4071]], dtype=int64)
    """


get_data()
测试记录:
[[49747 4832]
[ 4922 499]]
4.2.1 cross_val_predict函数
到经过K折交叉验证计算得到的每个训练验证的输出预测。
分别在K-1上训练模型,在余下的1折上验证模型,并将余下1折中样本的预测输出作为最终输出结果的一部分
def cross_val_predict(estimator, X, y=None, *, groups=None, cv=None,
                      n_jobs=None, verbose=0, fit_params=None,
                      pre_dispatch='2*n_jobs', method='predict'):
cross_val_predict 与 cross_val_score 很相像,不过不同于返回的是评测效果, cross_val_predict 返回的是 estimator 的分类结果(或回归值),这个对于后期模型的改善很重要, 可 以 通 过 该 预 测 输 出 对 比 实 际 目 标 值 , 准 确 定 位 到 预 测 出 错 的 地 方 , 为 我 们 参 数 优 化 及 问 题 排 查 十 分 的 重 要 \color{red}{可以通过该预测输出对比实际目标值,准确定位到预测出错的地方,为我们参数优化及问题排查十分的重要} 可 以 通 过 该 预 测 输 出 对 比 实 际 目 标 值 , 准 确 定 位 到 预 测 出 错 的 地 方 , 为 我 们 参 数 优 化 及 问 题 排 查 十 分 的 重 要
4.2.2 confusion_matrix函数
计算混淆矩阵以评估分类的准确性。
def confusion_matrix(y_true, y_pred, *, labels=None, sample_weight=None,
                     normalize=None):
- y_true:是样本真实分类结果
- y_pred 是样本预测分类结果
- labels是所给出的类别,通过这个可对类别进行选择
- sample_weight 是样本权重。
4.2.3 confusion_matrix返回结果解析
返回结果是:array([[53417 1162],[1350 4071]], dtype=int64)。
negative class [[true negative, false posotives],
positive class [false negative, true positives]]
- true negatives: 53417个数据被正确的分为非5类别
- false positves: 1162个被错误的分为5类别
- false negatives: 1350个被错误的分为非5类别
- true positives: 4071个被正确的分为5类别
一个完美的分类器应该只有true positives 和 true negatives,即主对角线元素不为0,其余元素为0。
五. 模型评价指标——Precision/Recall
机器学习(ML),自然语言处理(NLP),信息检索(IR)等领域,评估(Evaluation)是一个必要的 工作,而其评价指标往往有如下几点:准确率(Accuracy),精确率(Precision),召回率(Recall)和F1-Measure。
5.1 准确率、精确率、召回率、F值对比
-
准确率/正确率(Accuracy)= 所有预测正确的样本 / 总的样本 (TP+TN)
-
精确率(Precision) = 正类预测为正类(TP) / 所有预测为正类(TP+TN)
-
召回率(Recall) = 正类预测为正类(TP) / 所有真正的正类(TP+FN)
-
F值(F-Measure) = 精确率 * 召回率 * 2 / (精确率 + 召回率) —— F值即为精确率和召回率的调和平均值
5.2 精确率、召回率计算公式
5.2.1 精确率计算公式
理解:
-
TP+FP: 也就是全体Positive, 也就是预测的图片中是正类的图片的数目
-
TP: 也就是正类也被预测为正类的图片的个数
总之:预测正确的图片个数占总的正类预测个数的比例(从预测结果角度看,有多少预测是准确的)
5.2.2 召回率计算公式
理解:
-
TP+FN: 也就是全体完全满足图片标注的图片的个数
-
TP:正类被预测为正类的图片个数
总之:确定了正类被预测为正类图片占所有标注图片的个数(从标注角度看,有多少被召回)
5.3 F1 score指标
P和R指标有时候会出现的矛盾的情况,这样就需要综合考虑他们,最常见的方法就是F-Measure(又称为F-Score)。
将Precision 和 Recall 结合到一个称为F1 score 的指标,调和平均值给予低值更多权重。因此,如果召回和精确度都很高,分类器将获得高F1分数。
F-Measure是Precision和Recall加权调和平均:
当参数α=1时,就是最常见的F1,也即
可知F1综合了P和R的结果,当F1较高时则能说明试验方法比较有效。
5.4 代码实现
def get_data():
    """代码略"""

    # 准确率(Precision)和召回率(Recall)
    from sklearn.metrics import precision_score, recall_score

    print(precision_score(y_train_5, y_train_pred))   # 0.7779476399770686
    print(recall_score(y_train_5, y_train_pred))      # 0.7509684560044272

    # F1 score
    from sklearn.metrics import f1_score

    print(f1_score(y_train_5, y_train_pred))          # 0.7642200112633752

get_data()
测试记录:
0.09360345151003564
0.09204943737317837
0.09281994047619047
5.4.1 precision_score函数
计算精确率。精度是 TP/(TP+FP) 比率,TP是 true positives 与 FP是 false positives。
def precision_score(y_true, y_pred, *, labels=None, pos_label=1,
                    average='binary', sample_weight=None,
                    zero_division="warn"):
参数:
- y_true:真实标签
- y_pred:预测标签
- average:评价值的平均值的计算方式。
5.4.2 recall_score函数
计算召回率。召回率是 TP/(TP+FN)的比率,FN是false negatives。
def recall_score(y_true, y_pred, *, labels=None, pos_label=1, average='binary',
                 sample_weight=None, zero_division="warn"):
参数:
- y_true:真实标签
- y_pred:预测标签
- average:评价值的平均值的计算方式。
5.4.3 f1_score函数
计算F1 score,也称为F-score或F-measure。
F1 = 2 * (precision * recall) / (precision + recall)
def f1_score(y_true, y_pred, *, labels=None, pos_label=1, average='binary',
             sample_weight=None, zero_division="warn"):
六. 模型评价——选择合适阈值
Scikit-Learn不允许直接设置阈值,但它可以得到决策分数,调用其decision_function()方法,而不是调用分类器的predict()方法,该方法返回每个实例的分数,然后使用想要的阈值根据这些分数进行预测。
对于这种分类问题,不同的分类阈值可以给出不同的输出结果,但是在sklearn中,无法直接通过直接修改阈值而输出结果,但是我们可以首先得到决策函数得到的结果,然后再手动确定阈值,得到预测的结果。
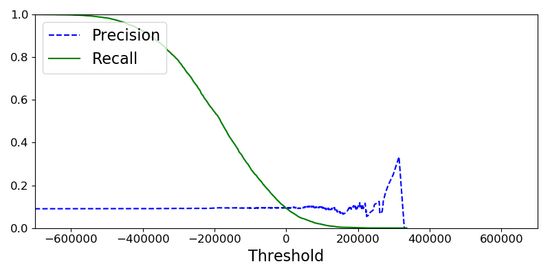
为了使得模型更加完善,我们需要选择合适的阈值,即使得准确率和召回率都比较大,因此在这里我们可以首先绘制出准确率和召回率随阈值的变化关系,然后再选择合适的阈值。
6.1 选择阈值示例
代码:
import numpy as np
import os
from sklearn.datasets import fetch_openml
import matplotlib as mpl
import matplotlib.pyplot as plt
import warnings

mpl.rcParams['axes.labelsize'] = 14
mpl.rcParams['xtick.labelsize'] = 12
mpl.rcParams['ytick.labelsize'] = 12

warnings.filterwarnings('ignore')
np.random.seed(42)

# 保存图片的地址
PROJECT_ROOT_DIR = "."
CHAPTER_ID = "classification"


def plot_precision_recall_vs_threshold(precisions, recalls, thresholds):
    plt.plot(
        thresholds,
        precisions[:-1],
        "b--",
        label="Precision"
    )
    plt.plot(
        thresholds,
        recalls[:-1],
        "g-",
        label="Recall"
    )
    plt.xlabel("Threshold", fontsize=16)
    plt.legend(loc="upper left", fontsize=16)
    plt.ylim([0, 1])

def sort_by_target(mnist):
    reorder_train = np.array(sorted([(target, i) for i, target in enumerate(mnist.target[:60000])]))[:, 1]
    reorder_test = np.array(sorted([(target, i) for i, target in enumerate(mnist.target[60000:])]))[:, 1]
    mnist.data[:60000] = mnist.data.iloc[reorder_train]
    mnist.target[:60000] = mnist.target.iloc[reorder_train]
    mnist.data[60000:] = mnist.data.iloc[reorder_test + 60000]
    mnist.target[60000:] = mnist.target.iloc[reorder_test + 60000]


def get_data():
    # Mnist 数据是图像数据:(28,28,1)的灰度图
    """注意:
    fetch_openml返回的是未排序的MNIST数据集。
    fetch_mldata返回按目标排序的数据集。
    在SciKit-Learn 0.20后已经弃用fetch_mldata(),需要使用fetch_openml()。
    如果要得到和之前相同的结果,需要排序数据集。
    """
    mnist = fetch_openml('mnist_784', version=1, cache=True)   # fetch_openml返回一个未排序的数据集
    mnist.target = mnist.target.astype(np.int8)
    sort_by_target(mnist)
    # print(mnist.data.shape)    # (70000, 784)

    X, y = mnist["data"], mnist["target"]
    #print(X.shape)    # (70000, 784)
    #print(y.shape)    # (70000,)

    # 切分为训练集和测试集
    X_train, X_test, y_train, y_test = X[:60000], X[60000:], y[:60000], y[60000:]

    # 洗牌操作,打乱当前数据集顺序
    shuffle_index = np.random.permutation(60000)
    X_train, y_train = X_train.iloc[shuffle_index], y_train.iloc[shuffle_index]   # 索引值回传相当于洗牌操作
    #print(X_train, y_train)

    # 训练二分类器
    y_train_5 = (y_train == 5)   # 修改便签为是否等于5
    y_test_5 = (y_test == 5)

    from sklearn.linear_model import SGDClassifier     # 引入线性分类器

    # 使用scikit-learn的SGDClassifier类来创建分类器,区分图片是否是数字5
    sgd_clf = SGDClassifier(
        max_iter=5,       # 训练迭代次数
        tol=-np.infty,
        random_state=42   # 传入随机种子,每次随机结果一样
    )
    # fit方法:用随机梯度下降法拟合线性模型
    sgd_clf.fit(X_train, y_train)

    from sklearn.model_selection import cross_val_predict

    y_train_pred = cross_val_predict(sgd_clf, X_train, y_train_5, cv=3)
    #print(y_train_pred.shape)     # (60000,):60000个样本的预测结果
    #print(X_train.shape)       # (60000, 784):训练样本也是60000个,与预测结果数量一致

    # 阈值
    # y_scores = sgd_clf.decision_function([X[35000]])
    y_scores = cross_val_predict(sgd_clf, X_train, y_train_5, cv=3, method="decision_function")
    print(y_scores)

    t = 5000
    y_pred = (y_scores > t)
    print(y_pred)

    print(y_train_5.shape)
    print(y_scores.shape)

    from sklearn.metrics import precision_recall_curve

    precisions, recalls, thresholds = precision_recall_curve(y_train_5, y_scores)
    # print(precisions, recalls, thresholds)

    plt.figure(figsize=(8, 4))
    plot_precision_recall_vs_threshold(precisions, recalls, thresholds)
    plt.xlim([-700000, 700000])
    plt.show()

get_data()
测试记录:
[-137613.55094673 -286648.62077295 -345103.68771357 … -106624.90009584
-78527.39712318 10354.98537622]
[False False False … False False True]
(60000,)
(60000,)
6.2 recall变化precision的变化情况
代码:
在6.1 章节的代码上进行增加
def plot_precision_vs_recall(precisions, recalls):
    plt.plot(
        recalls,
        precisions,
        "b-",
        linewidth=2
    )
    plt.xlabel("Recall", fontsize=16)
    plt.ylabel("Precision", fontsize=16)
    plt.axis([0, 1, 0, 1])


def get_data():
    """代码略"""

    # 随着recall变化precision的变化情况
    plt.figure(figsize=(8, 6))
    plot_precision_vs_recall(precisions, recalls)
    plt.show()
七. 模型评价——ROC curves
receiver operating characteristic(ROC)曲线是二元分类中的常用评估方法。
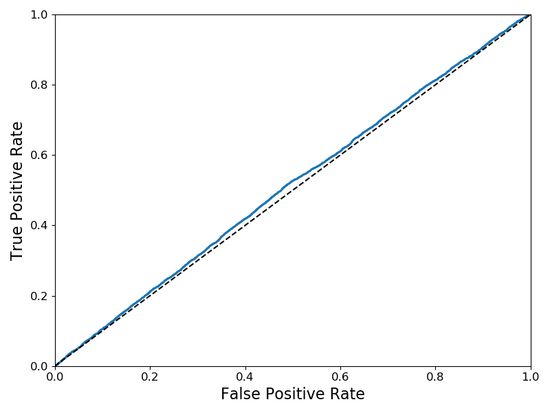
它与精确度/召回曲线非常相似,但ROC曲线不是绘制精确度与召回率,而是绘制 true positive rate(TPR) 与 false positive rate(FPR)
要绘制ROC曲线,首先需要使用roc_curve()函数计算各种阈值的 TPR 和 FPR :
-
TPR = TP / (TP + FN)(Recall)
-
FPR = FP / (FP + TN)
-
TPR:在所有实际为阳性的样本中,被正确地判断为阳性的比率 TRP = TP / (TP + FN)。TPR也被称为正样本的召回率,或者覆盖率。
-
FPR:在所有实际为阴性的样本中,被错误地判断为阳性的比率 FPR = FP / (FP + TN)。FPR也被称为负样本的召回率,或者取伪率。
7.1 绘制ROC曲线示例
代码:
def plot_roc_curve(fpr, tpr, label=None):
    plt.plot(fpr, tpr, linewidth=2, label=label)
    plt.plot([0, 1], [0, 1], 'k--')
    plt.axis([0, 1, 0, 1])
    plt.xlabel('False Positive Rate', fontsize=16)
    plt.ylabel('True Positive Rate', fontsize=16)


def get_data():
    """略"""

    # ROC 曲线
    from sklearn.metrics import roc_curve
    fpr, tpr, thresholds = roc_curve(y_train_5, y_scores)

    plt.figure(figsize=(8, 6))
    plot_roc_curve(fpr, tpr)
    plt.show()
测试记录:
虚线表示纯随机分类器的ROC曲线:一个好的分类器应尽可能远离该线(左上角最优)。
7.2 ROC-AUC(ROC曲线下面积)
AUC(Area Under Curve) 被定义为ROC曲线下的面积,因为ROC曲线一般都处于y=x这条直线的上方,所以取值范围在0.5和1之间,使用AUC作为评价指标是因为ROC曲线在很多时候并不能清晰地说明哪个分类器的效果更好,而AUC作为一个数值,其值越大代表分类器效果更好。
AUC是一个概率值,当随机挑选一个正样本以及一个负样本,当前的分类算法根据计算得到的分数将这个正样本排在负样本前面的概率就是AUC值。所以,AUC的值越大,当前的分类算法越有可能将正样本排在负样本值前面,既能够更好的分类。
# AUC曲线下面积
from sklearn.metrics import roc_auc_score

print(roc_auc_score(y_train_5, y_scores))      # 0.9562435587387078
测量曲线下面积(AUC)是比较分类器的一种方法。完美分类器的ROC AUC等于1,而纯随机分类器的ROC AUC等于0.5。
