UFFDFR实现记录
**论文下载《UFFDFR: Undersampling framework with denoising, fuzzy c-means clustering, and representative sample selection for imbalanced data classification》**
Zheng M , Li T , Zheng X , et al. UFFDFR: Undersampling framework with denoising, fuzzy c-means clustering, and representative sample selection for imbalanced data classification[J]. Information Sciences, 2021, 576:658-680.
- 数据集:13种UCI数据集、美国国家航空航天局(软件缺陷)、英国利兹市议会(交通事故)
- 基分类器:KNN、RF、DT、GBDT、SVC
- 对比方法:
6种欠采样方法:
3种经典欠采样:ClusterCentroids (CC) 、NearMiss (NM) 和随机欠采样 (RUS)
3种先进欠采样:基于聚类的欠采样方法(CBUS)、以聚类中心为代表样本的基于聚类的欠采样方法(KMC)和以最接近聚类中心的样本为代表样本的基于聚类的欠采样方法(KMN) - 评价指标:ROC_AUC、F-measure和G-mean
- 提出具有去噪、模糊C均值聚类和代表样本选择的三阶段欠采样框架(UFFDFR)
Stage 1: Denoising
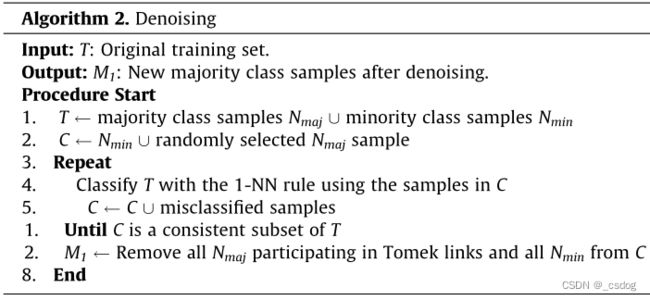
首先,将原始训练数据集划分为多数类样本 Nmaj 和少数类样本 Nmin。接下来,创建子集 C,其中包含所有 Nmin 和一个随机选择的 Nmaj。然后将C作为1-NN算法的训练数据集,对T(所有样本)中的样本进行分类。将所有错误分类的样本移入C,并重复此过程,直到C是T的一致子集(即T中样本分类全部正确则停止)。最后,去除Tomek链接中的所有Nmaj和C中所有Nmin,得到新的去噪后多数类样本。
该过程与One-sided selection(OSS)方法类似。OSS伪代码如下。
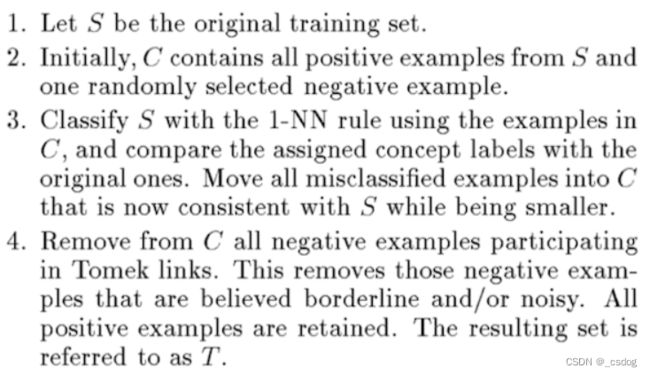
可以使用 imbalanced-learn 中的OneSidedSelection类来实现。
# Undersample and plot imbalanced dataset with One-Sided Selection
from collections import Counter
from sklearn.datasets import make_classification
from imblearn.under_sampling import OneSidedSelection
from matplotlib import pyplot
from numpy import where
# define dataset
X, y = make_classification(n_samples=10000, n_features=2, n_redundant=0,
	n_clusters_per_class=1, weights=[0.99], flip_y=0, random_state=1)
# summarize class distribution
counter = Counter(y)
print(counter)
# define the undersampling method
for label, _ in counter.items():
	row_ix = where(y == label)[0]
	pyplot.scatter(X[row_ix, 0], X[row_ix, 1], label=str(label))
pyplot.legend()
pyplot.show()
undersample = OneSidedSelection(n_neighbors=1, n_seeds_S=200)
# transform the dataset
X, y = undersample.fit_resample(X, y)
# summarize the new class distribution
counter = Counter(y)
print(counter)
# scatter plot of examples by class label
for label, _ in counter.items():
	row_ix = where(y == label)[0]
	pyplot.scatter(X[row_ix, 0], X[row_ix, 1], label=str(label))
pyplot.legend()
pyplot.show()
X为欠采样后的样本,y为标签。
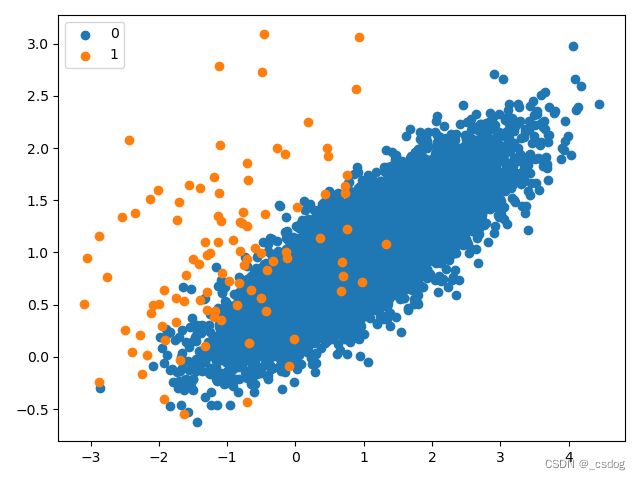
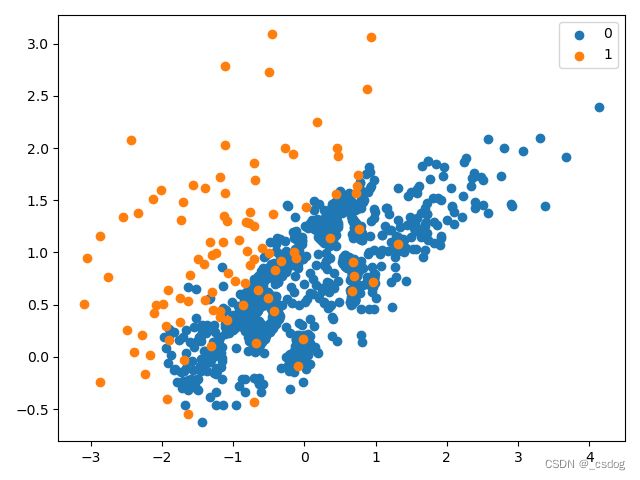
可以看到,从多数类中删除了大量样本,包括冗余样本(通过 CNN 删除)和模棱两可的样本(通过 Tomek Links 删除)。该数据集的比率现在约为 1:10,低于 1:100。
Counter({0: 9900, 1: 100})#原始分布
Counter({0: 944, 1: 100})#采样后分布
原始分布散点图如下。
单侧选择欠采样的不平衡数据集散点图如下。
参考:https://machinelearningmastery.com/undersampling-algorithms-for-imbalanced-classification/
Stage 2: Clustering
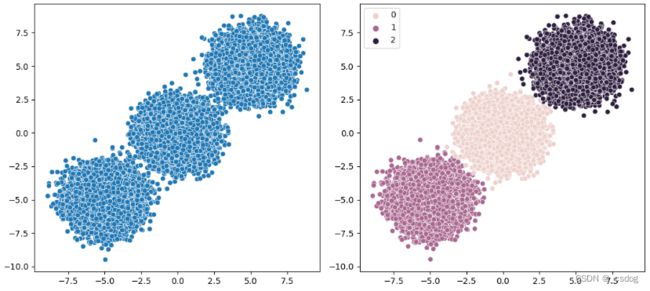
pip install fuzzy-c-means
或者
pip install fuzzycmeans
两个包使用方法类似
from fcmeans import FCM
# from fuzzycmeans import FCM
from sklearn.datasets import make_blobs
from seaborn import scatterplot as scatter
import numpy as np
import matplotlib.pyplot as plt
from sklearn.preprocessing import StandardScaler
from time import *
# create artifitial dataset
begin_time = time()
n_samples=50000
n_bins=3
# use 3 bins for calibration_curve as we have 3 clusters
centers=[(-5,-5),(0,0),(5,5)]
X,_=make_blobs(n_samples=n_samples,n_features=2,cluster_std=1.0,centers=centers,shuffle=False,random_state=42)# fit the fuzzy-c-means
fcm=FCM(n_clusters=3)
fcm.fit(X)
# fcm_centers=fcm.centers
fcm_labels=fcm.u.argmax(axis=1)# plot result%matplotlibinlinef,
_,axes=plt.subplots(1,2,figsize=(11,5))
scatter(X[:,0],X[:,1],ax=axes[0])
scatter(X[:,0],X[:,1],ax=axes[1],hue=fcm_labels)
# scatter(fcm_centers[:,0],fcm_centers[:,1],ax=axes[1],marker="s",s=200)
plt.show()
end_time = time()
total_time = end_time - begin_time
print('训练预测耗时:', total_time, 's')
class XieBieni(Quantifier):
    target = 'min'

    def calculate(self):
        n = self.x.shape[0]
        c = self.v.shape[0]

        um = self.u ** self.m

        d2 = self.pairwise_squared_distances(self.x, self.v)
        v2 = self.pairwise_squared_distances(self.v, self.v)

        v2[v2 == 0.0] = np.inf

        return np.sum(um.T * d2) / (n * np.min(v2))
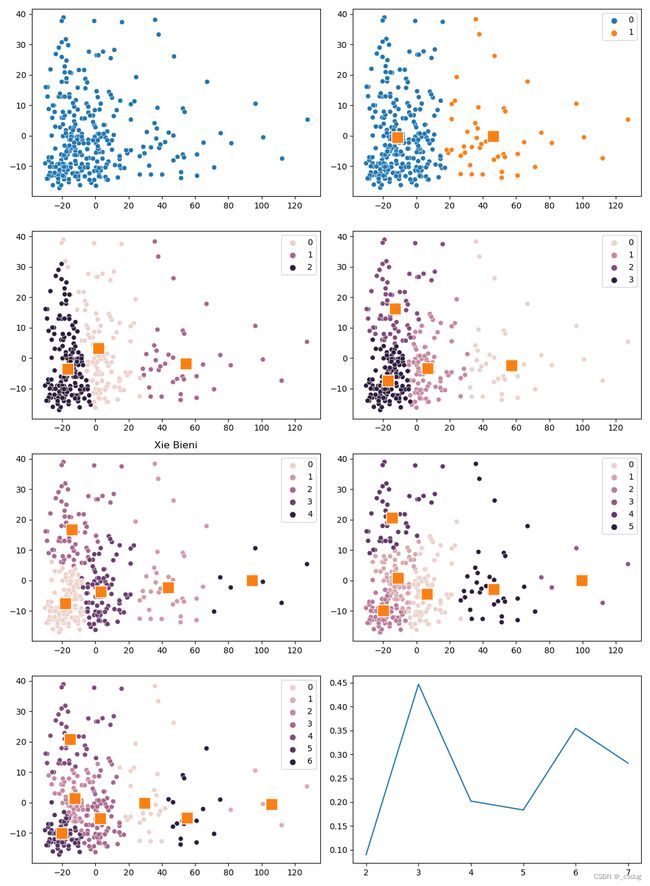
Stage1 和 Stage2 结合,根据指标选出最佳聚类数,数据集在uci开源:
class Quantifier(object):
    def __init__(self, x, v, m):
        self.x = x
        self.v = v
        self.m = m
        self.u = self.fcm_get_u(x, v, m)

    @classmethod
    def fcm_get_u(cls, x, v, m):
        distances = cls.pairwise_squared_distances(x, v)
        nonzero_distances = np.fmax(distances, np.finfo(np.float64).eps)
        inv_distances = np.reciprocal(nonzero_distances) ** (1 / (m - 1))
        return inv_distances.T / np.sum(inv_distances, axis=1)

    @staticmethod
    def calculate_covariances(x, u, v, m):
        c, n = u.shape
        d = v.shape[1]

        um = u ** m

        covariances = np.zeros((c, d, d))

        for i in range(c):
            xv = x - v[i]
            uxv = um[i, :, np.newaxis] * xv
            covariances[i] = np.einsum('ni,nj->ij', uxv, xv) / np.sum(um[i])

        return covariances


    @staticmethod
    def pairwise_squared_distances(A, B):
        return scipy.spatial.distance.cdist(A, B) ** 2


class XieBieni(Quantifier):
    target = 'min'

    def calculate(self):
        n = self.x.shape[0]
        c = self.v.shape[0]

        um = self.u ** self.m

        d2 = self.pairwise_squared_distances(self.x, self.v)
        v2 = self.pairwise_squared_distances(self.v, self.v)

        v2[v2 == 0.0] = np.inf

        return np.sum(um.T * d2) / (n * np.min(v2))
def group_data(self, dataset, n_clusters):
    raise NotImplementedError
# data = pd.read_excel('Pima.xlsx',header=None,names=['A','B','C','D','E','F','G','H','I'])
# data = pd.read_excel('Pima.xlsx')
data = np.loadtxt("german.data-numeric")
X = data[:,:-1]
y = data[:,-1]
# X = data.iloc[:,:-1].values
# y = data.iloc[:,-1].values
counter = Counter(y)
print('原始:',counter)
X_train, X_test, y_train, y_test = train_test_split(X, y, test_size=0.1, random_state=0)#随机划分样本数据
counter = Counter(y_train)
print('划分后:',counter)
oss = OneSidedSelection(n_neighbors=1, n_seeds_S=200)
X_train, y_train = oss.fit_resample(X_train,y_train)
counter = Counter(y_train)
print('采样后:',counter)
maj=[]
for a,b in zip(X_train,y_train):
    if b == 1:
        maj.append(a)
maj=np.array(maj)

pca = PCA(n_components=2)  # n_components can be integer or float in (0,1)
pca.fit(maj)  # fit the model
x=pca.fit_transform(maj)
# x=maj
N_CLUSTERS = (2, 3, 4 , 5 , 6 , 7)

xb_results = []
fig, axes = plt.subplots(4, 2, figsize=(11, 15), squeeze=True)

scatter(x=x[:,0], y=x[:,1],ax=axes[0][0])


for i, n_clusters in enumerate(N_CLUSTERS):
    fcm = FCM(n_clusters=n_clusters)
    fcm.fit(x)

    centers = fcm.centers
    labels = fcm.u.argmax(axis=1)

    xb = XieBieni(x, centers, 2.0)
    xb_results.append(xb.calculate())
    row = int((i + 1) / 2)
    col = (i + 1) % 2
    scatter(x=x[:,0], y=x[:,1], ax=axes[row][col],hue=labels)
    scatter(x=centers[:, 0], y=centers[:, 1],ax=axes[row][col],marker="s", s=200)

axes[2][0].set_title("Xie Bieni")
lineplot(x=N_CLUSTERS, y=xb_results)

plt.show()
Stage 3: Representative sample selection
_n = N_CLUSTERS[np.argmin(xb_results)]
fcm=FCM(n_clusters=_n)
fcm.fit(x)
_labels = fcm.u.argmax(axis=1)
counter = Counter(_labels)
a = 2
b = 1
m3 = []
for i in range(_n):
    Req = int((counter[i]/Nmaj*Nmin))#eq.(10)
    MinPts = a*(int(Nmaj/Nmin))#eq.(7)
    maj_c=[]
    H=[]
    A=[]
    h=[]#邻域个数
    for m , n in enumerate(_labels):
        if n == i:
            maj_c.append(x[m,:])
    maj_c = np.array(maj_c)
    dist = getDistanceMatrix(maj_c)
    d = (dist.sum() - np.diag(dist).sum()) / 2
    R = b*(d/counter[i]**2)#eq.(8)
    for m , n in enumerate(maj_c):
        rn=len(find_points_in_eps(m, R, dist))
        if rn>=MinPts:#eq.(9)
            H.append(n)
            h.append(rn)

    # g, h = np.shape(H)  # N为总数,D为维度
    # p = np.zeros([g, g])
    H=np.array(H)
    t=np.argsort(h)
    m1 = H[t[0]]
    A.append(m1)
    H = np.delete(H, t[0], axis=0)
    A = np.array(A)
    dist = getDis(A, H)
    xx = np.argmax(dist)
    m2 = H[xx].reshape(1,2)
    A=np.append(A,m2,axis=0)
    H = np.delete(H, xx, axis=0)
    for m in range(Req-2):
        dist = getDis(A , H)
        xxx = np.argmin(dist)
        xxx = xxx % len(H)
        A = np.append(A, H[xxx].reshape(1,2), axis=0)
        H = np.delete(H, xxx, axis=0)
    for m in A:
        m3.append(m)
m3=np.array(m3)
x_train=m3
x_train=np.append(x_train,min_pca,axis=0)
y_t = [1]*len(m3[:,0])
for m in range(Nmin):
    y_t.append(0)
rf = RandomForestClassifier()
rf.fit(x_train,y_t)
pre = rf.predict(X_test_pca)
for m , n in enumerate(y_test):
    if n==2:
        y_test[m]=0
fpr,tpr,thresholds=metrics.roc_curve(y_test,pre)
# print('FPR:',fpr)
# print('TPR:',tpr)
# print('thresholds:',thresholds)
s = metrics.auc(fpr, tpr)
print(s)
大致写了第三部分的思路,AUC指标0.61,论文中0.8+,差距有点大,可能是PCA降维影响的结果。最近在忙新项目,所以先放一放,以后有机会再优化一下。

实验部分
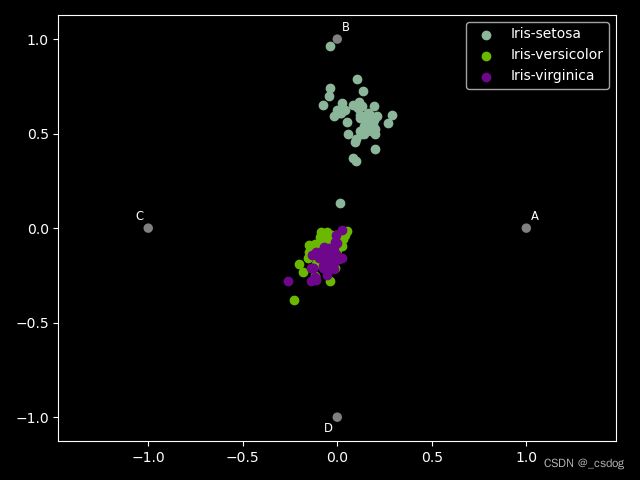
- RadViz可视化
将多维特征展示为二维。
import matplotlib.pyplot as plt
import pandas as pd
plt.style.use('dark_background')#设置绘图风格
from pandas.plotting import radviz
data = pd.read_csv("iris.data",header=None,names=['A','B','C','D','E'])
plt.figure()
radviz(data,class_column='E')
plt.show()
