mmlab花朵分类结果展示(1)
花朵102分类结果展示
- 测试DEMO效果
- 测试评估模型效果
- 修改网络参数
-
- 1.mmcls模型位置
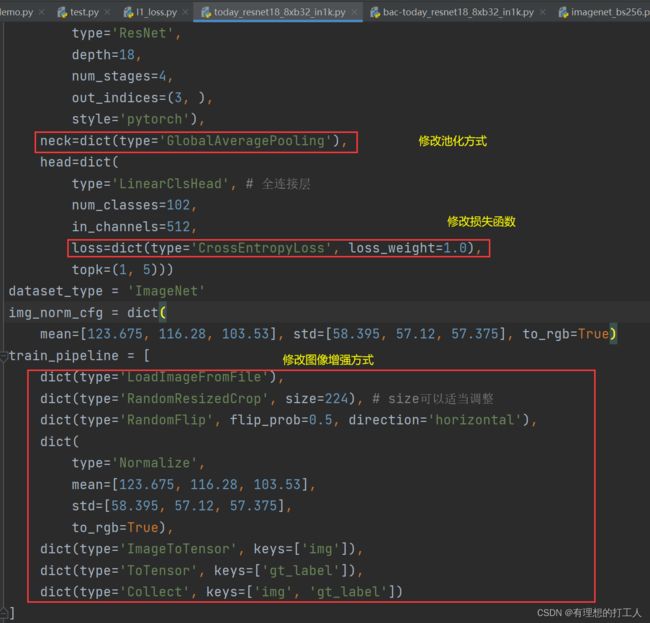
- 2.修改neck
- 3.修改损失函数
- 4.增补图像增强
- 修改配置文件参数
- 数据增强流程可视化展示
上一节给大家介绍了如何使用mmlab完成图像分类,运行的结果提示了我们当前模型的分类准确度以及损失值,但是光有这些数据是不够的,我们希望可以展示出更详细的分类信息,比如给测试集中(我们用验证集模拟一下)所有的花朵都标出分类的结果等。今天我们就来介绍训练结果的测试与验证。
测试DEMO效果
首先,我们要先找到跑出来的模型位置,上节课也介绍过,在\tools\work_dirs\resnet18_8xb32_in1k文件夹中存储了我们生成内容,当然也有我们在找的模型了:

记录好这个路径,我们马上就要用到。
下面我们打开demo文件夹,到测试集中随便找一个图片,复制到这个文件夹中,之后找到并打开里面的image_demo.py文件:
from argparse import ArgumentParser
from mmcls.apis import inference_model, init_model, show_result_pyplot
# 需要的三个关键参数路径
#image_00028.jpg ../configs/resnet/today_resnet18_8xb32_in1k.py ../tools/work_dirs/resnet18_8xb32_in1k/epoch_100.pth

def main():
    parser = ArgumentParser()
    parser.add_argument('img', help='Image file') # 1.图像数据
    parser.add_argument('config', help='Config file') # 2.配置文件
    parser.add_argument('checkpoint', help='Checkpoint file') # 3.模型路径
    parser.add_argument(
        '--device', default='cuda:0', help='Device used for inference')
    args = parser.parse_args()

    # 配置文件,检查模型
    model = init_model(args.config, args.checkpoint, device=args.device)
    # 传入单个图像进行测试
    result = inference_model(model, args.img)
    # 展示结果
    show_result_pyplot(model, args.img, result)

if __name__ == '__main__':
    main()
同样,我们需要把路径全部复制粘贴添加到配置中即可:

这样,分类结果就展示出来了,计算机告诉我们,根据训练模型可知,这朵花属于第77类(因为我们的文本是从0开始的,而文件夹是从1开始的,因此需要加1),概率为90%,名字没有加载出来,这是因为我们之前的imagenet.py文件中用中文字符串构成的CLASS列表,解决这个问题的最简单方法就是使用英文字符。那么分类的结果对不对呢?我们来查证一下:
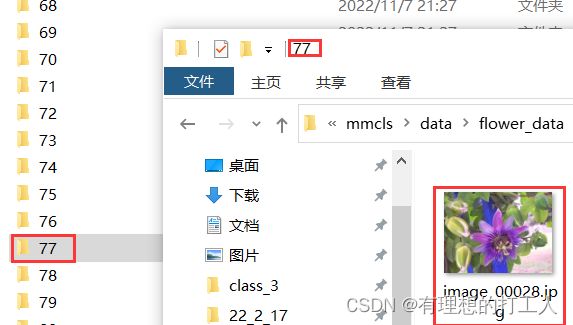
看来分类是对的。但是我们的模型可不是100%准确的,如果小伙伴们发现分类出错了,也是正常的事情啦~
测试评估模型效果
如果一次操作只展示一张图片的分类的话,还是不能满足测试的要求,比如我们想要测试一批数据的准确率,又要怎么做呢?
首先打开tools/test.py文件,这个文件的代码有很多,但是都不需要我们改,我们只需要把参数校对好再运行就可以了:
# 配置文件路径、训练模型
../configs/resnet/today_resnet18_8xb32_in1k.py ../tools/work_dirs/resnet18_8xb32_in1k/epoch_100.pth
# 在对应路径新建文件夹保存展示结果
--show-dir ../tools/work_dirs/resnet18_8xb32_in1k/val_result
# 评估指标,parse_args函数中有定义,可以自行选择一个或多个
--metrics accuracy recall
# 把注释的内容删掉再添加
注意,运行test.py文件时,读取数据的路径是我们在today_resnet18_8xb32_in1k.py中定义的测试集路径。运行结束之后,我们就可以在\tools\work_dirs\resnet18_8xb32_in1k\val_result路径下找到保存的内容了:
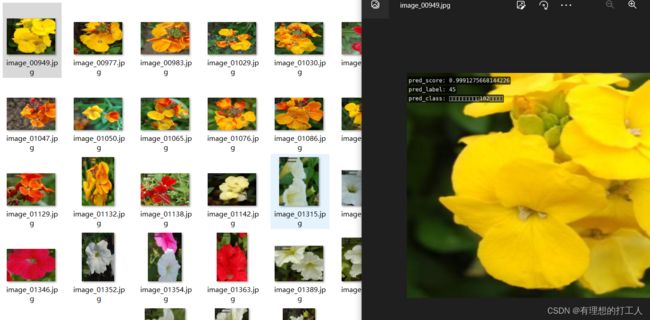
同时终端也会给我们输出评估的结果:

准确率大概在90%左右。
修改网络参数
到此,我们已经算是把别人的项目玩明白了,但可能会有小伙伴还有疑问,如果我想修改部分网络结构,适应不同的任务,又应该怎么做呢?下面我们重回源码,带大家小改网络结构:
1.mmcls模型位置
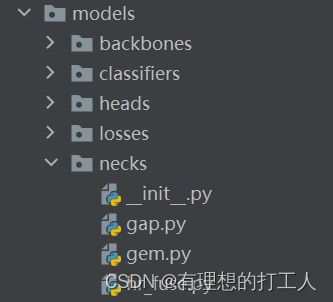
不知道小伙伴只发现没有,我们的mmcls中有一个model文件夹,这里就保存着我们用到的模型:
这里我们可以调整的主要就有以上三种。在修改之前,我们最好做一下备份,以免直接修改不好恢复。
2.修改neck
我们代码中使用的全局平均池化就是gap文件里的一个类名。如果我们想改的话,我们可以把它换成gem的类名:

我们回到today_resnet18_8xb32_in1k.py,将其中的
neck=dict(type='GlobalAveragePooling'),
改为
neck=dict(type='GeneralizedMeanPooling'),
就完成修改了。
当然,如果大佬觉得这个也不好,完全可以自己写一个…
3.修改损失函数
修改损失函数相对来讲是比较容易的,如果有必要我们也可以通过仿写的方式对损失函数进行大改,以适应当前的项目。但想要修改损失函数,我们就要读懂原油的损失函数。我们随便点开一个损失函数:

首先,我们可以看一下源码引用的内容(. .表示引用上一级存在的.py文件,.表示引用的是同级内的文件)。这个损失函数中weight_reduce_loss是引用自utils文件中的:
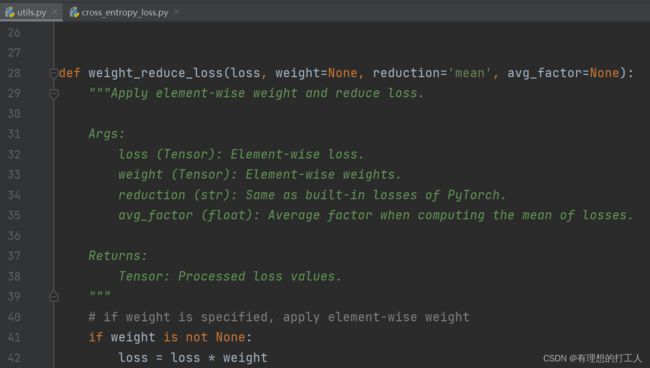
继续往下翻,我们会看到该文档中给我们提供了自己写损失函数的方法:
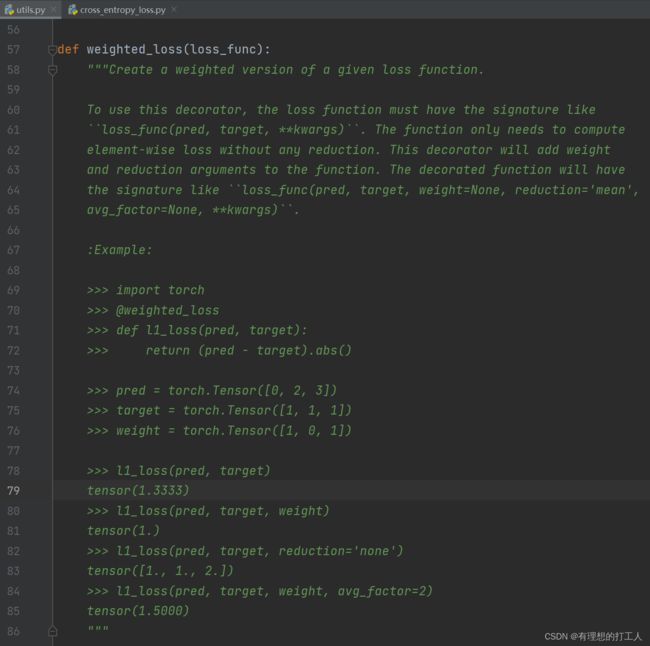
那么我们不妨试一下自己仿写一个:
import torch
import torch.nn as nn
from ..builder import LOSSES
from .utils import weighted_loss

@weighted_loss
def l1_loss(pred, target):
    target = nn.functional.one_hot(target,num_classes=102) # 将target改成32*102类型的数据
    assert pred.size() == target.size() and target.numel() > 0
    loss = torch.abs(pred - target)
    return loss

@LOSSES.register_module()
class L1Loss(nn.Module):

    def __init__(self, reduction='mean', loss_weight=1.0):
        super(L1Loss, self).__init__()
        self.reduction = reduction
        self.loss_weight = loss_weight

    def forward(self,
                pred,
                target,
                weight=None,
                avg_factor=None,
                reduction_override=None):
        assert reduction_override in (None, 'none', 'mean', 'sum')
        reduction = (
            reduction_override if reduction_override else self.reduction)
        loss = self.loss_weight * l1_loss(
            pred, target, weight, reduction=reduction, avg_factor=avg_factor)
        return loss
我们可以把它命名为l1_loss,添加在losses文件夹中,然后修改
loss=dict(type='CrossEntropyLoss', loss_weight=1.0),
为
loss=dict(type='L1Loss', loss_weight=1.0),
当然,不要忘了我们改动完之后要在对应的_ __init___文件中添加进我们写的文件名:

这样简单改动并不会让训练效果更好,想要改动的小伙伴最好找到理论支撑。当然,我们也可以使用原模型中提供的其他损失函数。
4.增补图像增强
我们做图像增强的办法有很多,并不需要我们自己写,多做几个调用就好啦。首先打开mmcls\datasets\pipelines\transforms.py文件,然后选择一个我们没有用到的数据增强方法(这里选的是改变图像对比度):
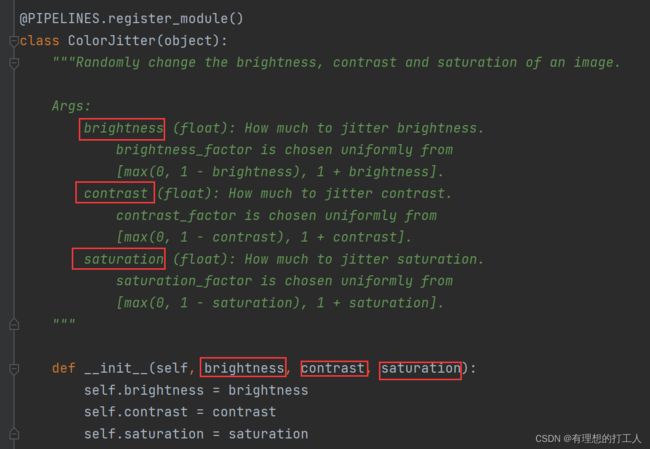
这里的简介已经很贴心的给我们介绍了如何传参,那么我们就要把改变对比度的增强方法加到数据增强的代码中:
train_pipeline = [
    dict(type='LoadImageFromFile'),
    dict(type='RandomResizedCrop', size=224),
    dict(type='RandomFlip', flip_prob=0.5, direction='horizontal'),
    # 这就是我们新加入的增强方式
    dict(type='ColorJitter', brightness=0.5, contrast=0.5, saturation=0.5),

    dict(
        type='Normalize',
        mean=[123.675, 116.28, 103.53],
        std=[58.395, 57.12, 57.375],
        to_rgb=True),
    dict(type='ImageToTensor', keys=['img']),
    dict(type='ToTensor', keys=['gt_label']),
    dict(type='Collect', keys=['img', 'gt_label'])
]
修改配置文件参数
我们对训练模型的开发还没有结束,比如这里:
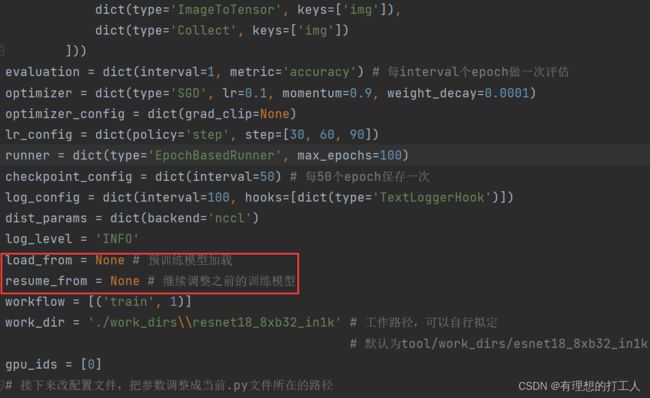
我们现在就来下载预训练模型。首先打开根目录下的README.md,然后我们在Model zoo这个部分点击我们使用的网络resnet,进入网站

然后下滑找到我们使用的resnet18(这里选择ImageNet-1k里的,数据集大一点):
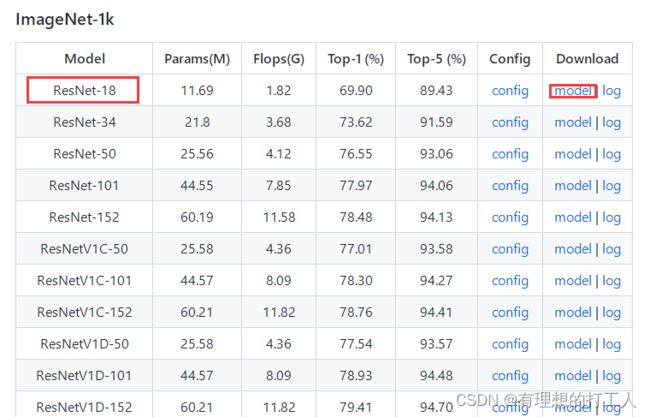
下载完成以后,我们把这个预训练模型路径赋给load_from参数:
load_from = '../mmcls/data/resnet18_8xb32_in1k_20210831-fbbb1da6.pth'
另外,还有一些比较经典的数据增强操作我们也可以加入进来,比如mixup和utmix。首先我们打开resnet文件下含有对应尾缀的文件,就可以看到一些路径文件:

按照路径我们找到\configs\ _ base _ \models文件下的文件(如resnet50_mixup.py),就可以看到对应的用法:
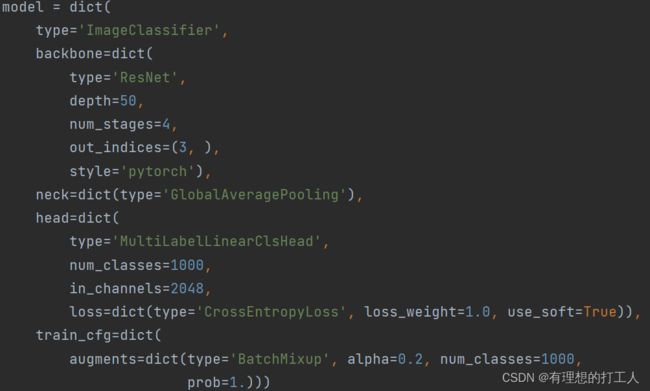
我们直接把train_cfg移植到我们的bac-today_resnet18_8xb32_in1k.py中来:
model = dict(
    type='ImageClassifier',
    backbone=dict(
        type='ResNet',
        depth=18,
        num_stages=4,
        out_indices=(3, ),
        style='pytorch'),
    neck=dict(type='GeneralizedMeanPooling'),
    head=dict(
        type='LinearClsHead',
        num_classes=102,
        in_channels=512,
        loss=dict(type='FocalLoss', loss_weight=1.0),#L1Loss CrossEntropyLoss
        topk=(1, 5)),
    # 移植内容:
    train_cfg=dict(
            augments=dict(type='BatchMixup', alpha=0.2, num_classes=102, # 分类数量要改成102
                          prob=1.))
)
这样也可以增加训练的准确度。
数据增强流程可视化展示
在tools中有一个visualizations文件夹,这里面有三个py文件,我们主要说其中的两个。vis_cam.py用于可视化我们的模型所关注的区域,vis_pipeline.py用于可视化图像增强的过程。首先打开vis_pipeline.py文件,配置好参数,直接运行即可。为了给大家展示部分参数的含义,我把完整的代码和注释付给大家:
# Copyright (c) OpenMMLab. All rights reserved.
import argparse
import copy
import itertools
import os
import re
import sys
import warnings
from pathlib import Path
from typing import List

import cv2
import mmcv
import numpy as np
from mmcv import Config, DictAction, ProgressBar

from mmcls.core import visualization as vis
from mmcls.datasets.builder import PIPELINES, build_dataset, build_from_cfg
from mmcls.models.utils import to_2tuple

# text style
bright_style, reset_style = '\x1b[1m', '\x1b[0m'
red_text, blue_text = '\x1b[31m', '\x1b[34m'
white_background = '\x1b[107m'
# 修改参数
#../../configs/resnet/today_resnet18_8xb32_in1k.py  --output-dir ../work_dirs/resnet18_8xb32_in1k/vis/vis_pipeline
#--phase train --number 10 --mode concat

def parse_args():
    parser = argparse.ArgumentParser(
        description='Visualize a Dataset Pipeline')
    parser.add_argument('config', help='config file path')
    parser.add_argument(
        '--skip-type', # 跳过配置文件的指定阶段
        type=str,
        nargs='*',
        default=['ToTensor', 'Normalize', 'ImageToTensor', 'Collect'], # 跳过以上处理流程
        help='the pipelines to skip when visualizing')
    parser.add_argument(
        '--output-dir', # 输出路径
        default='',
        type=str,
        help='folder to save output pictures, if not set, do not save.')
    parser.add_argument(
        '--phase',
        # 指定数据来源(训练集)
        default='train',
        type=str,
        choices=['train', 'test', 'val'],
        help='phase of dataset to visualize, accept "train" "test" and "val".'
        ' Default train.')
    parser.add_argument(
        '--number', # 输出数量
        type=int,
        default=sys.maxsize,
        help='number of images selected to visualize, must bigger than 0. if '
        'the number is bigger than length of dataset, show all the images in '
        'dataset; default "sys.maxsize", show all images in dataset')
    parser.add_argument(
        # 指定展示内容
        '--mode',
        default='concat',
        type=str,
        # 可以将参数中--mode改成以下内容之一(可以指定多个)
        choices=['original', 'transformed', 'concat', 'pipeline'],
        help='display mode; display original pictures or transformed pictures'
        ' or comparison pictures. "original" means show images load from disk'
        '; "transformed" means to show images after transformed; "concat" '
        'means show images stitched by "original" and "output" images. '
        '"pipeline" means show all the intermediate images. Default concat.')
    parser.add_argument(
        # 是否直接展示生成图片
        '--show',
        default=False,
        action='store_true',
        help='whether to display images in pop-up window. Default False.')
    parser.add_argument(
        '--adaptive',
        default=False,
        action='store_true',
        help='whether to automatically adjust the visualization image size')
    parser.add_argument(
        '--min-edge-length',
        default=200,
        type=int,
        help='the min edge length when visualizing images, used when '
        '"--adaptive" is true. Default 200.')
    parser.add_argument(
        '--max-edge-length',
        default=800,
        type=int,
        help='the max edge length when visualizing images, used when '
        '"--adaptive" is true. Default 1000.')
    parser.add_argument(
        '--bgr2rgb',
        default=False,
        action='store_true',
        help='flip the color channel order of images')
    parser.add_argument(
        '--window-size',
        default='12*7',
        help='size of the window to display images, in format of "$W*$H".')
    parser.add_argument(
        '--cfg-options',
        nargs='+',
        action=DictAction,
        help='override some settings in the used config, the key-value pair '
        'in xxx=yyy format will be merged into config file. If the value to '
        'be overwritten is a list, it should be like key="[a,b]" or key=a,b '
        'It also allows nested list/tuple values, e.g. key="[(a,b),(c,d)]" '
        'Note that the quotation marks are necessary and that no white space '
        'is allowed.')
    parser.add_argument(
        '--show-options',
        nargs='+',
        action=DictAction,
        help='custom options for display. key-value pair in xxx=yyy. options '
        'in `mmcls.core.visualization.ImshowInfosContextManager.put_img_infos`'
    )
    args = parser.parse_args()

    assert args.number > 0, "'args.number' must be larger than zero."
    if args.window_size != '':
        assert re.match(r'\d+\*\d+', args.window_size), \
            "'window-size' must be in format 'W*H'."
    if args.output_dir == '' and not args.show:
        raise ValueError("if '--output-dir' and '--show' are not set, "
                         'nothing will happen when the program running.')

    if args.show_options is None:
        args.show_options = {}
    return args


def retrieve_data_cfg(config_path, skip_type, cfg_options, phase):
    cfg = Config.fromfile(config_path)
    if cfg_options is not None:
        cfg.merge_from_dict(cfg_options)
    data_cfg = cfg.data[phase]
    while 'dataset' in data_cfg:
        data_cfg = data_cfg['dataset']
    data_cfg['pipeline'] = [
        x for x in data_cfg.pipeline if x['type'] not in skip_type
    ]

    return cfg


def build_dataset_pipelines(cfg, phase):
    """build dataset and pipeline from config.

    Separate the pipeline except 'LoadImageFromFile' step if
    'LoadImageFromFile' in the pipeline.
    """
    data_cfg = cfg.data[phase]
    loadimage_pipeline = []
    if len(data_cfg.pipeline
           ) != 0 and data_cfg.pipeline[0]['type'] == 'LoadImageFromFile':
        loadimage_pipeline.append(data_cfg.pipeline.pop(0))
    origin_pipeline = data_cfg.pipeline
    data_cfg.pipeline = loadimage_pipeline
    dataset = build_dataset(data_cfg)
    pipelines = {
        pipeline_cfg['type']: build_from_cfg(pipeline_cfg, PIPELINES)
        for pipeline_cfg in origin_pipeline
    }

    return dataset, pipelines


def prepare_imgs(args, imgs: List[np.ndarray], steps=None):
    """prepare the showing picture."""
    ori_shapes = [img.shape for img in imgs]
    # adaptive adjustment to rescale pictures
    if args.adaptive:
        for i, img in enumerate(imgs):
            imgs[i] = adaptive_size(img, args.min_edge_length,
                                    args.max_edge_length)
    else:
        # if src image is too large or too small,
        # warning a "--adaptive" message.
        for ori_h, ori_w, _ in ori_shapes:
            if (args.min_edge_length > ori_h or args.min_edge_length > ori_w
                    or args.max_edge_length < ori_h
                    or args.max_edge_length < ori_w):
                msg = red_text
                msg += 'The visualization picture is too small or too large to'
                msg += ' put text information on it, please add '
                msg += bright_style + red_text + white_background
                msg += '"--adaptive"'
                msg += reset_style + red_text
                msg += ' to adaptively rescale the showing pictures'
                msg += reset_style
                warnings.warn(msg)

    if len(imgs) == 1:
        return imgs[0]
    else:
        return concat_imgs(imgs, steps, ori_shapes)


def concat_imgs(imgs, steps, ori_shapes):
    """两幅图拼接到一起"""
    show_shapes = [img.shape for img in imgs]
    show_heights = [shape[0] for shape in show_shapes]
    show_widths = [shape[1] for shape in show_shapes]

    max_height = max(show_heights)
    text_height = 20
    font_size = 0.5
    pic_horizontal_gap = min(show_widths) // 10
    for i, img in enumerate(imgs):
        cur_height = show_heights[i]
        pad_height = max_height - cur_height
        pad_top, pad_bottom = to_2tuple(pad_height // 2)
        # 处理奇数情况
        if pad_height % 2 == 1:
            pad_top = pad_top + 1
        pad_bottom += text_height * 3
        pad_left, pad_right = to_2tuple(pic_horizontal_gap)

        img = cv2.copyMakeBorder(
            img,
            pad_top,
            pad_bottom,
            pad_left,
            pad_right,
            cv2.BORDER_CONSTANT,
            value=(255, 255, 255))
        # 底部显示相位信息
        imgs[i] = cv2.putText(
            img=img,
            text=steps[i],
            org=(pic_horizontal_gap, max_height + text_height // 2),
            fontFace=cv2.FONT_HERSHEY_TRIPLEX,
            fontScale=font_size,
            color=(255, 0, 0),
            lineType=1)
        # 底部显示图像信息
        imgs[i] = cv2.putText(
            img=img,
            text=str(ori_shapes[i]),
            org=(pic_horizontal_gap, max_height + int(text_height * 1.5)),
            fontFace=cv2.FONT_HERSHEY_TRIPLEX,
            fontScale=font_size,
            color=(255, 0, 0),
            lineType=1)

    # 对其高度
    board = np.concatenate(imgs, axis=1)
    return board


def adaptive_size(image, min_edge_length, max_edge_length, src_shape=None):
    """如图想过小则重新调整规格"""
    assert min_edge_length >= 0 and max_edge_length >= 0
    assert max_edge_length >= min_edge_length
    src_shape = image.shape if src_shape is None else src_shape
    image_h, image_w, _ = src_shape

    if image_h < min_edge_length or image_w < min_edge_length:
        image = mmcv.imrescale(
            image, min(min_edge_length / image_h, min_edge_length / image_h))
    if image_h > max_edge_length or image_w > max_edge_length:
        image = mmcv.imrescale(
            image, max(max_edge_length / image_h, max_edge_length / image_w))
    return image


def get_display_img(args, item, pipelines):
    """get image to display."""
    # 图像有可能是bgr存储,如是则需要转换
    if args.bgr2rgb:
        item['img'] = mmcv.bgr2rgb(item['img'])
    src_image = item['img'].copy()
    pipeline_images = [src_image]

    # get intermediate images through pipelines
    if args.mode in ['transformed', 'concat', 'pipeline']:
        for pipeline in pipelines.values():
            item = pipeline(item)
            trans_image = copy.deepcopy(item['img'])
            trans_image = np.ascontiguousarray(trans_image, dtype=np.uint8)
            pipeline_images.append(trans_image)

    # concatenate images to be showed according to mode
    if args.mode == 'original':
        image = prepare_imgs(args, [src_image], ['src'])
    elif args.mode == 'transformed':
        image = prepare_imgs(args, [pipeline_images[-1]], ['transformed'])
    elif args.mode == 'concat':
        steps = ['src', 'transformed']
        image = prepare_imgs(args, [pipeline_images[0], pipeline_images[-1]],
                             steps)
    elif args.mode == 'pipeline':
        steps = ['src'] + list(pipelines.keys())
        image = prepare_imgs(args, pipeline_images, steps)

    return image


def main():
    args = parse_args()
    wind_w, wind_h = args.window_size.split('*')
    wind_w, wind_h = int(wind_w), int(wind_h)  # 显示窗口大小
    cfg = retrieve_data_cfg(args.config, args.skip_type, args.cfg_options,
                            args.phase)

    dataset, pipelines = build_dataset_pipelines(cfg, args.phase)
    CLASSES = dataset.CLASSES
    display_number = min(args.number, len(dataset))
    progressBar = ProgressBar(display_number)

    with vis.ImshowInfosContextManager(fig_size=(wind_w, wind_h)) as manager:
        for i, item in enumerate(itertools.islice(dataset, display_number)):
            image = get_display_img(args, item, pipelines)

            # 数据保存路径,默认为无
            dist_path = None
            if args.output_dir:
                # 某些数据及没有文件名
                src_path = item.get('filename', '{}.jpg'.format(i))
                dist_path = os.path.join(args.output_dir, Path(src_path).name)

            infos = dict(label=CLASSES[item['gt_label']])

            ret, _ = manager.put_img_infos(
                image,
                infos,
                font_size=20,
                out_file=dist_path,
                show=args.show,
                **args.show_options)

            progressBar.update()

            if ret == 1:
                print('\nMannualy interrupted.')
                break


if __name__ == '__main__':
    main()
配置好后运行文件,可以在保存路径下看到我们的数据增强处理的过程:
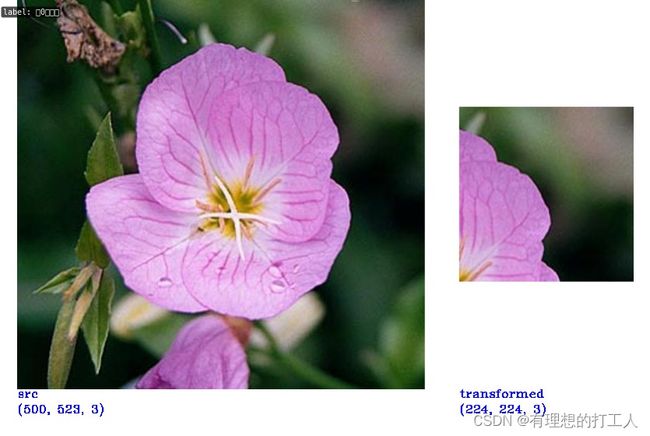

可以看到,我们的输入图片大小有所不同,但是处理过后的大小都是一样的,也印证了一点,计算机接收到的图片实际大小都是相同的。但是因为是随机剪裁,并不是每一张图片都截取到了最有用的信息。如果我们需要展示更多的图像,可以把num设置得大一些,另外,如果我们希望展示其他的10张图片,只需要改变train.txt文本内容的顺序即可。
本节的讲述先到这里了,下一节我们继续介绍分类结果的展示~
