深度学习Pytorch(一) 之 共享单车预测网络
实验介绍
1. 实验数据:hour.csv (17379, 17)
| instant | dteday | season | yr | mnth | hr | holiday | weekday | workingday | weathersit | temp | atemp | hum | windspeed | casual | registered | cnt |
| 1 | 2011/1/1 | 1 | 0 | 1 | 0 | 0 | 6 | 0 | 1 | 0.24 | 0.2879 | 0.81 | 0 | 3 | 13 | 16 |
| 2 | 2011/1/1 | 1 | 0 | 1 | 1 | 0 | 6 | 0 | 1 | 0.22 | 0.2727 | 0.8 | 0 | 8 | 32 | 40 |
| 3 | 2011/1/1 | 1 | 0 | 1 | 2 | 0 | 6 | 0 | 1 | 0.22 | 0.2727 | 0.8 | 0 | 5 | 27 | 32 |
| 4 | 2011/1/1 | 1 | 0 | 1 | 3 | 0 | 6 | 0 | 1 | 0.24 | 0.2879 | 0.75 | 0 | 3 | 10 | 13 |
| 5 | 2011/1/1 | 1 | 0 | 1 | 4 | 0 | 6 | 0 | 1 | 0.24 | 0.2879 | 0.75 | 0 | 0 | 1 | 1 |
| 6 | 2011/1/1 | 1 | 0 | 1 | 5 | 0 | 6 | 0 | 2 | 0.24 | 0.2576 | 0.75 | 0.0896 | 0 | 1 | 1 |
| 7 | 2011/1/1 | 1 | 0 | 1 | 6 | 0 | 6 | 0 | 1 | 0.22 | 0.2727 | 0.8 | 0 | 2 | 0 | 2 |
| 8 | 2011/1/1 | 1 | 0 | 1 | 7 | 0 | 6 | 0 | 1 | 0.2 | 0.2576 | 0.86 | 0 | 1 | 2 | 3 |
| 9 | 2011/1/1 | 1 | 0 | 1 | 8 | 0 | 6 | 0 | 1 | 0.24 | 0.2879 | 0.75 | 0 | 1 | 7 | 8 |
| 10 | 2011/1/1 | 1 | 0 | 1 | 9 | 0 | 6 | 0 | 1 | 0.32 | 0.3485 | 0.76 | 0 | 8 | 6 | 14 |
2. 属性说明
Instant: 记录号
Dteday: 日期
Season: 季节(1=春天、2=夏天、3=秋天、4=冬天)
yr: 年份,(0: 2011, 1:2012)
mnth: 月份( 1 to 12)
hr: 小时 (0 to 23) (在hour.csv有)
holiday: 是否是节假日
weekday: 星期中的哪天,取值为0~6 workingday:
是否工作日 1=工作日 (是否为工作日,1为工作日,0为周末或节假日 weathersit: 天气(1:晴天,多云;2:雾天,阴天;3:小雪,小雨;4:大雨,大雪,大雾)
temp: 气温摄氏度
atemp: 体感温度
hum: 湿度
windspeed: 风速
casual: 非注册用户个数
registered: 注册用户个数
cnt: 给定日期(天)时间(每小时)总租车人数,
响应变量y (cnt = casual + registered)
3. 问题
利用线性拟合、神经网络方法预测结果
一、线性拟合
1. 数据获取
#读取数据到内存中,rides为一个dataframe对象
data_path = 'hour.csv'
rides = pd.read_csv(data_path)
print(rides.shape)
(17379, 17)
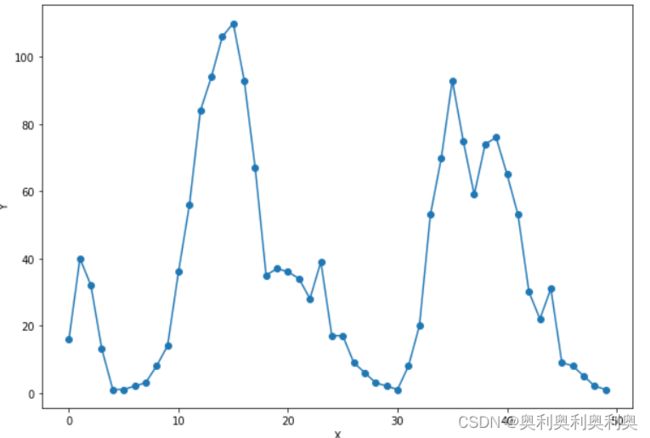
2. 获取前50条数据
#我们取出最后一列的前50条记录来进行预测
counts = rides['cnt'][:50]

#获得变量x,它是1,2,……,50
x = np.arange(len(counts))

# 将counts转成预测变量(标签):y
y = np.array(counts)

# 绘制一个图形,展示曲线长的样子
plt.figure(figsize = (10, 7)) #设定绘图窗口大小
plt.plot(x, y, 'o-') # 绘制原始数据
plt.xlabel('X') #更改坐标轴标注
plt.ylabel('Y') #更改坐标轴标注
plt.show()
3. 训练
#我们取出数据库的最后一列的前50条记录来进行预测
counts = rides['cnt'][:50]

# 创建变量x,它是1,2,……,50
x = torch.tensor(np.arange(len(counts)), dtype=torch.double, requires_grad = True)

# 将counts转成预测变量(标签):y
y = torch.tensor(np.array(counts), dtype=torch.double, requires_grad = True)

a = torch.rand(1, dtype=torch.double, requires_grad = True) #创建a变量,并随机赋值初始化
b = torch.rand(1, dtype=torch.double, requires_grad = True) #创建b变量,并随机赋值初始化
print('Initial parameters:', [a, b])
learning_rate = 0.00001 #设置学习率
for i in range(10000):
    ### 增加了这部分代码,清空存储在变量a,b中的梯度信息,以免在backward的过程中会反复不停地累加
    predictions = a * x+ b  #计算在当前a、b条件下的模型预测数值
    loss = torch.mean((predictions - y) ** 2) #通过与标签数据y比较,计算误差

    if i % 1000 == 0:
      print('loss:', loss)
    loss.backward() #对损失函数进行梯度反传
    a.data.add_(- learning_rate * a.grad.data)  #利用上一步计算中得到的a的梯度信息更新a中的data数值
    b.data.add_(- learning_rate * b.grad.data)  #利用上一步计算中得到的b的梯度信息更新b中的data数值
    a.grad.data.zero_() #清空a的梯度数值
    b.grad.data.zero_() #清空b的梯度数值
Initial parameters: [tensor([0.7516], dtype=torch.float64, requires_grad=True), tensor([0.5039], dtype=torch.float64, requires_grad=True)] loss: tensor(1431.4368, dtype=torch.float64, grad_fn=) loss: tensor(1351.0366, dtype=torch.float64, grad_fn= ) loss: tensor(1347.5489, dtype=torch.float64, grad_fn= ) loss: tensor(1344.0968, dtype=torch.float64, grad_fn= ) loss: tensor(1340.6801, dtype=torch.float64, grad_fn= ) loss: tensor(1337.2984, dtype=torch.float64, grad_fn= ) loss: tensor(1333.9513, dtype=torch.float64, grad_fn= ) loss: tensor(1330.6385, dtype=torch.float64, grad_fn= ) loss: tensor(1327.3596, dtype=torch.float64, grad_fn= ) loss: tensor(1324.1143, dtype=torch.float64, grad_fn= )
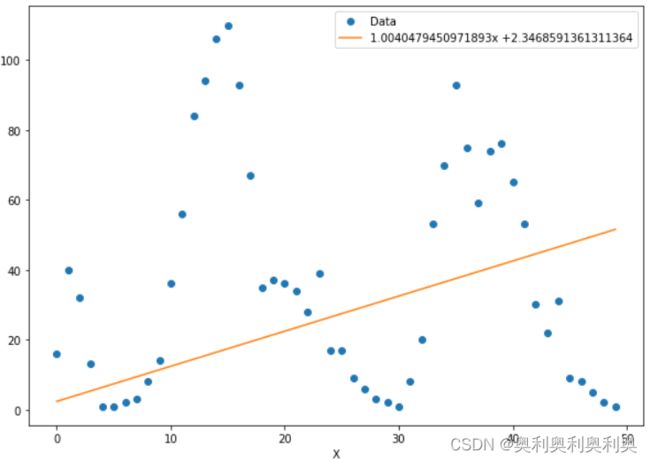
4. 绘制
# 绘制图形,展现线性回归的效果,结果惨不忍睹

x_data = x.data.numpy() # 获得x包裹的数据
plt.figure(figsize = (10, 7)) #设定绘图窗口大小
xplot, = plt.plot(x_data, y.data.numpy(), 'o') # 绘制原始数据

yplot, = plt.plot(x_data, predictions.data.numpy())  #绘制拟合数据
plt.xlabel('X') #更改坐标轴标注
plt.ylabel('Y') #更改坐标轴标注
str1 = str(a.data.numpy()[0]) + 'x +' + str(b.data.numpy()[0]) #图例信息
plt.legend([xplot, yplot],['Data', str1]) #绘制图例
plt.show()
三、 人工神经网络预测器1(未进行属性归一化)
利用前50条数据的标签值、进行1~50的编号(单一属性X∈[1,50])
搭建1(input)-10(hidden1)-1(output)的神经网络模型进行预测
1、特征获取:
前50条数据,编号1-50(标号作为特征)
import numpy as np
import pandas as pd
import matplotlib.pyplot as plt
import torch
import torch.optim as optim   #优化算法的库

# 一、读取数据
data_path = r"../data/hour.csv"
rides = pd.read_csv(data_path)
print(rides.head(10))

# 二、截取前50条数据观测特征
# 截取前50条观看一下特征
data = rides.iloc[:50,-1]
y50 = np.array(data.tolist())  #转换为array格式
print(y50)
x50 = np.arange(len(y50))
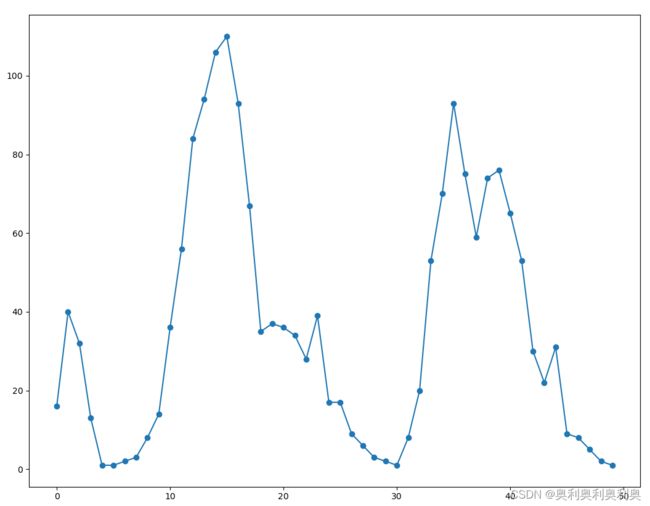
print(x50)
plt.plot(x50, y50, 'o-')  # 绘制图像
plt.show()   # 显示图像--------------------------------------
2、训练准备:
准备wight、biases、数据格式化
x: (50(样本数),1)
w1:(1,10)
b1: (10,)
hidden = x*w1+b1 (50(样本数),10)
w2: (10,1)
out = hidden*w2 (50(样本数),1)
# 四、第一个人工神经网路预测器
print("---四、第一个人工神经网路预测器---")
# 输入:1~50(x50) 输出预测值:拟合y50
x = torch.tensor(x50, dtype=float, requires_grad=True)
y = torch.tensor(y50, dtype=float, requires_grad=True)
# 设置隐含层数量
sz = 10

# 构建所有神经元的权重与阈值
# randn(Normal)是从标准正态分布中返回一个或多个样本值,即这些随机数的期望为0,方差为1
# rand则会产生[0, 1)之间的随机数
weights = torch.randn((1, 10), dtype=torch.double, requires_grad=True)  # 1*10的输入到隐含层的权重矩阵
biases = torch.randn(10, dtype=torch.double, requires_grad=True)  # 尺寸为10的隐含层节点偏置向量?

weights2 = torch.randn((10, 20), dtype=torch.double, requires_grad=True)  # 1*10的输入到隐含层的权重矩阵
biases2 = torch.randn(20, dtype=torch.double, requires_grad=True)  # 尺寸为10的隐含层节点偏置向量?

weights3 = torch.randn((20, 10), dtype=torch.double, requires_grad=True)  # 1*10的输入到隐含层的权重矩阵
biases3 = torch.randn(10, dtype=torch.double, requires_grad=True)  # 尺寸为10的隐含层节点偏置向量?

weights4 = torch.randn((10, 1), dtype=torch.double, requires_grad=True)  # 10*1的隐含层到输出的权重矩阵
print(weights,weights.shape)  # torch.Size([1, 10])
print(biases,biases.shape)  # torch.Size([10])
print(weights2,weights2.shape)  # torch.Size([10, 1])

# 设置学习率
learning_rate = 0.001
losses = []

print(x.shape)
# view()函数用法示例及其参数详解
# view()是对PyTorch中的Tensor操作的,可使用data=torch.tensor(data)来进行转换。
# 相当于Numpy中的resize()或者Tensorflow中的reshape()。

# 将x转换为(50,1)的维度,以便与维度为(1,10)的weights矩阵相乘
x = x.view(50,-1)
y = y.view(50,-1)
3、训练
利用50条数据进行100000次训练/下降
for i in range(100000):
    hidden1 = x * weights + biases
    hidden1 = torch.sigmoid(hidden1)
    hidden2 = hidden1.mm(weights2) + biases2
    hidden2 = torch.sigmoid(hidden2)
    hidden3 = hidden2.mm(weights3) + biases3
    hidden3 = torch.sigmoid(hidden3)

    pre = hidden3.mm(weights4)
    loss = torch.mean((pre-y)**2)
    losses.append(loss.data.numpy())  # 记录每一次下降的损失值

    if i % 10000 == 0:
        print('loss:', loss)

    # 反向传播
    loss.backward()

    weights.data.add_(- learning_rate * weights.grad.data)
    weights2.data.add_(- learning_rate * weights2.grad.data)
    weights3.data.add_(- learning_rate * weights3.grad.data)
    biases.data.add_(- learning_rate * biases.grad.data)
    biases2.data.add_(- learning_rate * biases2.grad.data)
    biases3.data.add_(- learning_rate * biases3.grad.data)
    weights4.data.add_(- learning_rate * weights4.grad.data)

    # 清空梯度
    weights.grad.data.zero_()
    weights2.grad.data.zero_()
    weights3.grad.data.zero_()
    biases.grad.data.zero_()
    biases2.grad.data.zero_()
    biases3.grad.data.zero_()
    weights4.grad.data.zero_()
loss: tensor(2264.9959, dtype=torch.float64, grad_fn=
) loss: tensor(719.6381, dtype=torch.float64, grad_fn= ) loss: tensor(556.7030, dtype=torch.float64, grad_fn= ) loss: tensor(502.0751, dtype=torch.float64, grad_fn= ) loss: tensor(470.8991, dtype=torch.float64, grad_fn= ) loss: tensor(466.0242, dtype=torch.float64, grad_fn= ) loss: tensor(463.4745, dtype=torch.float64, grad_fn= ) loss: tensor(462.1141, dtype=torch.float64, grad_fn= ) loss: tensor(460.9889, dtype=torch.float64, grad_fn= ) loss: tensor(459.2481, dtype=torch.float64, grad_fn= )
4、绘制图像
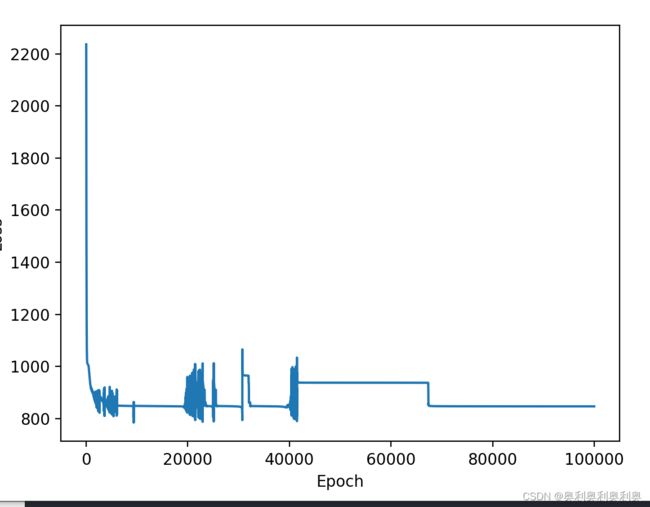
绘制下降曲线、拟合曲线(最后一次的predict)
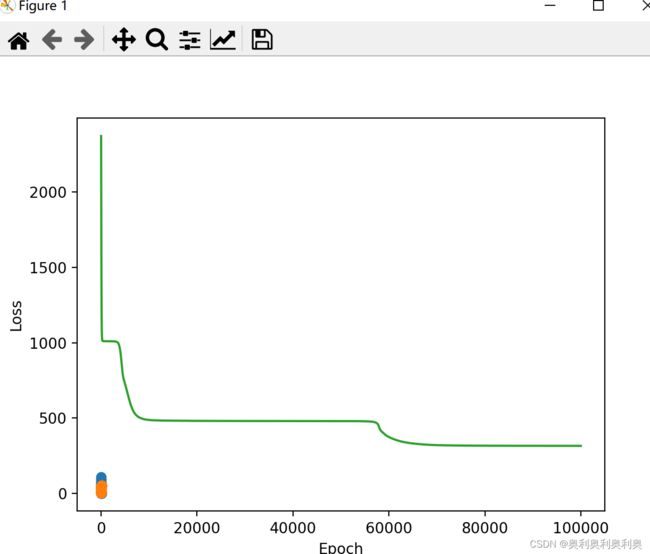
# 绘制误差曲线
plt.plot(losses)
plt.xlabel("Epoch")
plt.ylabel("Loss")
plt.show()

# 绘制打印预测值与实际值差异图像
X2 = x.data.numpy()  # 获得x包裹的数据  numpy.ndarray 与 torch.Tensor
print(type(X2))

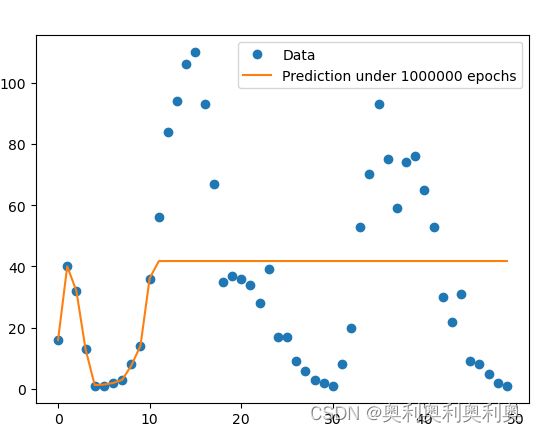
plt1, = plt.plot(X2, y.data.numpy(), 'o')   # 绘制原始数据
plt2, = plt.plot(X2, pre.data.numpy())
plt.legend([plt1, plt2], ['Data', 'Prediction under 1000000 epochs']) # 绘制图例
plt.show()
四、人工神经网络预测器2(属性归一化,效果较好)并预测
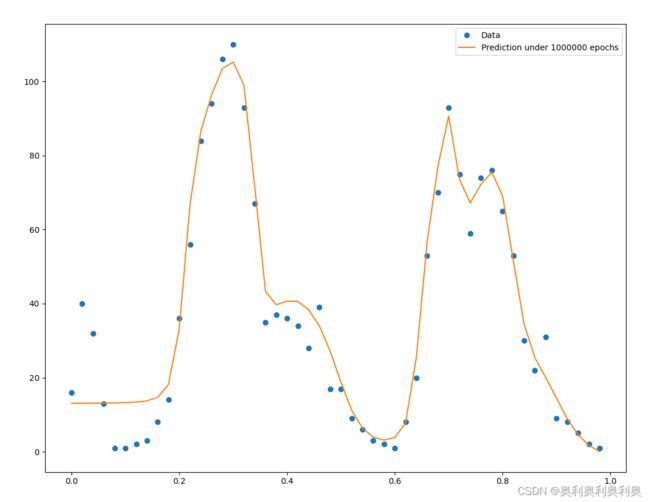
1. 实际操作:将“人工神经网络预测器1”中的“二、训练准备:”中的第三行属性X进行归一化处理
x = torch.tensor(x50/50, dtype=float, requires_grad=True)2. 效果:可以看出结果好的多,网络能对数据进行更好的拟合
3. 属性操作:对下面0~50的值除以50,使得X∈[0,1]
4. 归一化的重要性:
(111条消息) 神经网络为什么要归一化_老饼讲解-BP神经网络的博客-CSDN博客_神经网络归一化
5. 对50-100条数据进行预测并绘制图像
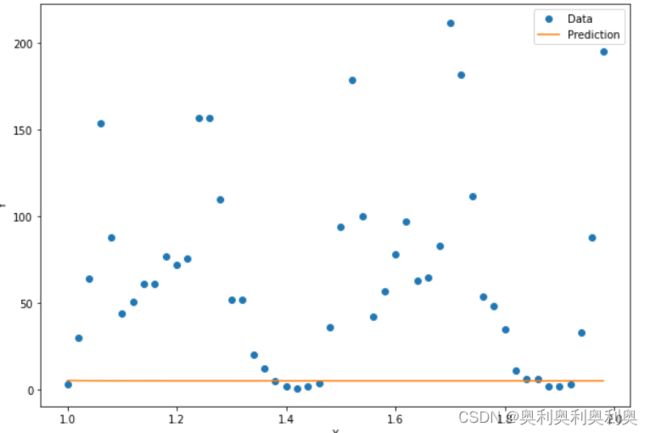
counts_predict = rides['cnt'][50:100] #读取待预测的接下来的50个数据点

#首先对接下来的50个数据点进行选取,注意x应该取51,52,……,100,然后再归一化
x = torch.tensor((np.arange(50, 100, dtype = float) / len(counts))
                 , requires_grad = True)
#读取下50个点的y数值,不需要做归一化
y = torch.tensor(np.array(counts_predict, dtype = float), requires_grad = True)

x = x.view(50, -1)
y = y.view(50, -1)

# 从输入层到隐含层的计算
hidden = x * weights + biases
# 将sigmoid函数作用在隐含层的每一个神经元上
hidden = torch.sigmoid(hidden)
# 隐含层输出到输出层,计算得到最终预测
predictions = hidden.mm(weights2)
# 计算预测数据上的损失函数
loss = torch.mean((predictions - y) ** 2)
print(loss)


x_data = x.data.numpy() # 获得x包裹的数据
plt.figure(figsize = (10, 7)) #设定绘图窗口大小
xplot, = plt.plot(x_data, y.data.numpy(), 'o') # 绘制原始数据
yplot, = plt.plot(x_data, predictions.data.numpy())  #绘制拟合数据
plt.xlabel('X') #更改坐标轴标注
plt.ylabel('Y') #更改坐标轴标注
plt.legend([xplot, yplot],['Data', 'Prediction']) #绘制图例
plt.show()
结果:预测失败,存在着非常严重的过拟合现象!原因是x和y根本就没有关系!
五、人工神经网络Neu1(利用几乎所有的属性进行预测)
1. 数据获取与预处理(独热、归一、抛弃)
a.引头文件、获取数据
# 构建神经网络并进行训练
# 利用多参数预测
import numpy as np
import pandas as pd
import matplotlib.pyplot as plt
import torch

path = "../data/hour.csv"
rides = pd.read_csv(path)
print(rides)
b.独热编码、抛弃无关属性
# 独热编码+删除无关属性:季节、小时、月份、天气、星期
one_hot_arr = ["season", "hr", "mnth", "weathersit","weekday"]
for arr in one_hot_arr:
    new_one_hot_arr = pd.get_dummies(rides[arr], prefix=arr, drop_first=False)  # 独热编码
    rides = pd.concat([rides, new_one_hot_arr], axis=1)   # 拼接
rides.drop(one_hot_arr, axis=1, inplace=True)  # 丢弃掉独热原属性
drop_list = ["instant", "dteday", "workingday", "atemp"]  # 日期、序列、工作日、atemp?
rides.drop(drop_list, axis=1, inplace=True)  # 丢弃掉独热原属性
pd.set_option('display.max_columns', None)
print("---"*20)
print(rides)
c. 数据标准差归一化(X = X-mean/std): cnt:使用量(结果)、温度、风速、湿度
# 归一化 标准化
quant_features = ['cnt', 'temp', 'hum', 'windspeed']
scaled_features = {}  # 存放以上属性的mean std?????????????
for arr in quant_features:
    mean, std = rides[arr].mean(), rides[arr].std()
    scaled_features[arr] = [mean, std]
    print("-----arr-----",arr)
    print(rides[arr])
    rides.loc[:,arr] = (rides[arr]-mean)/std
    print(rides[arr])
2. 数据分割与格式转化
# 数据分割: 最后的21天*24小时为数据集
test_data = rides[-21*24:]
train_data = rides[:-21*24]
print("训练集长度:",len(train_data),"测试集长度:",len(test_data))

# 目标列:
target_arr = ['casual',  'registered',  'cnt']
X_arr = train_data.drop(target_arr, axis=1).columns.tolist()  # 获取输入属性
train_X, test_X,  train_Y, test_Y,  train_y, test_y = train_data[X_arr], test_data[X_arr], train_data[target_arr], test_data[target_arr], train_data['cnt'], test_data['cnt']
print(train_X.shape, test_X.shape,  train_Y.shape, test_Y.shape, train_y.shape, test_y.shape)   # (16875, 56) (504, 56) (16875, 3) (504, 3) (16875,) (504,)

# 将数据从pandas dataframe转换为numpy: 训练数据
X = train_X.values  # numpy.ndarray
Y = train_y.values  # numpy.ndarray
print(Y)
Y = np.reshape(Y, [len(Y),1])  # 改变格式
print(Y)
训练集长度: 16875 测试集长度: 504
(16875, 56) (504, 56) (16875, 3) (504, 3) (16875,) (504,)
转化前的Y(b)
[-0.95631172 -0.82399838 -0.86810283 ... 1.30955431 0.60939619
0.30617811]转化后的Y(b,1)
[[-0.95631172]
[-0.82399838]
[-0.86810283]
...
[ 1.30955431]
[ 0.60939619]
[ 0.30617811]]
3. 搭建网络(参数定义、手动搭建网络、定义代价函数、梯度归零、梯度下降函数)
# 有56个属性
# 搭建网络
input_size = X.shape[1]
hidden_size = 10   # 隐藏层单元个数
out_size = 1   # 输出层单元
batch_size = 128  # 分簇数

weight1 = torch.randn([input_size, hidden_size], dtype=torch.double, requires_grad=True)
biases1 = torch.randn([hidden_size], dtype=torch.double, requires_grad=True)
weight2 = torch.randn([hidden_size, out_size], dtype=torch.double, requires_grad=True)

def neu(x):
    hidden = x.mm(weight1) + biases1  # expand 广播扩展
    hidden = torch.sigmoid(hidden)
    output = hidden.mm(weight2)
    return output

def cost(x,y):
    error = torch.mean((x - y)**2)
    return error

def zero_grad():
    if weight1.grad is not None and biases1.grad is not None and weight2.grad is not None:
        weight1.grad.data.zero_()
        biases1.grad.data.zero_()
        weight2.grad.data.zero_()

def optimizer_step(learning_rate):
    # 梯度下降算法
    weight1.data.add_(-learning_rate * weight1.grad.data)
    biases1.data.add_(-learning_rate * biases1.grad.data)
    weight2.data.add_(-learning_rate * weight2.grad.data)
4. 训练
losses = []
for i in range(1000):
    batch_loss = []
    for j in range(0,len(X),batch_size):
        start = j
        end = (start + batch_size) if (start+batch_size
Loss: 1.211206183858819
Loss: 0.3539518979650292
Loss: 0.2832545914774846
Loss: 0.24223126779822884
Loss: 0.20611039516527674
Loss: 0.174881339507577
Loss: 0.14814992075540656
Loss: 0.12655080532265156
Loss: 0.1097122561248503
Loss: 0.0968049798639273
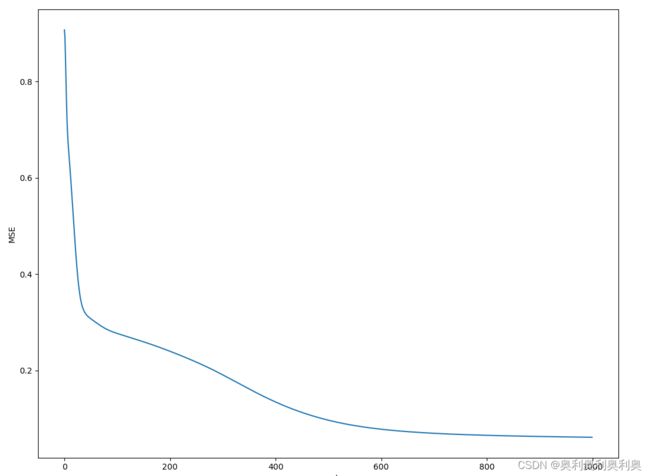
5. 绘制损失函数变化曲线
plt.plot(losses)
plt.show()
六、人工神经网络Neu2(调用PyTorch现成的函数,构建序列化的神经网络)
1. 数据获取与预处理(独热、归一、抛弃)
同 五、1
2. 数据分割与格式转化
同 五、2
3. 利用pytorch搭建网络
# 利用pytorch进行网络搭建----------------------------------------
Pinput_size = X.shape[1]
Phidden_size = 10
Poutput_size = 1
Pbatch_size = 128
neu = torch.nn.Sequential(
    torch.nn.Linear(Pinput_size, Phidden_size),
    torch.nn.Sigmoid(),
    torch.nn.Linear(Phidden_size, Poutput_size),
)
cost = torch.nn.MSELoss()
optimizer = torch.optim.SGD(neu.parameters(), lr=0.01)
4. 训练
losses = []
for i in range(1000):
    batch_loss = []
    for j in range(0, len(X), Pbatch_size):
        start = j
        end = (start + Pbatch_size) if (start + Pbatch_size < len(X)) else len(X)
        xx = torch.tensor(X[start:end], dtype=torch.float, requires_grad=True)
        yy = torch.tensor(Y[start:end], dtype=torch.float, requires_grad=True)
        predict = neu(xx)  # 预测
        loss = cost(predict, yy)  # 代价   ----不能反过来?
        optimizer.zero_grad()  # 归零
        loss.backward()   # 反传
        optimizer.step()  # 下降
        # print(loss.data.numpy())
        batch_loss.append(loss.data.numpy())
    Loss = np.mean(batch_loss)
    losses.append(Loss)
    if i%100==0:
        print(i,Loss)
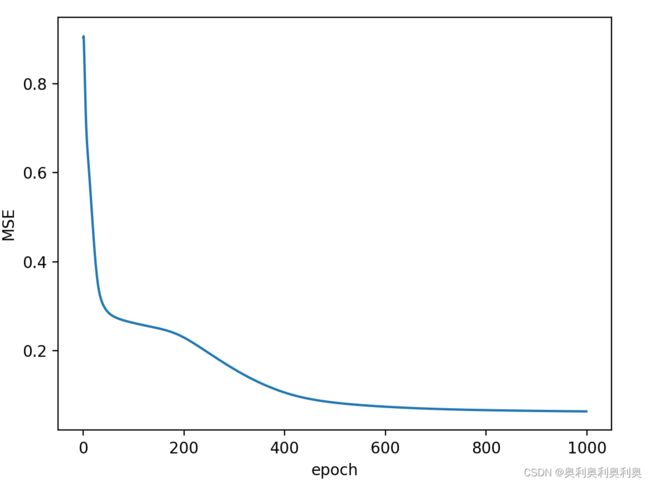
5. 绘制损失函数
plt.plot(losses)
plt.xlabel('epoch')
plt.ylabel('MSE')
plt.show()
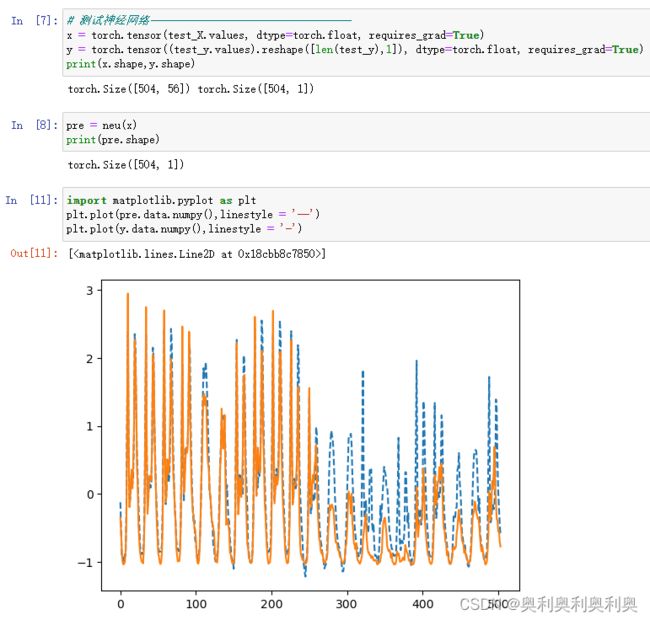
七、测试"六"模型的预测结果(绘图比对后21天的数据)
1. 获取数据、预测
# 测试神经网络----------------------------------
x = torch.tensor(test_X.values, dtype=torch.float, requires_grad=True)
y = torch.tensor((test_y.values).reshape([len(test_y),1]), dtype=torch.float, requires_grad=True)
print(x.shape,y.shape)
pre = neu(x)
print(pre.shape)
plt.plot(pre.data.numpy(),linestyle = '--')
plt.plot(y.data.numpy(),linestyle = '-')
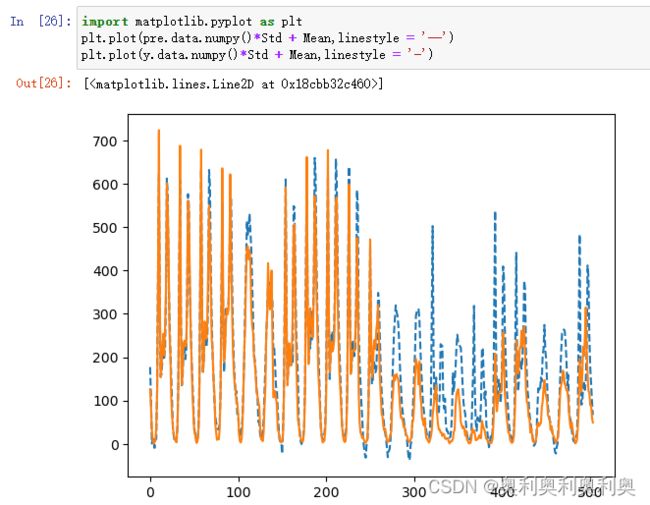
2. 1中的预测值是归一化后的数据、实现最终的预测需要进行逆归一化
X_s = X-mean / std X = X_s * std +mean
在前面归一化的时候存储“cnt”的Mean与Std
plt.plot(pre.data.numpy()*Std + Mean,linestyle = '--')
plt.plot(y.data.numpy()*Std + Mean,linestyle = '-')
八、网络诊断:略
九、将 人工神经网络Neu2改造为分类模型(二分类、以均值为划分依据)
1. 数据获取与预处理(独热、归一、抛弃)
同 五、1
2. 数据分割与格式转化
同 五、2
Y_labels = Y > np.mean(Y)
Y_labels = Y_labels.astype(int)
Y_labels = Y_labels.reshape(-1)
Y_labels
3. 利用pytorch搭建网络
# 重新构造用于分类的人工神经网络Neuc

input_size = features.shape[1]
hidden_size = 10
output_size = 2
batch_size = 128
neuc = torch.nn.Sequential(
    torch.nn.Linear(input_size, hidden_size),
    torch.nn.Sigmoid(),
    torch.nn.Linear(hidden_size, output_size),
    torch.nn.Sigmoid(),
)
# 将损失函数定义为交叉熵
cost = torch.nn.CrossEntropyLoss()
optimizer = torch.optim.SGD(neuc.parameters(), lr = 0.1)
4. 训练
# 定义一个专门计算分类错误率的函数,它的基本思想是,对于预测向量predictions的每一行,
# 取最大的那个元素的下标,与标签labels中的元素做比较
def error_rate(predictions, labels):
    """计算预测错误率的函数,其中predictions是模型给出的一组预测结果,labels是数据之中的正确答案"""
    predictions = np.argmax(predictions, 1)
    return 100.0 - (
      100.0 *
      np.sum( predictions == labels) /
      predictions.shape[0])

# 神经网络训练循环
losses = []
errors = []
for i in range(4000):
    # 每128个样本点被划分为一个撮
    batch_loss = []
    batch_errors = []
    for start, end in zip(range(0, len(X), batch_size), range(batch_size, len(X)+1, batch_size)):
        xx = torch.tensor(X[start:end], dtype = torch.float, requires_grad = True)
        yy = torch.tensor(Y_labels[start:end], dtype = torch.long)
        predict = neuc(xx)
        loss = cost(predict, yy)
        err = error_rate(predict.data.numpy(), yy.data.numpy())
        optimizer.zero_grad()
        loss.backward()
        optimizer.step()
        batch_loss.append(loss.data.numpy())
        batch_errors.append(err)

# 每隔100步输出一下损失值(loss)
    if i % 100==0:
        losses.append(np.mean(batch_loss))
        errors.append(np.mean(batch_errors))
        print(i, np.mean(batch_loss), np.mean(batch_errors))
5. 打印输出损失值
# 打印输出损失值
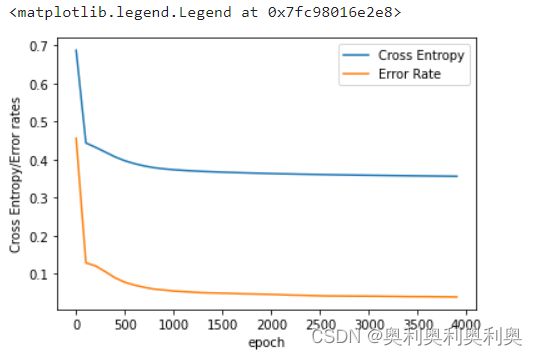
plt.plot(np.arange(len(losses))*100,losses, label = 'Cross Entropy')
plt.plot(np.arange(len(losses))*100, np.array(errors) / float(100), label = 'Error Rate')
plt.xlabel('epoch')
plt.ylabel('Cross Entropy/Error rates')
plt.legend()
6. 预测测试
# 读取测试数据
targets = test_targets['cnt']
targets = targets.values.reshape([len(targets), 1])
Y_labels = targets > np.mean(Y)
Y_labels = Y_labels.astype(int)
Y_labels = Y_labels.reshape(-1)
x = torch.tensor(test_features.values, dtype = torch.float, requires_grad = True)

# 打印神经网络预测的错误率
predict = neuc(x)
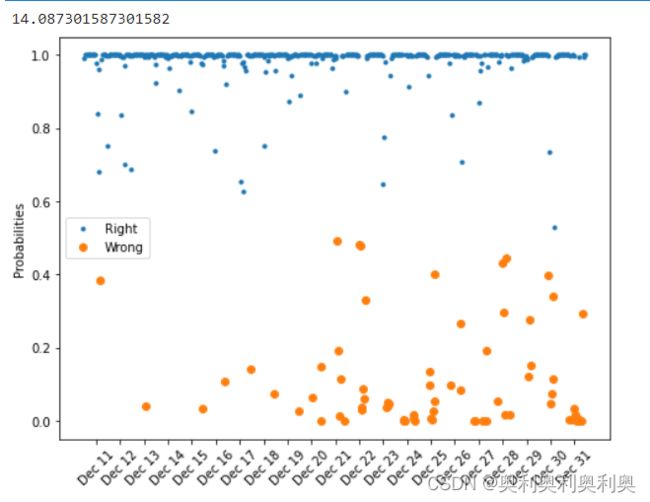
print(error_rate(predict.data.numpy(), Y_labels))

# 接下来,我们把预测正确的数据和错误的数据分别画出来,纵坐标分别是预测正确的概率和预测错误的概率
prob = predict.data.numpy()
rights = np.argmax(prob, 1) == Y_labels
wrongs = np.argmax(prob, 1) != Y_labels
right_labels = Y_labels[rights]
wrong_labels = Y_labels[wrongs]
probs = prob[rights, :]
probs1 = prob[wrongs, :]
rightness = [probs[i, right_labels[i]] for i in range(len(right_labels))]
right_index = np.arange(len(targets))[rights]
wrongness = [probs1[i, wrong_labels[i]] for i in range(len(wrong_labels))]
wrong_index = np.arange(len(targets))[wrongs]
fig, ax = plt.subplots(figsize = (8, 6))
ax.plot(right_index, rightness, '.', label='Right')
ax.plot(wrong_index, wrongness,'o',label='Wrong')

ax.legend()
plt.ylabel('Probabilities')

dates = pd.to_datetime(rides.loc[test_features.index]['dteday'])
dates = dates.apply(lambda d: d.strftime('%b %d'))
ax.set_xticks(np.arange(len(dates))[12::24])
_ = ax.set_xticklabels(dates[12::24], rotation=45)
