天池:数据分析达人赛1:用户情感可视化分析
【教学赛】数据分析达人赛1:用户情感可视化分析
赛题背景
赛题以网络舆情分析为背景,要求选手根据用户的评论来对品牌的议题进行数据分析与可视化。通过这道赛题来引导常用的数据可视化图表,以及数据分析方法,对感兴趣的内容进行探索性数据分析。
赛题数据
数据源: earphone_sentiment.csv,为10000+条行业用户关于耳机的评论
| 字段名称 | 类型 | 描述 | 说明 |
|---|---|---|---|
| content_id | Int | 数据ID | / |
| content | String | 文本内容 | / |
| subject | String | 主题 | 提取或依据上下文归纳出来的主题 |
| sentiment_value | Int | 情感分析 | 分析出的情感 |
| sentiment_word | String | 情感词 | 情感词 |
赛题任务
- 词云可视化(评论中的关键词,不同情感的词云)
- 柱状图(不同主题,不同情感,不同情感词)
- 相关性系数热力图(不同主题,不同情感,不同情感词)
代码实现
前情提要:
这个代码我是用Jupyter写的,可能在Github上看效果更好些。我在Github上传了另一个我的情感分析项目,比这个设计的内容要更全面,这是呢个项目的CSDN地址,GitHub项目地址。
这个耳机评论数据还是挺不好的,我不知道是不是故意的,让你把它变好?根据下面的前几张图,起初我以为题目会让你预测那70%的地方,但根本没法这么做,像sentiment_value ,sentiment_word你可以仔细看一下特别扯。下面的话,我仅仅去按找赛题任务,去编写代码实现一些画图。
画图的话,可以参考Seaborn,有些没有的就用最原始的Matplotlib。
-
导入常用的一些数据处理的包
import pandas as pd import numpy as np from matplotlib import pyplot as plt import seaborn as sns import warnings from pylab import * import jieba import jieba.posseg as pseg from wordcloud import WordCloud, STOPWORDS #导入模块worldcloud # from PIL import Image warnings.filterwarnings('ignore') # sns.set_context("talk", font_scale=0.5, rc={"lines.linewidth":4}) sns.set(font_scale=1.2) sns.set(rc={"lines.linewidth":1}) sns.set_style("whitegrid") # 设置中文 mpl.rcParams['font.sans-serif'] = u'SimHei' plt.rcParams['axes.unicode_minus'] = False -
读取数据
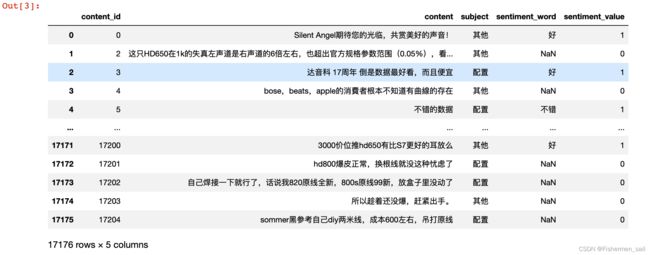
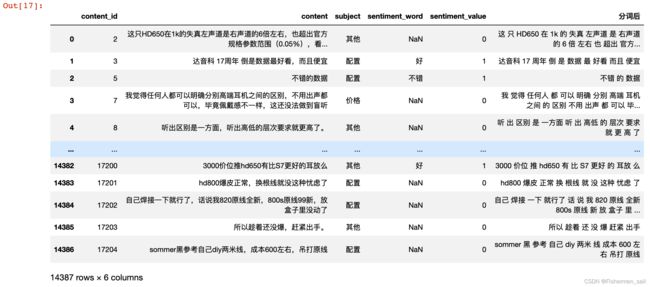
data = pd.read_csv('./earphone_sentiment.csv') data -
观察值的情况
data['subject'].unique()
data['sentiment_word'].unique()data['sentiment_value'].unique()
-
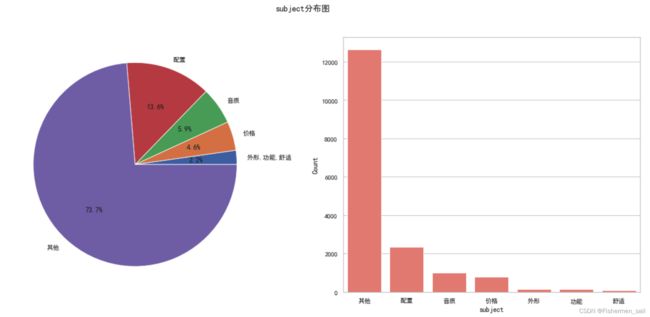
subject分布图绘制
df_subject = data['subject'].reset_index() df_subject.columns = ["Count", "subject"] df_subject = df_subject.groupby("subject").aggregate('count').reset_index() df_subject.sort_values(by="Count" , inplace=True, ascending=True) # 把‘外形’,‘功能’,‘舒适’归结为一个 sizes = df_subject['Count'].tolist() labels = df_subject['subject'].tolist() sizes = [sizes[0] + sizes[1] + sizes[2]] + sizes[3:] labels = ['外形,功能,舒适'] + labels[3:] _, axes=plt.subplots(1, 2, figsize=(20, 8)) plt.subplot(1, 2, 1) plt.pie(sizes, labels=labels, autopct='%1.1f%%',shadow=False, radius=1) df_subject.sort_values(by="Count" , inplace=True, ascending=False) sns.barplot(x='subject', y='Count', data=df_subject, color='salmon', ax=axes[1]) # plt.title("subject分布图") plt.suptitle('subject分布图') plt.show() -
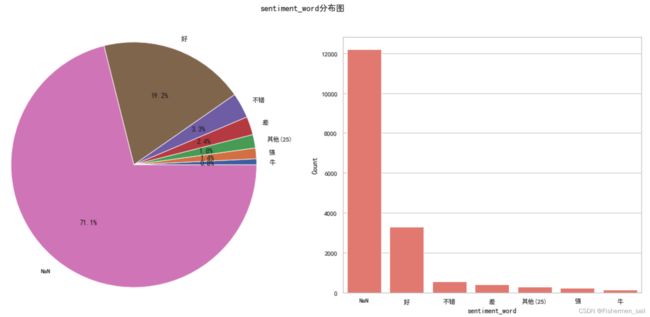
sentiment_word分布图绘制
df_subject = data['sentiment_word'].reset_index() nan_number = df_subject['sentiment_word'].isnull().sum () df_subject.columns = ["Count", "sentiment_word"] # aggregate统计不了Nan df_subject = df_subject.groupby("sentiment_word").aggregate('count').reset_index() df_subject.sort_values(by="Count" , inplace=True, ascending=True) sizes = df_subject['Count'].tolist() labels = df_subject['sentiment_word'].tolist() n = 0 sum_ = 0 for i in sizes: if i < 100: n += 1 sum_ += i sizes = sizes[n:] + [nan_number, sum_] labels = labels[n:] + ['NaN', '其他(' + str(n) + ")"] new_sizes = sorted(sizes) sizes = sorted(enumerate(sizes), key=lambda x : x[1]) new_labels = [] for i in sizes: new_labels.append(labels[i[0]]) _, axes=plt.subplots(1, 2, figsize=(20, 8)) plt.subplot(1, 2, 1) plt.pie(new_sizes, labels=new_labels, autopct='%1.1f%%',shadow=False, radius=1.2) sns.barplot(x=new_labels[::-1], y=new_sizes[::-1], color='salmon', ax=axes[1]) axes[1].set_ylabel('Count') axes[1].set_xlabel('sentiment_word') plt.suptitle('sentiment_word分布图') plt.show() -
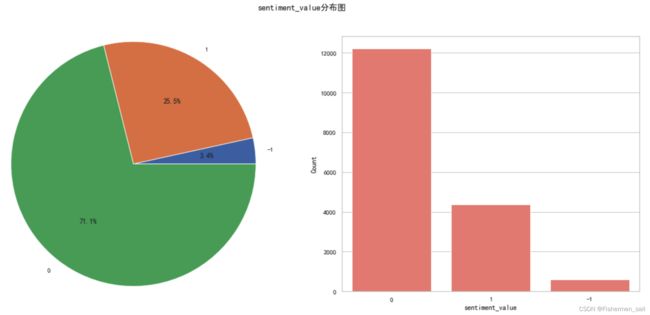
sentiment_value分布图绘制
df_subject = data['sentiment_value'].reset_index() df_subject.columns = ["Count", "sentiment_value"] df_subject = df_subject.groupby("sentiment_value").aggregate('count').reset_index() df_subject.sort_values(by="Count", inplace=True, ascending=True) _, axes=plt.subplots(1, 2, figsize=(20, 8)) plt.subplot(1, 2, 1) plt.pie(df_subject['Count'], labels=df_subject['sentiment_value'], autopct='%1.1f%%',shadow=False, radius=1.2) df_subject.sort_values(by="Count", inplace=True, ascending=False) # 这里必须加order属性,如果不加会按-1,0,1这样的由大到小的顺序 # 上面两个图没加还没问题,可能是因为x轴是str,所以又去根据y轴排序 sns.barplot(x='sentiment_value', y='Count', data=df_subject, color='salmon', order=df_subject["sentiment_value"], ax=axes[1]) plt.suptitle('sentiment_value分布图') plt.show() -
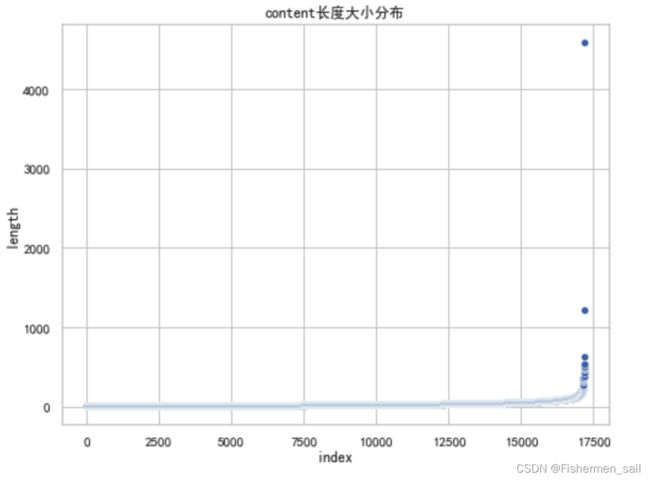
查看评论长度大小的分布
length = pd.DataFrame(columns=['length']) for index, row in data.iterrows(): length.loc[index] = len(row['content']) plt.figure(figsize=(8,6)) sns.scatterplot(data=length, x=range(length.shape[0]), y=np.sort(length['length'])) plt.xlabel('index') plt.ylabel('length') plt.title('content长度大小分布') plt.show() -
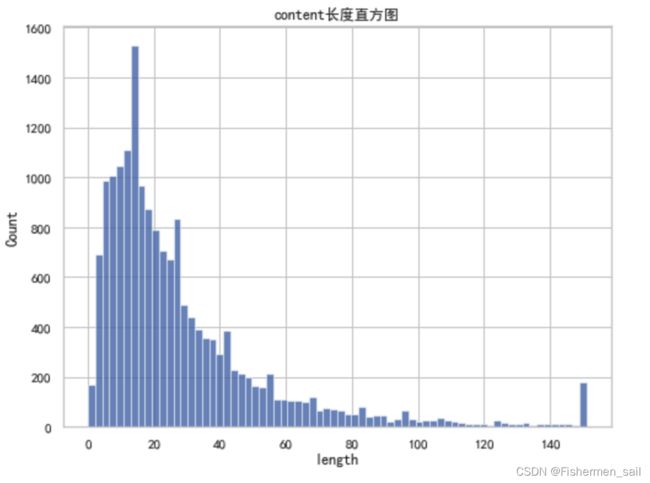
评论长度直方图
# 将大于150的点归为150 length['length'] = length['length'].map(lambda x: 150 if x > 150 else x) plt.figure(figsize=(8,6)) sns.histplot(data=length, x="length", bins=70, binrange=(0,151)) plt.title('content长度直方图') plt.show() -
对数据的一些简单处理
""" 删除重复数据 """ data = data.drop_duplicates(subset='content', keep='first') data # 17176 -> 16883 """ 删除标点符号或英文字母过多的评论 """ count = [] for index, row in data.iterrows(): other = 0 chinese = 0 for i in row['content']: if '\u4e00' <= i <= '\u9fa5': chinese += 1 else: other += 1 if chinese < other: count.append(index) for i in count: data = data.drop(i) data # 17176 -> 16883 -> 15058 """ 删除过长(250)和过短(5)的评论 """ data = data.drop(data[data['content'].str.len() < 5].index) data = data.drop(data[data['content'].str.len() > 250].index) data # 17176 -> 16883 -> 15058 -> 14387 -
开始分词
def fenci(text): # cut_word = [i for i in list(jieba.cut(text)) if '\u4e00' <= i <= '\u9fff'] cut_word = [i for i in list(jieba.cut(text)) if '\u4e00' <= i <= '\u9fff' or '\u0030' <= i <= '\u0039' or '\u0061' <= i <= '\u007a' or '\u0041' <= i <= '\u005a'] text = ' '.join(cut_word) return text data = data.reset_index(drop=True) data['分词后'] = '' for i in range(len(data)): data['分词后'].iloc[i] = fenci(data['content'].iloc[i]) data -
处理停用词(我,的,地,这种没什么实际意义的词)
stopwords = [i.strip() for i in open('./stoplist.txt', 'r').readlines()] pos_data = data[data['sentiment_value'] == 1] neg_data = data[data['sentiment_value'] == -1] neu_data = data[data['sentiment_value'] == 0] pos_str = '' neg_str = '' neu_str = '' str_ = '' list_ = [] for index, row in pos_data.iterrows(): str_ += row['分词后'] + ' ' list_ = str_.split(' ') for i in list_: if i not in stopwords: # remove有坑,会删不尽 # list_.remove(i) pos_str += i + ' ' pos_str = pos_str.rstrip() str_ = '' list_ = [] for index, row in neg_data.iterrows(): str_ += row['分词后'] + ' ' list_ = str_.split(' ') for i in list_: if i not in stopwords: neg_str += i + ' ' neg_str = neg_str.rstrip() str_ = '' list_ = [] for index, row in neu_data.iterrows(): str_ += row['分词后'] + ' ' list_ = str_.split(' ') for i in list_: if i not in stopwords: neu_str += i + ' ' neu_str = neu_str.rstrip() -
绘制云词图
plt.figure(figsize=(8,6)) wordcloud = WordCloud(font_path='./msyh.ttf',background_color='white', width=1800, height=800, max_words=300, max_font_size=180).generate(pos_str) plt.imshow(wordcloud) plt.axis('off') plt.title('积极情感词云图') plt.show() plt.figure(figsize=(8,6)) wordcloud = WordCloud(font_path='./msyh.ttf',background_color='white', width=1800, height=800, max_words=300, max_font_size=180).generate(neg_str) plt.imshow(wordcloud) plt.axis('off') plt.title('消极情感词云图') plt.show() plt.figure(figsize=(8,6)) wordcloud = WordCloud(font_path='./msyh.ttf',background_color='white', width=1800, height=800, max_words=300, max_font_size=180).generate(neu_str) plt.imshow(wordcloud) plt.axis('off') plt.title('中性情感词云图') plt.show() -
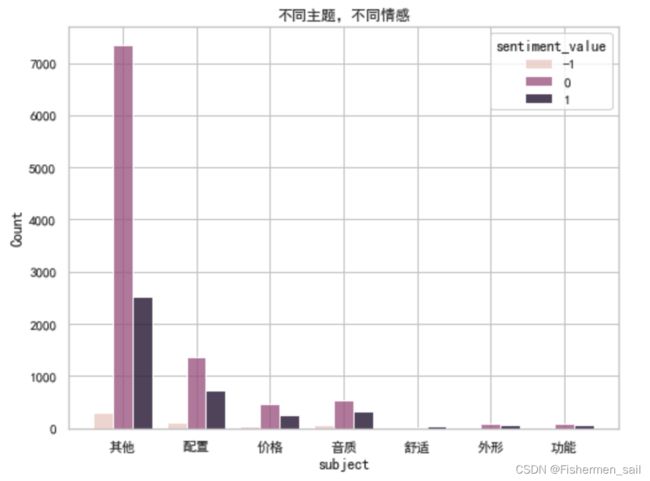
绘制柱状图(不同主题,不同情感)
plt.figure(figsize=(8,6)) sns.histplot(data=data, x="subject", hue="sentiment_value", multiple="dodge", shrink=.8) plt.title('不同主题,不同情感') plt.show() -
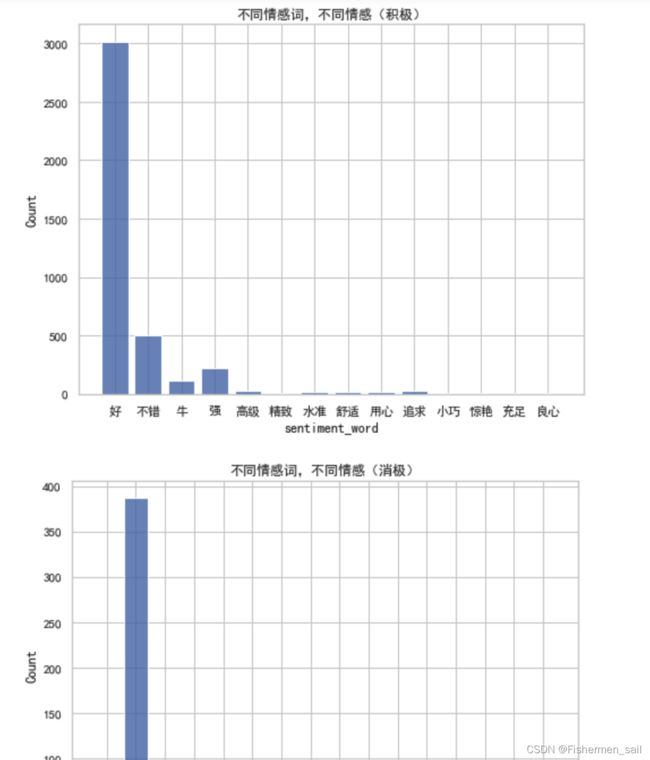
绘制柱状图(不同情感词,不同情感)
plt.figure(figsize=(8,6)) sns.histplot(data=pos_data, x="sentiment_word", shrink=.8) plt.title('不同情感词,不同情感(积极)') plt.show() plt.figure(figsize=(8,6)) sns.histplot(data=neg_data, x="sentiment_word", shrink=.8) plt.title('不同情感词,不同情感(消极)') plt.show() neu_data['sentiment_word'] = neu_data['sentiment_word'].fillna('NaN') plt.figure(figsize=(8,6)) sns.histplot(data=neu_data, x="sentiment_word", shrink=.8) plt.title('不同情感词,不同情感(中性)') plt.show() -
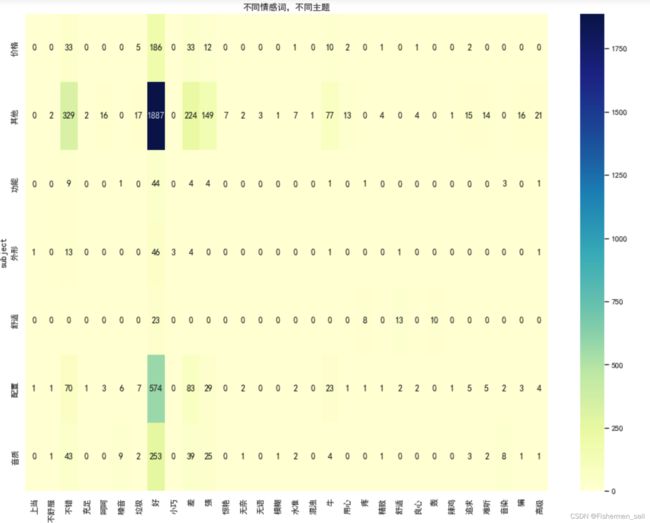
绘制热力图(不同情感词,不同主题)
# 创建透视表(count技术,np.sum求和)
pivot_data = data.pivot_table(columns='sentiment_word',index='subject',values='sentiment_value',aggfunc="count")
pivot_data = pivot_data.fillna(0)

plt.figure(figsize=(16,12))
sns.heatmap(pivot_data, annot=True, fmt=".0f", cmap="YlGnBu")
plt.title('不同情感词,不同主题')
plt.show()
