吴恩达机器学习课后作业ex1(python实现)
作业介绍
吴恩达老师的作业资源可以在github或者网上找到 。
ex1主要是对线性回归的一些复习和梯度下降、损失函数等的具体代码实现。
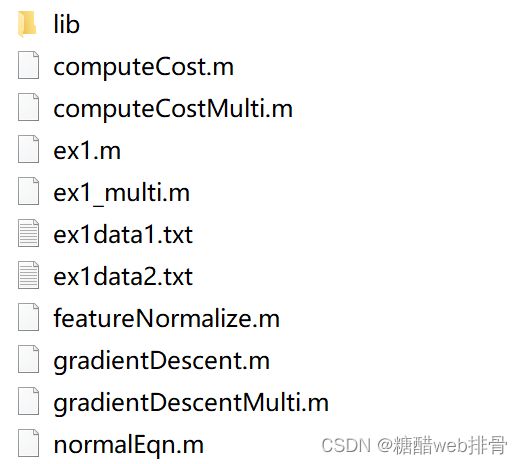
pdf文件是对作业的说明。文件夹则是作业数据的各种格式,python主要用到了txt文件。
单变量线性回归
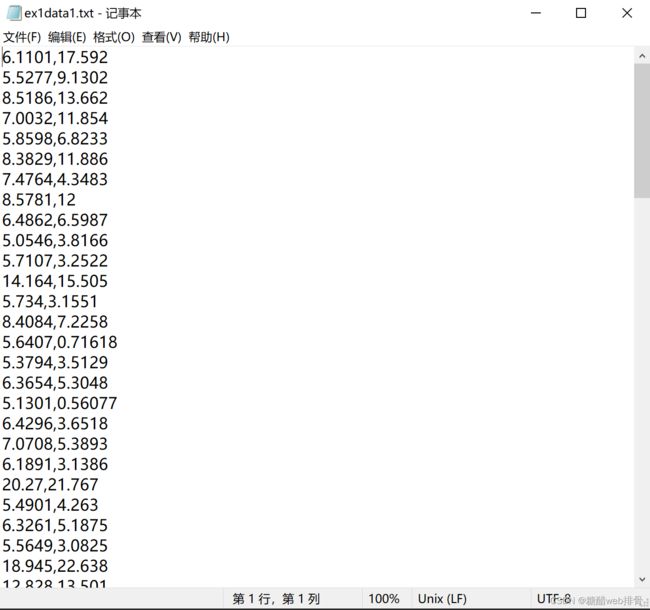
ex1data1.txt是由两列组成,第一列是城市人口数量,第二列是餐车收益。
这里我使用python进行初步的文件读入以及画图
import numpy as np
import matplotlib.pyplot as plt

#
data1 = open('ex1data1.txt')
data1 = data1.readlines()
tx = []
ty = []
for i in range(len(data1)):
    tx.append(float(data1[i].split(',')[0]))
    ty.append(float(data1[i].split(',')[1]))

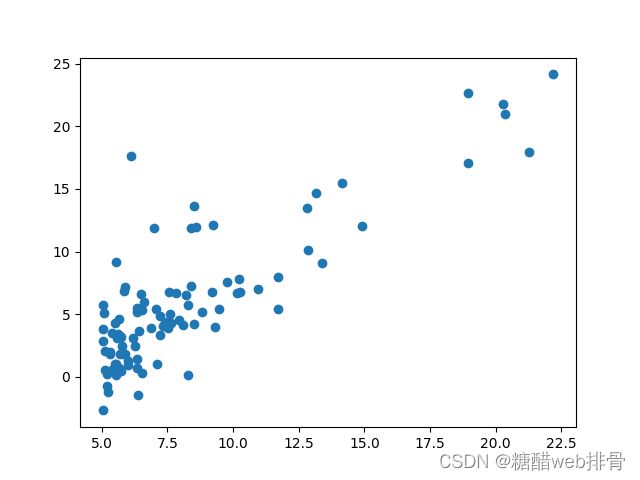
plt.scatter(tx, ty)
plt.show()
通过图像,可以大致看出x与y呈线性相关。
使用梯度下降法进行最佳参数拟合。
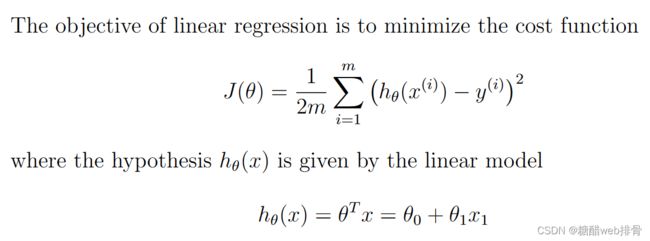
设计python中的损失函数和预测函数
def J_theta(theta, x, y):
    return np.sum(np.power(x * theta - y, 2)) / (2 * len(x))


def h_theta(theta, x):
    return x*theta


# 构造x
x = np.matrix(x).T
theta0 = np.ones(x.shape[0])
x = np.insert(x, 0, theta0, axis=1)
# 构造y
y = np.matrix(y).T

# 初始化
theta = np.zeros((2, 1))
iterations = 1500
alpha = 0.01


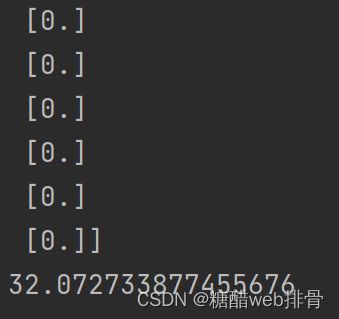
print(h_theta(theta, x))
print(J_theta(theta, x, y))
计算出初始损失值为32.07,与ex1文档中给出答案相同。
使用python对梯度下降进行编程。
# 初始化
theta = np.zeros((2, 1))
iterations = 1500
alpha = 0.01

# 梯度下降
for time in range(iterations):  # 迭代次数
    temp = x * theta - y
    for i in range(2):  # 改变theta
        theta[i, 0] -= alpha * np.sum(np.multiply(temp, x[:, i])) / len(x)

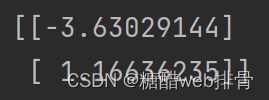
print(theta)

lx = np.linspace(5, 25, 100)
ly = [theta[0, 0] + theta[1, 0] * lx[i] for i in range(len(lx))]

plt.scatter(tx, ty)
plt.plot(lx, ly, c='r')
plt.show()
最后跑出来的参数
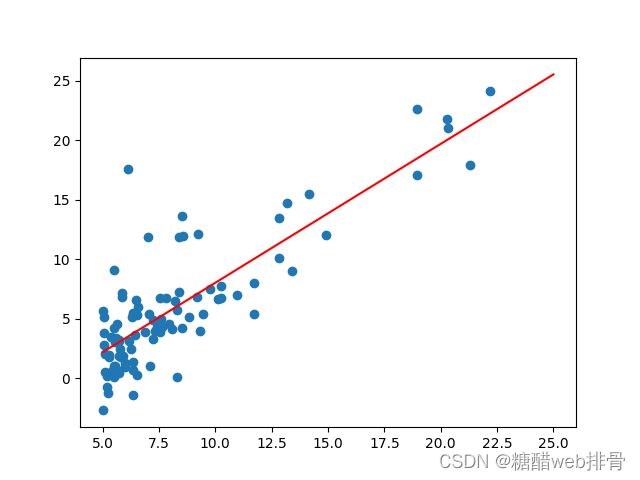
画出直线
可以看出拟合效果还是不错的。
源码:
import numpy as np
import matplotlib.pyplot as plt

#
data1 = open('ex1data1.txt')
data1 = data1.readlines()
tx = []
ty = []
for i in range(len(data1)):
    tx.append(float(data1[i].split(',')[0]))
    ty.append(float(data1[i].split(',')[1]))

plt.scatter(tx, ty)
plt.show()


def J_theta(theta, x, y):
    return np.sum(np.power(x * theta - y, 2)) / (2 * len(x))


def h_theta(theta, x):
    return x*theta


# 构造x
x = np.matrix(tx).T
theta0 = np.ones(x.shape[0])
x = np.insert(x, 0, theta0, axis=1)
# 构造y
y = np.matrix(ty).T

# 初始化
theta = np.zeros((2, 1))
iterations = 1500
alpha = 0.01

# 梯度下降
for time in range(iterations):  # 迭代次数
    temp = x * theta - y
    for i in range(2):  # 改变theta
        theta[i, 0] -= alpha * np.sum(np.multiply(temp, x[:, i])) / len(x)

print(theta)

lx = np.linspace(5, 25, 100)
ly = [theta[0, 0] + theta[1, 0] * lx[i] for i in range(len(lx))]

plt.scatter(tx, ty)
plt.plot(lx, ly, c='r')
plt.show()
多变量线性回归
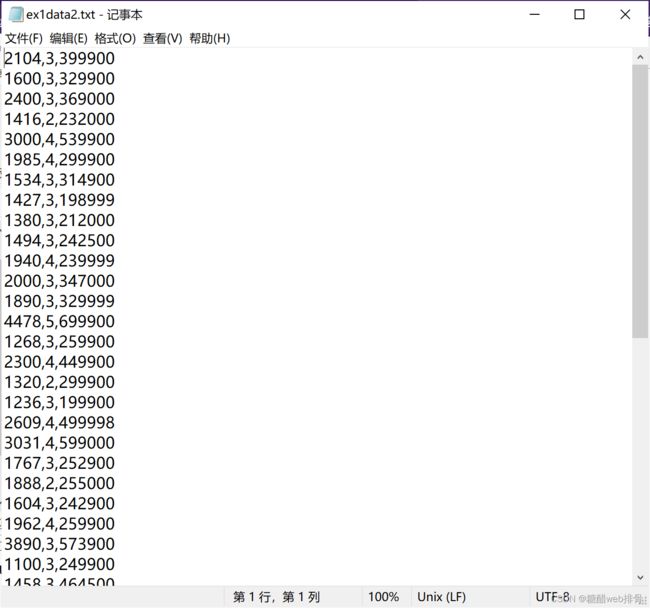
ex1data2.txt则存在两个变量,即两个x,一个y。文件记录了波特兰的房价,第一列是房子大小,第二列是卧室个数,第三列是价格。
同样是先经过python预处理,读入数据。
import numpy as np
import matplotlib.pyplot as plt
from sklearn import preprocessing

#
data2 = open('ex1data2.txt')
data2 = data2.readlines()
tx = []
ty = []
for i in range(len(data2)):
    tx.append([float(data2[i].split(',')[0]), float(data2[i].split(',')[1])])
    ty.append(float(data2[i].split(',')[2]))

ax = plt.subplot(projection='3d')
ax.scatter([tx[i][0] for i in range(len(tx))], [tx[i][1] for i in range(len(tx))], [ty[i] for i in range(len(tx))])
plt.show()
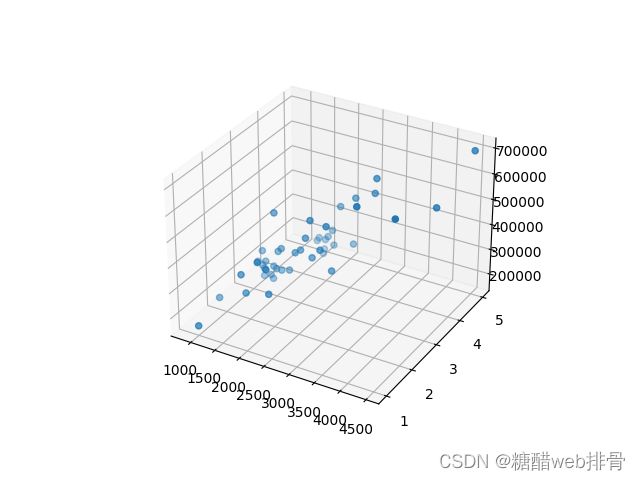
从图从图中可以看出相关性还是很明显的。由于数据之间单位相差过大,这里将数据进行归一化后再进行梯度下降。
# 构造xy
x = np.matrix(tx)
y = np.matrix(ty).T
# 归一化
x_scaler = preprocessing.MinMaxScaler()
x = x_scaler.fit_transform(x)
theta0 = np.ones(x.shape[0])
x = np.insert(x, 0, theta0, axis=1)


def J_theta(theta, x, y):
    return np.sum(np.power(np.dot(x, theta) - y, 2)) / (2 * len(x))


def h_theta(theta, x):
    return np.dot(x, theta)


# 初始化
theta = np.zeros((3, 1))
iterations = 5000
alpha = 0.01

# 梯度下降
for time in range(iterations):  # 迭代次数
    temp = h_theta(theta, x) - y
    for i in range(3):  # 改变theta
        theta[i, 0] -= alpha * np.sum(np.multiply(temp, x[:, i])) / len(x)

print(theta)
print(J_theta(theta, x, y))

lx = []
for i in range(101):
    for j in range(101):
        lx.append([0.01*i, 0.01*j])
lx = np.matrix(lx)

theta0 = np.ones(lx.shape[0])
temp = np.insert(lx, 0, theta0, axis=1)

ly = h_theta(theta, temp)

lx = x_scaler.inverse_transform(lx)

print(lx)
print(ly)

ax = plt.subplot(projection='3d')
ax.view_init(elev=10, azim=120)
ax.scatter([tx[i][0] for i in range(len(tx))], [tx[i][1] for i in range(len(tx))], [ty[i] for i in range(len(tx))])
ax.scatter(lx[:, 0], lx[:, 1], ly, c='r')
plt.show()
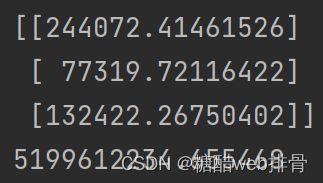
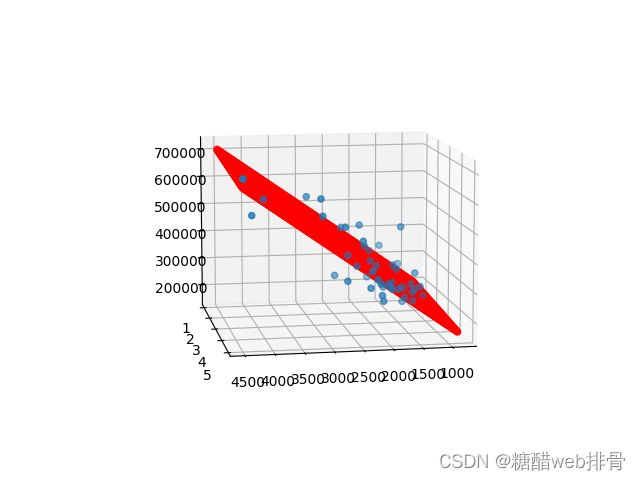
最后跑出来的参数和损失值,这里我认为没有拟合到最优。
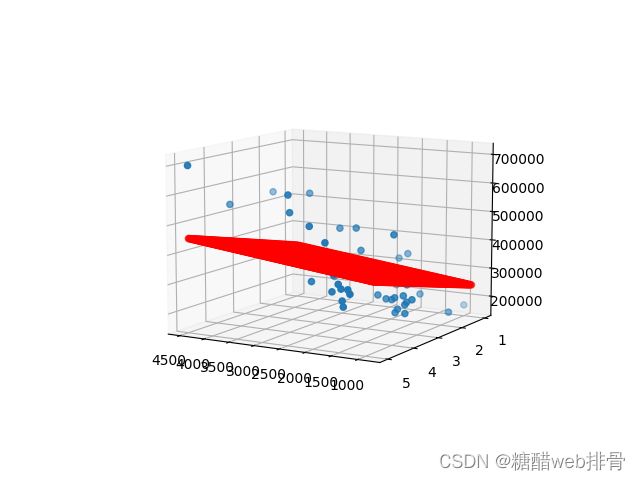
结果如图,效果还是不错的。
源码:
import numpy as np
import matplotlib.pyplot as plt
from sklearn import preprocessing


#
data2 = open('ex1data2.txt')
data2 = data2.readlines()
tx = []
ty = []
for i in range(len(data2)):
    tx.append([float(data2[i].split(',')[0]), float(data2[i].split(',')[1])])
    ty.append(float(data2[i].split(',')[2]))

ax = plt.subplot(projection='3d')
ax.scatter([tx[i][0] for i in range(len(tx))], [tx[i][1] for i in range(len(tx))], [ty[i] for i in range(len(tx))])
plt.show()

# 构造xy
x = np.matrix(tx)
y = np.matrix(ty).T
# 归一化
x_scaler = preprocessing.MinMaxScaler()
x = x_scaler.fit_transform(x)
theta0 = np.ones(x.shape[0])
x = np.insert(x, 0, theta0, axis=1)


def J_theta(theta, x, y):
    return np.sum(np.power(np.dot(x, theta) - y, 2)) / (2 * len(x))


def h_theta(theta, x):
    return np.dot(x, theta)


# 初始化
theta = np.zeros((3, 1))
iterations = 5000
alpha = 0.01

# 梯度下降
for time in range(iterations):  # 迭代次数
    temp = h_theta(theta, x) - y
    for i in range(3):  # 改变theta
        theta[i, 0] -= alpha * np.sum(np.multiply(temp, x[:, i])) / len(x)

print(theta)
print(J_theta(theta, x, y))

lx = []
for i in range(101):
    for j in range(101):
        lx.append([0.01*i, 0.01*j])
lx = np.matrix(lx)

theta0 = np.ones(lx.shape[0])
temp = np.insert(lx, 0, theta0, axis=1)

ly = h_theta(theta, temp)

lx = x_scaler.inverse_transform(lx)

print(lx)
print(ly)

ax = plt.subplot(projection='3d')
ax.view_init(elev=10, azim=120)
ax.scatter([tx[i][0] for i in range(len(tx))], [tx[i][1] for i in range(len(tx))], [ty[i] for i in range(len(tx))])
ax.scatter(lx[:, 0], lx[:, 1], ly, c='r')
plt.show()
单变量线性回归sklearn实现
还是一样的数据集,直接调用现成的库函数。
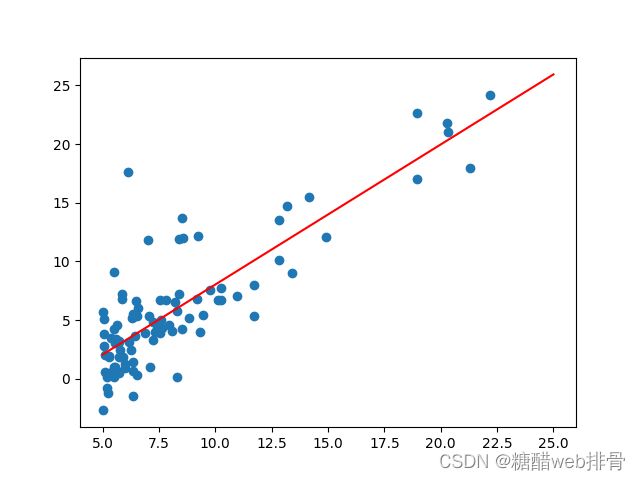
直接看拟合效果。
拟合的非常不错,并且代码量还少。
源码:
from sklearn import linear_model
import matplotlib.pyplot as plt
import numpy as np

#
data1 = open('ex1data1.txt')
data1 = data1.readlines()
tx = []
ty = []
for i in range(len(data1)):
    tx.append(float(data1[i].split(',')[0]))
    ty.append(float(data1[i].split(',')[1]))

plt.scatter(tx, ty)
plt.show()
# 构造x
x = np.matrix(tx).T
# 构造y
y = np.matrix(ty).T

LR = linear_model.LinearRegression()
# 用训练集训练模型fit
LR.fit(x, y)
# 预测
lx = np.matrix(np.linspace(5, 25, 100)).T
ly = LR.predict(lx)
print(ly)

plt.scatter(tx, ty)
plt.plot(lx, ly, c='r')
plt.show()
多变量线性回归sklearn实现
回到多变量这个例子,看看用现成的包会不会表现的更好。
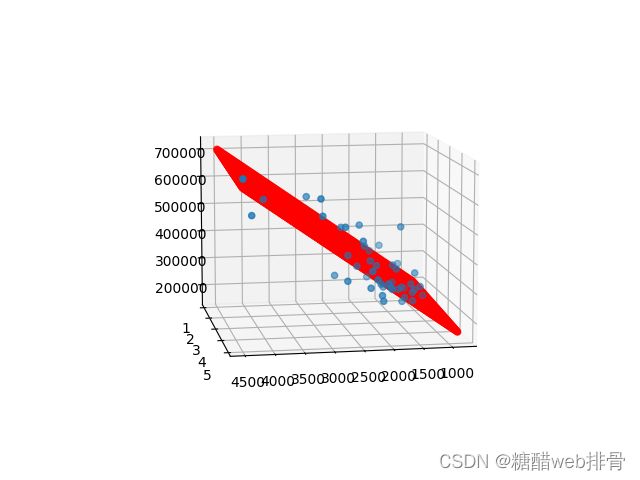
确实是比自己实现的代码更好,拟合的效果很不错,代码量也大大减少了。
源码:
from sklearn import linear_model
import matplotlib.pyplot as plt
import numpy as np
from sklearn import preprocessing

#
data2 = open('ex1data2.txt')
data2 = data2.readlines()
tx = []
ty = []
for i in range(len(data2)):
    tx.append([float(data2[i].split(',')[0]), float(data2[i].split(',')[1])])
    ty.append(float(data2[i].split(',')[2]))

ax = plt.subplot(projection='3d')
ax.scatter([tx[i][0] for i in range(len(tx))], [tx[i][1] for i in range(len(tx))], [ty[i] for i in range(len(tx))])
plt.show()

# 构造xy
x = np.matrix(tx)
y = np.matrix(ty).T
# 归一化
x_scaler = preprocessing.MinMaxScaler()
x = x_scaler.fit_transform(x)

#
LR = linear_model.LinearRegression()
# 用训练集训练模型fit
LR.fit(x, y)

lx = []
for i in range(101):
    for j in range(101):
        lx.append([0.01*i, 0.01*j])
lx = np.matrix(lx)
# 预测
ly = LR.predict(lx)
print(ly)
# 归一化逆变换
lx = x_scaler.inverse_transform(lx)

ax = plt.subplot(projection='3d')
ax.view_init(elev=10, azim=80)
ax.scatter([tx[i][0] for i in range(len(tx))], [tx[i][1] for i in range(len(tx))], [ty[i] for i in range(len(tx))])
ax.scatter(lx[:, 0], lx[:, 1], ly, c='r')
plt.show()
正规方程法
吴恩达老师在课程中还讲到了正规方程法,这种方法在数据量不大时比较好用,而且不需要进行归一化,在这里我对多变量线性回归进行了实现。
拟合效果
可以看出拟合的非常不错,实现起来也比较简单,所以在数据量比较小时,正规方程法也是一种合适的参数拟合的方法。
源码:
import matplotlib.pyplot as plt
import numpy as np
from sklearn import preprocessing

#
data2 = open('ex1data2.txt')
data2 = data2.readlines()
tx = []
ty = []
for i in range(len(data2)):
    tx.append([float(data2[i].split(',')[0]), float(data2[i].split(',')[1])])
    ty.append(float(data2[i].split(',')[2]))

ax = plt.subplot(projection='3d')
ax.scatter([tx[i][0] for i in range(len(tx))], [tx[i][1] for i in range(len(tx))], [ty[i] for i in range(len(tx))])
plt.show()

# 构造xy
x = np.matrix(tx)
x_scaler = preprocessing.MinMaxScaler()
x_scaler.fit(x)
y = np.matrix(ty).T
theta0 = np.ones(x.shape[0])
x = np.insert(x, 0, theta0, axis=1)

# 正规方程法
theta = np.dot(np.dot(np.linalg.inv(np.dot(x.T, x)), x.T), y)
print(theta)

lx = []
for i in range(101):
    for j in range(101):
        lx.append([0.01*i, 0.01*j])
lx = np.matrix(lx)
lx = x_scaler.inverse_transform(lx)
theta0 = np.ones(lx.shape[0])
temp = np.insert(lx, 0, theta0, axis=1)

ly = np.dot(temp, theta)
print(ly)

ax = plt.subplot(projection='3d')
ax.view_init(elev=10, azim=80)
ax.scatter([tx[i][0] for i in range(len(tx))], [tx[i][1] for i in range(len(tx))], [ty[i] for i in range(len(tx))])
ax.scatter(lx[:, 0], lx[:, 1], ly, c='r')
plt.show()


