【动手学深度学习Pycharm实现4】Softmax的从0开始实现
前言
李沐大神源代码是用Jupyter写的,笔者想用Pycharm实现并仅作为学习笔记,如有侵权,请联系笔者删除。
一、背景
Softmax跟前面的线性回归模型一样,是一个非常重要的模型,也是所有深度模型的基础,这也是沐神为什么建议我们从0开始实现,了解Softmax的所有细节。
二、代码如下
python版本:3.8.6
torch版本:1.11.0
d2l版本:0.17.5
import torch
from IPython import display
from d2l import torch as d2l
batch_size = 256
train_iter, test_iter = d2l.load_data_fashion_mnist(batch_size)
num_inputs = 784
num_outputs = 10
W = torch.normal(0,0.01,size=(num_inputs, num_outputs),requires_grad=True)
b = torch.zeros(num_outputs,requires_grad=True)
def softmax(X):
X_exp = torch.exp(X)
partition = X_exp.sum(1, keepdim=True) # 输入的X为矩阵,所以就是对矩阵每一行做Softmax,所以参数是1
return X_exp / partition # 运用了广播机制
X = torch.normal(0, 1, (2, 5))
X_prob = softmax(X)
print(X_prob)
print(X_prob.sum(1))
def net(X):
return softmax(torch.matmul(X.reshape((-1, W.shape[0])), W) + b)
"""
-1表示batch_size,因为SGD每次取batch_size个大小的数据进行
前面定义过batch_size大小,所以X经过reshape之后这里就是 X(256×784) 乘 W(784×10) 加 b(通过广播机制)
得到一个256×10的矩阵,表示256张图片10个类别的打分,最后经过Softmax将得分转为概率/置信度
"""
X = torch.normal(0, 1, (2, 5))
print(X)
print(X + 1)
# (下面是示例,搞懂交叉熵怎么计算的)拿出预测(向量)中,真实样本y下标对应的值,运行看结果就懂了
y = torch.tensor([0,2])
y_hat = torch.tensor([[0.1, 0.3, 0.6], [0.3, 0.2, 0.5]])
print(y_hat[[0, 1], y])
# 实现交叉熵损失函数
def cross_entropy(y_hat, y):
return -torch.log(y_hat[range(len(y_hat)), y]) # log以自然数e为底
# 将预测类别与真实y元素进行比较
def accuracy(y_hat, y):
"""计算预测正确的数量"""
if len(y_hat.shape) > 1 and y_hat.shape[1] > 1:
y_hat = y_hat.argmax(axis=1) # 在y_hat的每一行中提取最大概率的下标
cmp = y_hat.type(y.dtype) == y # y_hat每一行中若与y下标相同,则记为1,否则为0
return float(cmp.type(y.dtype).sum()) # 计算总和,即所有的1都加起来,就是预测正确的数量
print(accuracy(y_hat, y))
class Accumulator:
"""在'n'个变量上累加"""
def __init__(self, n):
self.data = [0.0] * n
def add(self, *args):
self.data = [a + float(b) for a, b in zip(self.data, args)]
def reset(self):
self.data = [0.0] * len(self.data)
def __getitem__(self, idx):
return self.data[idx]
def evaluate_accuracy(net, data_iter):
"""计算在指定数据集上模型的精度"""
if isinstance(net, torch.nn.Module):
net.eval() # 将模型转化为评估模式(输入数据只用于评估,不做反向传播)
metric = Accumulator(2)
for X, y in data_iter:
metric.add(accuracy(net(X), y), y.numel())
return metric[0] / metric[1]
#下面的代码可以查看上面函数运行结果
#if __name__=='__main__':
# print(evaluate_accuracy(net, test_iter))
def train_epoch_ch3(net, train_iter, loss, updater): # 训练一个epoch,ch3表示d2l第三章课程,没有其他意思
if isinstance(net, torch.nn.Module):
net.train()
metric = Accumulator(3)
for X, y in train_iter:
y_hat = net(X)
l = loss(y_hat, y)
if isinstance(updater, torch.optim.Optimizer): # 如果updater是torch中自带优化器(就是梯度下降)
updater.zero_grad()
l.backward()
updater.step()
metric.add(float(l) * len(y), accuracy(y_hat, y), y.size().numel())
else :
l.sum().backward()
updater(X.shape[0]) # X.shape[0]就是batch_size大小
metric.add(float(l.sum()), accuracy(y_hat, y), y.numel())
# metric[0]: 所有损失总和 metric[1]: 预测正确数量 metric[2]: 样本总数
return metric[0] / metric[2] , metric[1] / metric[2]
class Animator:
"""在动画中绘制数据"""
def __init__(self, xlabel=None, ylabel=None, legend=None, xlim=None,
ylim=None, xscale='linear', yscale='linear',
fmts=('-', 'm--', 'g-.', 'r:'), nrows=1, ncols=1,
figsize=(3.5, 2.5)):
# 增量地绘制多条线
if legend is None:
legend = []
d2l.use_svg_display()
self.fig, self.axes = d2l.plt.subplots(nrows, ncols, figsize=figsize)
if nrows * ncols == 1:
self.axes = [self.axes, ]
# 使用lambda函数捕获参数
self.config_axes = lambda: d2l.set_axes(
self.axes[0], xlabel, ylabel, xlim, ylim, xscale, yscale, legend)
self.X, self.Y, self.fmts = None, None, fmts
def add(self, x, y):
# 向图表中添加多个数据点
if not hasattr(y, "__len__"):
y = [y]
n = len(y)
if not hasattr(x, "__len__"):
x = [x] * n
if not self.X:
self.X = [[] for _ in range(n)]
if not self.Y:
self.Y = [[] for _ in range(n)]
for i, (a, b) in enumerate(zip(x, y)):
if a is not None and b is not None:
self.X[i].append(a)
self.Y[i].append(b)
self.axes[0].cla()
for x, y, fmt in zip(self.X, self.Y, self.fmts):
self.axes[0].plot(x, y, fmt)
self.config_axes()
display.display(self.fig)
display.clear_output(wait=True)
def train_ch3(net, train_iter, test_iter, loss, num_epochs, updater):
"""训练模型(定义见第3章)"""
animator = Animator(xlabel='epoch', xlim=[1, num_epochs], ylim=[0.3, 0.9],
legend=['train loss', 'train acc', 'test acc'])
for epoch in range(num_epochs):
train_metrics = train_epoch_ch3(net, train_iter, loss, updater)
test_acc = evaluate_accuracy(net, test_iter)
animator.add(epoch + 1, train_metrics + (test_acc,))
d2l.plt.show() # 这里显示最终结果图,动图不太会,感觉也不是很有必要,哈哈
train_loss, train_acc = train_metrics
lr = 0.1
def updater(batch_size):
return d2l.sgd([W, b], lr, batch_size)
num_epoch = 10
train_ch3(net, train_iter, test_iter, cross_entropy, num_epoch, updater)
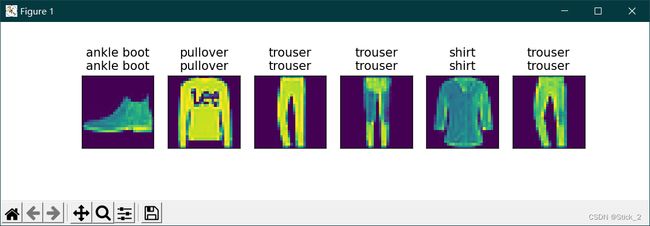
def predict_ch3(net, test_iter, n=6):
"""预测标签"""
for X, y in test_iter:
break
trues = d2l.get_fashion_mnist_labels(y)
preds = d2l.get_fashion_mnist_labels(net(X).argmax(axis=1))
titles = [true + '\n' +pred for true, pred in zip(trues, preds)]
d2l.show_images(X[0:n].reshape((n, 28, 28)), 1, n, titles=titles[0:n])
d2l.plt.show()
predict_ch3(net, test_iter)
三、运行结果如下
1.下图是训练效果图,迭代次数epoch=10,loss损失不断减少,最终测试精度在80%以上,没有用卷积还算可以了,。

2.测试结果,上面是真实类别,下面是预测类别。