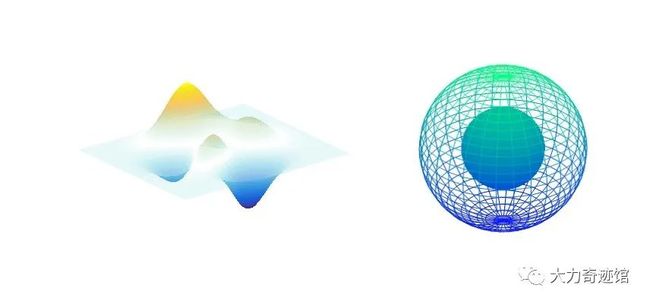
一、以plot为例 Matlab中最常用的 绘图指令当属
plot,此外很多绘图函数与plot用法相似,因此,首先详细介绍plot的使用方法。 绘制图形通常通过以下步骤来完成:准备数据—选定位置—调用指令—设置坐标—图形注释—图形修饰。
1.1 准备数据。 (1)Excel类文件。 文件路径: 文件位置及名称用字符串表述,字符串即单引号内的内容,其连接可采用矩阵行连接。例如在 D 盘 DataProcess 文件夹内 DATA 文件夹内的 MyData.xlsx 文件,其路径可以表述为 'D:\DataProcess\DATA\MyData.xlsx' 或 [DataAdress,’\’,M_File_Name] DataAdress=’D:\DataProcess\DATA’ M_File_Name=’ MyData.xlsx’ 。 文件夹 / 文件操作:
| exist(’string’) |
文件夹存在返回7 |
| mkdir(’string’) |
新建文件夹 |
| rmdir(’string’,’s’) |
删除文件夹及其下文件 |
| ls(’string’) |
获取文件夹下的文件名称 |
| copyfile(’source’,’destination’) |
复制文件夹/文件 |
| movefile(’source’,’destination’) |
移动文件夹/文件 |
Excel 文件操作:
| Xlswrite |
将矩阵变量数据写入Excel |
|
xlswrite(filename,A)xlswrite(filename,A,sheet)xlswrite(filename,A,xlRange)xlswrite(filename,A,sheet,xlRange) |
| Xlsread |
将Excel中的数据读入矩阵变量 |
|
num = xlsread(filename)num = xlsread(filename, sheet)num = xlsread(filename,xlRange)num= xlsread(filename,sheet,xlRange) |
| 说明 |
sheet:字符串或正整数xlRang:字符串,例如‘A1:D3’A:矩阵,字符类型需用引号 |
(2)机器码。 设备采集到的数据有很多种读入方式,在此仅介绍一种比较通用的方式。 fileID =fopen( ’ 文件路径 ’ , ’r’);A =fread(fileID,sizeA,precision,machinefmt); sizeA : inf ,n, [m,n] machinefmt:高低位描述,n、b、l、s、a。 precision :类型
| unit/ unit8/ unit16/ unit32/ unit64 |
32/8/16/32/64bit(8bit=1Byte) |
| uchar/unsigned char |
8/8/16 |
| ushort/ulong/ubitn |
16/32/[1~64] |
| int/int8/int16/int32/int64 |
32/8/16/32/64bit |
| integer*1/2/4/8 |
8/16/32/64 |
| schar/signed char/short/long/bitn |
8/8/16/32/[1~64] |
| single/double/float/ float32/ float64 |
32/64/32/32/64 |
| real*4/8 |
32/64 |
| char*1/char |
8/与编码相关 |
1.2 选定位置
| figure |
创建图形窗口 |
|
figure/figure('PropertyName',propertyvalue,...)figure(h)/ h = figure(...) |
|
PropertyName |
Color |
|
|
Name |
|
|
NumberTitle:off/ on(默认) |
|
|
Position:[left bottom width height] |
| subplot |
设置子图位置 |
|
subplot(m,n,p) m行n列子图,位于位置psubplot('Position',positionVector)subplot(m,n,p,ax)/subplot(h)subplot(…,Name,Value)/h = subplot(…) |
示例语句: 【 scrsz = get(groot,'ScreenSize'); 获取屏幕大小,从而确定图形在屏幕中的位置】 【ax1 = subplot(2,1,1); plot(ax1,Z(1:20,:)); ax1.XTick=[0,10,25,40,50]; title/ylabel/xlabel(ax1,'srting');】
1.3 调用指令 (1)基本形式。 plot(x1,y1, 'sss1'…),其中(x,y, 'sss')是最 基本的平面绘线三元组, plot 可接受多个三元组; x 、 y 规模相同,分别为横坐标和相对应的纵坐标;如果二者均为 1 维数组,则绘制 1 条线;如果二者均为 m*n 的数组,则绘制 n 条曲线; x 可为空,此时横坐标为数组序号; 'sss1' 它是离散点形、连续线形、色彩三种属性的组合,字符串类型,可为空。 离散点形 - 属性 Marker :
| 'o' |
圆圈 |
| 'd''diamond' |
菱形 |
| 's''square' |
方形 |
| '*' |
星号 |
| '.' |
实心点 |
| '+' |
|
| 'x' |
|
| 'v'、'^'、'>'、' |
不同朝向三角形 |
| 'p','pentagram' |
五角星 |
| 'h','hexagram' |
六角星 |
其中, Marker 的属性:
| ‘MarkerSize’ |
设置数据点大小 |
| 'MarkerFaceColor' |
离散点填充色 |
| 'MarkerEdgeColor' |
离散边缘色 |
连续线形 - 属性 LineStyle :
| '-' |
实线 |
| '--' |
虚线 |
| ':' |
点虚线 |
| '-.' |
|
| 'none' |
|
色彩 - 属性 Color :
| 'g' |
[0 1 0] |
绿色 |
| 'b' |
[0 0 1] |
蓝色 |
| 'r' |
[1 0 0] |
红色 |
| 'y' |
[1 1 0] |
黄色 |
| 'm' |
[1 0 1] |
紫色 |
| 'c' |
[0 1 1] |
青色 |
| 'w' |
[1 1 1] |
白 |
| 'k' |
[0 0 0] |
黑 |
|
[num1,num2,num3] |
均不小于0不大于1 |
Matlab 用色次序可用 get(gca,’ColorOder’) 查询次序。
(2)带属性调用。 plot(x,y,’sss’,’PropertyName’,PropertyValue…)
| 'Color' |
设置线条颜色 |
| 'LineStyle' |
设置线条类型 |
| 'LineWidth' |
设置线条宽度 |
| 'Marker'及其属性 |
离散点标记类型 |
(3)重写函数。 有些方便修改的 Matlab 自带 M 文件,可根据绘图需要重写。比如 polar 等,位于 Install\toolbox\matlab\graph2d 中。重写调用过程中注意保护原始文件。
(4)属性设置命令。 【 p = plot(1:10,'ro-');props ={'LineWidth','Marker','MarkerSize'}; get(p,props)/ get(p);set(p,'Color','red')】
1.4 设置坐标
(1)axis坐标轴
| axis auto |
默认设置 |
| axis equal |
横、纵坐标轴采用等长刻度 |
| axis image |
横、纵坐标轴采用等长刻度且坐标范围严格与图线范围相同 |
| axis manual |
保持当前坐标不变 |
| axis off/on |
不显示/显示坐标轴 |
| axis tight |
坐标范围严格与图线范围相同 |
| axis([…])[xmin,xmax,ymin,ymax,zmin,zmax] |
可用inf\inf表示设置值为空,z项可缺 |
| axis ij/xy |
原点在左上/左下(默认) |
| axis normal/square |
矩形(默认)/正方形坐标系 |
| axis vis3d |
三维旋转时保持高宽比不变 |
| axes('Position',[位置,4个数]) |
|
| daspect([nx ny nz]) |
Nx个单位X轴=ny个单位Y轴长度… |
(2)gca当前图的坐标。set(gca, ’属性’,属性值)
| ‘FontSize’,num |
坐标轴上字体大小 |
| 'TickDir','out' |
默认是坐标刻度朝内,设置后朝外 |
| 'TickLength',[ num1, num2] |
num1为x轴刻度长度,同理 |
| 'Ylim',[ num1, num2] |
设置Y轴起止点,同理 |
| 'XTick',[刻度数值] |
|
| 'XTickLabels',{'', '', ''……} |
刻度文本 |
| ‘XTickLabelRotation’,num |
刻度文本旋转角度 |
例句: 【ax =gca; ax.Color= 'blue'; fig =gcf; ax = fig.CurrentAxes;】
(3)分格线
| grid on |
画分格线,默认为off |
| box on/off |
当前坐标呈封闭、开放(默认)模式 |
1.5 图形注释
(1)图形说明指令
| xlabel('string') |
x坐标轴说明,同理y、z等 |
| clabel(C,h,v) |
其中,[C,h] = contour(x,y,z);v是标记序列值,可省略。 |
| title('string') |
图标题子图标题ax1 = subplot(1,2,1);title(ax1,'string'); |
| text(x,y, 'string') |
在坐标x、y处显示文本 |
| legend('string',…,'Location', 'String') |
依照绘制顺序添加图例 |
|
North\South\East\West\NorthEast\NorthWest\SouthEast\SouthWest上北下南左西右东上述关键词+Outside,表示位于坐标轴外侧。Best表示自动确定与图形冲突最少的位置。 |
|
Color/TextColor/EdgeColorBox/LineWidth… |
(2)图形标识
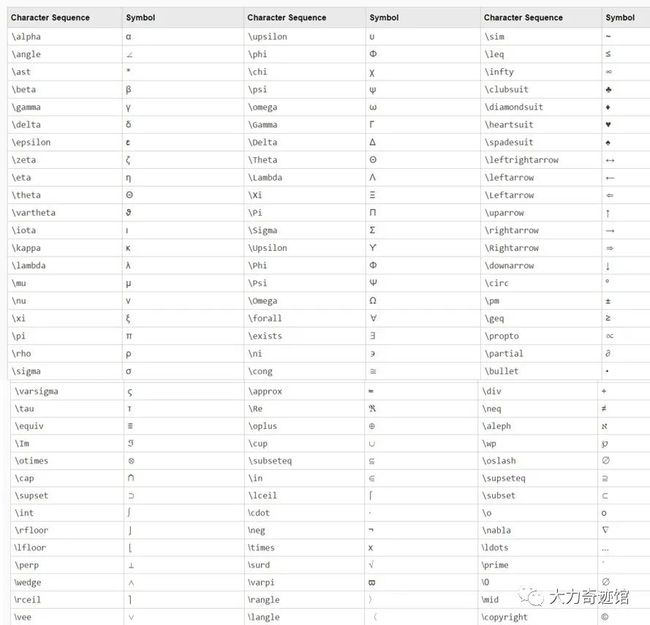
 (3)字体。
 \fontname{Windows中的字体名称};\bf 黑体, \it 斜体 1 , \sl 斜体 2 , \rm 正体; \fontsize{ 数字 } ,默认值为 10 , 1Point (磅) =0.35mm ; \color{specifier} 或 \color[rgb]{specifier} ,设置文本颜色。
(4)辅助线。 line: line(X,Y,Z,'PropertyName',propertyvalue,...) 例句:【t =0:pi/20:2*pi;hline1 = plot(t,sin(t),'k');ax = gca; hline2 = line(t+.06,sin(t),'LineWidth',4, 'Color',[.8 .8 .8], 'Parent',ax); set(gca,'Children',[hline1hline2])】
rectangle:rectangle('Position',[起点x,起点y,宽,高],'Curvature',[圆角数值1,圆角数值2],Name,Value)
annotation:annotation(lineType, [x_begin x_end], [y_begin y_end](相对 值 ),Name,Value)
| lineType |
h=annotation('line',[.1 .2],[.1 .2]); h.Color= 'red'; |
|
annotation('arrow',[.1 .2],[.1 .2]) |
|
annotation('doublearrow',[.1 .2],[.1 .2]) |
|
annotation('textarrow',[.1 .2],[.1 .2],'String','my text') |
|
annotation('rectangle',[.1 .5 .2 .1],'FaceColor','b','FaceAlpha',.2) |
|
annotation('ellipse',[.2 .3 .4 .5]) |
|
annotation('textbox',[.2 .3 .4 .5],'String','mytext','FitBoxToText','on') |
1.6 叠绘
(1)plot(x1,y1,’ss1’,x2,y2,’sss2’…) (2)使用hold on指令 ,多次绘图均存在。 (3)创建两个y轴:
plotyy: [ax,h1,h2]=plotyy(x1,x2,y1,y2,fun1,fun2); fun 是图形类型,例如 plot 、 stem 等,字符串,可缺; 设置 坐标轴属性举例: 【ylabel(ax(1),'String'),grid(ax(1),'on')】 设置线条属性举例: 【h1.LineStyle = '--'】 绘制大于两条曲线举例: 【plotyy(x,y1,[x',x'],[y2',y3']); 相同坐标轴放入一个矩阵。】
(4)创建2个x轴: line(x1,y1,'Color','r')
ax1= gca; ax1.XColor = 'r';
ax1.YColor = 'r';ax1_pos = ax1.Position;
ax2=axes('Position',ax1_pos,'XAxisLocation','top','YAxisLocation','right','Color','none');
line(x2,y2,'Parent',ax2,'Color','k')
二、以surf为例
2.1 绘图指令surf(X,Y,Z,C)或mesh(x,y,z,C)
其中x,y为坐标数组,z为函数值数组。若x,y为一维数组,可借助[X,Y]=meshgrid(x,y)生成矩形格点坐标数组,C为指定用色,可缺。类似地,surfc在surf基础上绘制等高线。
2.2 属性与说明
colormap(CM)色图取值如下:
| autumn |
hsv |
white |
| bone |
jet |
winter |
| colorcube |
lines |
hot |
| cool |
pink |
summer |
| copper |
prism |
gray |
| flag |
spring |
|
例如: 【ax1 = subplot(2,1,1);contourf(peaks); colormap(ax1,hot(10))】 【 surf(peaks(30));[cmin,cmax]= caxis;caxis([0,cmax])】
shading options 浓淡处理,用于 mesh 、 surf 、 pcolor 、 fill 、 fill3 等所创建的图形非数据点处着色。
| Flat |
每个贴片一个颜色 |
| Interp |
插值用色,无线 |
| Faceted |
默认,在flat基础上有网格线 |
view([])控制视角。[az,el]单位为°,分为方位角和俯仰角;[vx,vy,vz]直角坐标系确定的角度。
rotate(h,[],alpha,orgin)旋转变换图像。h被旋转的对象;[]旋转轴方向,同view参数;alpha旋转角度;orgin旋转支点,默认为原点。类似地,还有 rotate3d 。
colorbar('Position','Direction','reverse'),属性值均可缺。 举例如下: 【colorbar('Ticks',[-5,-2,1,4,7],'TickLabels',{'Cold','Cool','Neutral','Warm','Hot'})】 【 c =colorbar;c.Label.String = 'Elevation (ft in 1000s)';】 【 改变宽度: c = colorbar; cpos = c.Position; cpos(3) =0.5*cpos(3); c.Position = cpos; 同时需调整位置: ax = gca;axpos = ax.Position;ax.Position =axpos;】
光照light:
| camlight |
camlight ('headlight')
camlight('right')默认
camlight('left')
camlight(az,el)
camlight(...,'style'),local (default)或infinite
camlight(light_handle,...)
light_handle = camlight(...)camorbit(dtheta,dphi,'coordsys','direction') |
| light |
light('PropertyName',propertyvalue,...)
handle = light(...) |
| lightangle |
lightangle(az,el)
light_handle = lightangle(az,el)
lightangle(light_handle,az,el)
[az,el] = lightangle(light_handle) |
| lighting |
lighting flat 光线均匀,是默认值
lighting gouraud 用于曲面表现phong 表现最好 none 关闭所有光源 |
| brighten |
增加曲面亮度 |
材质material:
| material op |
shinny明亮dull 暗淡metal 金属关泽 |
| material([ka,kd,ks,n,sc]) |
均匀、漫反射、反射、镜面反射系数 |
透明处理: 对 surf 、 patch 、 image 的属性,相关指令常见操作如下。与之相类似的还有消隐
hidden off/on ,它仅用于 mesh 图形,形成透视效果。此外,强制为 NaN ,则图形呈现镂空;强制为 0 ,则图形呈现切面。
| alpha() |
[0,1]范围内数量,0为全透明 |
|
‘x’,’y’,’z’透明度随轴向数值变化 |
|
‘color’按色彩方式处理透明度 |
|
‘rand’随机决定各点透明度 |
|
‘flat’,’interp’,’texture’表示透明度处理方式注意该处理方式需与shading对应 |
| alim() |
[amin,amax]设定透明轴的上下限小于下限全透明,大于上限全不透明 |
| alpamap |
‘rampup’上斜线型 |
|
‘rampdown’下斜线型 |
|
‘vup’倒V字型 |
|
‘vdown’V字型 |
|
1*m矩阵自定义 |
三、绘图指令
3.1 线系列
| plot |
以下函数属性用法基本参照此函数 |
| plotyy |
|
| plot3 |
plot3(X1,Y1,Z1,...) |
| loglog |
横纵坐标轴均表示为指数形式 |
| semilogx |
横坐标轴表示为指数形式 |
| semilogy |
纵坐标轴表示为指数形式 |
|
|
| fplot |
fplot(fun,自变量范围,误差,属性) |
| ezplot |
ezplot(fun2(x,y),[xmin,xmax,ymin,ymax])ezplot(funx(t),funy(t),[tmin,tmax]) |
| ezplot3 |
ezplot3(funx,funy,funz,[tmin,tmax])
|
| errorbar |
errorbar(X,Y,E),以2E为区间
errorbar(X,Y,L,U),以L+U为区间 |
示例: 【 sn = @(x)sin(1./x);fplot(sn,[0.01,0.1]);】 【myfun.m 文件中 function Y =myfun(x); Y(:,1) =200*sin(x(:))./x(:);Y(:,2) = x(:).^2; 主函数中 fh = @myfun; fplot(fh,[-20 20]) ;】 【fh1 = @(s) s./2; fh2 = @(s) 2.*s; fh3 = @(s)s.^2; ezplot3(fh1,fh2,fh3)】 【ezplot3('s/2','2*s','s^2')】
3.2 点系列
| stem/stem3 |
stem(X,Y,…) |
| stairs |
|
| scatter/scatter3 |
|
例句: 【 stem(X,Y,'filled')】 【 x = linspace(0,3*pi,200); y = cos(x)+ rand(1,200); c = linspace(1,10,length(x)); scatter(x,y,[],c,'filled')】
3.3 Bar系列
| bar |
bar(x,y,Name,Value)y多行时形成不同系列 |
| bar3 |
三维 |
| barh |
水平 |
| bar3h |
水平三维 |
| histogram |
绘制某数据集合X的区间分布histogram(X,nbins) nbin划分多少区间histogram(X,edges)包含区间端点histogram(C,Categories) Categories可缺 |
| histogram2 |
histogram2(X,Y,Xedges,Yedges) |
| pareto |
pareto(Y,names)
绘制Y的条形图和小于Y的占比线
|
| ribbon |
彩带条
|
(1)bar属性
| BarWidth |
0与1之间 |
| 'FaceColor' |
填充颜色 |
| 'FaceAlpha' |
填充透明度 |
| 'EdgeColor' |
边框颜色,No为无边框 |
| 'EdgeAlpha' |
边框透明度 |
| 'LineWidth' |
边框宽度 |
| 'LineStyle ' |
|
| style |
'grouped'每行为一组柱子'stacked'每行绘制成1根柱子'histc'每组柱子之间不留缝隙'hist'效果类似于'histc',但柱子中心点不同 |
| colorbar |
|
| colormap |
|
| 'Baseline' |
b(i). Baseline. LineStyleb(i). Baseline. Colorb(i).BaseLine.LineWidthb(i).BaseLine. BaseValue可设置基线数值numb(i).BaseLine. Visible on/off |
例句: 【 y = [24 6; 3 4 5];b = bar(y);b(2).LineWidth = 2;】 【 通过柱子宽度不同可以组合绘制成温度计】 【 可以组合绘制图线和柱子等: [ax,b,p]= plotyy(x1,y1,x2,y2,'bar','plot')】 【 三维视图单根柱子颜色过渡改变: b=bar3(…); for k =1:length(b) data = b(k).ZData; b(k).CData = zdata; b(k).FaceColor = 'interp' end】
(2)histogram属性
h = histogram(x),h中包含属性
| Values |
数值 |
| NumBins |
区间数目 |
| BinEdges |
区间边缘 |
| BinWidth |
区间宽度 |
| BinLimits |
区间限制 |
Normalization
|
'count'数目
'countdensity'区间宽度乘以高度=数目
'probability'数目/总数目
'pdf'数目/(总数目*区间宽度)
'cumcount'小于区间的数目
'cdf'小于区间的概率
|
例句: 【 edges = [-10 -0:0.25:0.5 10]; h =histogram(x,edges);】 【A = [00 1 1 1 0 0 0 0 NaN NaN 1 0 0 0 1 0 1 0 1 0 0 0 1 1 1 1]; C =categorical(A,[1 0 NaN],{'yes','no','undecided'}); h =histogram(C,'BarWidth',0.5) ;】 【 h =histogram2(randn(1000,1),randn(1000,1),[12 12],'FaceColor','flat');】【histogram2(randn(1000,1),randn(1000,1),'DisplayStyle','tile','ShowEmptyBins','on');】 【codelines= [200 120 555 608 1024 101 57 687]; coders= {'Fred','Ginger','Norman','Max','Julia','Wally','Heidi','Pat'}; pareto(codelines,coders)】
3.4 Polar系列
| rose |
原理类似于histogram |
| polar |
polar(theta,rho,…) |
| compass |
compass(U,V…) / compass(Z…) |
| ezpolar |
|
3.5 Area系列
| area |
如果Y为多行,则1列为一条线,线下填充颜色;第二条线在第一条基础上变化。 |
| pie/ pie3 |
pie(X,explode,labels) X之和小于1,X值代表比例,否则按实际比例排列explode为[]饼块之间的间距,默认为0labels{‘’ ‘’…}默认显示百分比 |
| fill/fill3 |
|
| patch/surf2patch |
patch(X,Y,Z,C) |
| pcolor |
pcolor(x,y,z)伪彩图,x,y为坐标,z为颜色。 |
| imshow/image/imagesc |
|
例句: 【 x2 = [25; 2 5; 8 8];y2 = [4 0; 8 2; 4 0];patch(x2,y2,'green')】 【 或 c = [0;1];patch(x,y,c)colorbar 或c = [03; 6 4; 4 6];patch(x,y,c) ;colorbar】 【x = linspace(1,10,15);y= sin(x);y(end) = NaN;c = y; patch(x,y,c,'EdgeColor','interp','Marker','o','MarkerFaceColor','flat');colorbar;】
3.6 等高系列
| contour |
contour(X,Y,Z,v) v为level list |
| contourf |
在以上基础上填充颜色 |
| ezcontour |
|
| ezcontourf |
|
| contourslice |
contourslice(X,Y,Z,V,Sx,Sy,Sz,cvals) |
例句: 【 contour(X,Y,Z,'ShowText','on')】 【[C,h] = contour(x,y,z); clabel(C,h, 'FontWeight','bold','Color','blue')】
3.7 向量系列
| feather |
feather(U,V,…)/feather(Z,…) |
| quiver/quiver3 |
quiver(X,Y, U,V,…) |
| streamslice |
|
| streamline |
|
3.8 三维系列
| surf/surfl/surfc/ezsurf/ezsurfc |
|
| warp |
warp(x,y,z,A), A= imread(‘图像’) |
| mesh/meshc/meshz/ezmesh/ezmeshc |
与surf相比它像是镂空的 |
| waterfall/peaks/cylinder/ellipsoid/sphere |
|
3.9 动态系列
| drawnow |
drawnowdrawnow limitrate绘制速度更快 |
| spinmap(s,n) |
色彩变幻 |
| campos([camera_position]) |
配合drawnow制作改变观测视角效果 |
| pause(s) |
hold off新绘制图形覆盖旧图形结合pause函数可实现动态图形效果 |
| [x,y]=ginput(n) |
在已有的图形上选n点连线 |
|
F(i)=getframe/getframe(ax)/getframe(ax) |
| movie(fig,F,n) |
回放n遍 |
例句: 【 h =animatedline;axis([0 4*pi -1 1]); x = linspace(0,4*pi,10000);y = sin(x); for k =1:length(x) addpoints(h,x(k),y(k)); drawnow end】 最后,很多绘图属性均可在绘图面板的各类选项中设计,其中还有标记、读数据、放大等功能,部分功能需要配合Ctrl、Shift等功能键使用。 参考文献:精通MATLAB,百度,Matlab帮助,更多信息敬请查询Matlab帮助。 欢迎关注公众号“大力奇迹馆”
 (3)字体。 \fontname{Windows中的字体名称};\bf 黑体, \it 斜体 1 , \sl 斜体 2 , \rm 正体; \fontsize{ 数字 } ,默认值为 10 , 1Point (磅) =0.35mm ; \color{specifier} 或 \color[rgb]{specifier} ,设置文本颜色。 (4)辅助线。 line: line(X,Y,Z,'PropertyName',propertyvalue,...) 例句:【t =0:pi/20:2*pi;hline1 = plot(t,sin(t),'k');ax = gca; hline2 = line(t+.06,sin(t),'LineWidth',4, 'Color',[.8 .8 .8], 'Parent',ax); set(gca,'Children',[hline1hline2])】 rectangle:rectangle('Position',[起点x,起点y,宽,高],'Curvature',[圆角数值1,圆角数值2],Name,Value) annotation:annotation(lineType, [x_begin x_end], [y_begin y_end](相对 值 ),Name,Value)
 (3)字体。 \fontname{Windows中的字体名称};\bf 黑体, \it 斜体 1 , \sl 斜体 2 , \rm 正体; \fontsize{ 数字 } ,默认值为 10 , 1Point (磅) =0.35mm ; \color{specifier} 或 \color[rgb]{specifier} ,设置文本颜色。 (4)辅助线。 line: line(X,Y,Z,'PropertyName',propertyvalue,...) 例句:【t =0:pi/20:2*pi;hline1 = plot(t,sin(t),'k');ax = gca; hline2 = line(t+.06,sin(t),'LineWidth',4, 'Color',[.8 .8 .8], 'Parent',ax); set(gca,'Children',[hline1hline2])】 rectangle:rectangle('Position',[起点x,起点y,宽,高],'Curvature',[圆角数值1,圆角数值2],Name,Value) annotation:annotation(lineType, [x_begin x_end], [y_begin y_end](相对 值 ),Name,Value)
