python使用show_heatmaps函数 不报错,也不显示图像的解决方式
源代码:
import torch
from d2l import torch as d2l
# 以后调用该函数来显示att权重
def show_heatmaps(matrices, xlabel, ylabel, titles=None, figsize=(2.5, 2.5),
                 cmap='Reds'):
    """显示矩阵热图"""
    d2l.use_svg_display()
    num_rows, num_cols = matrices.shape[0], matrices.shape[1] # 获取矩阵的行和列
    fig, axes = d2l.plt.subplots(num_rows, num_cols, figsize=figsize,
                                sharex=True, sharey=True, squeeze=False)
#     print(fig, axes)
    for i, (row_axes, row_matrices) in enumerate(zip(axes, matrices)):
        for j, (ax, matrix) in enumerate(zip(row_axes, row_matrices)):
            pcm = ax.imshow(matrix.detach().numpy(), cmap=cmap)
            if i == num_rows - 1:
                ax.set_xlabel(xlabel)
            if j == 0:
                ax.set_ylabel(ylabel)
            if titles:
                ax.set_title(titles[j])
    fig.colorbar(pcm, ax=axes, shrink=0.6)
attention_weights = torch.eye(10).reshape((1, 1, 10, 10))
show_heatmaps(attention_weights, xlabel='Keys', ylabel='Queries')
运行后: 不显示错误,也不显示图像
C:\Users\wangxiaoying\.conda\envs\d2l-zh\python.exe C:/Users/wangxiaoying/AppData/Roaming/JetBrains/PyCharmCE2021.3/scratches/attention.py
进程已结束,退出代码0
在最后一行加入 plt.show(),
plt.show()并且在代码首行导入matplotlib和pyplot即可
from matplotlib import pyplot as plt修改后的完整代码:
import torch
from d2l import torch as d2l
from matplotlib import pyplot as plt
# 以后调用该函数来显示att权重
def show_heatmaps(matrices, xlabel, ylabel, titles=None, figsize=(2.5, 2.5),
cmap='Reds'):
"""显示矩阵热图""
d2l.use_svg_display()
num_rows, num_cols = matrices.shape[0], matrices.shape[1]
fig, axes = d2l.plt.subplots(num_rows, num_cols, figsize=figsize,
sharex=True, sharey=True, squeeze=False)
for i, (row_axes, row_matrices) in enumerate(zip(axes, matrices)):
for j, (ax, matrix) in enumerate(zip(row_axes, row_matrices)):
pcm = ax.imshow(matrix.detach().numpy(), cmap=cmap)
if i == num_rows - 1:
ax.set_xlabel(xlabel)
if j == 0:
ax.set_ylabel(ylabel)
if titles:
ax.set_title(titles[j])
fig.colorbar(pcm, ax=axes, shrink=0.6);
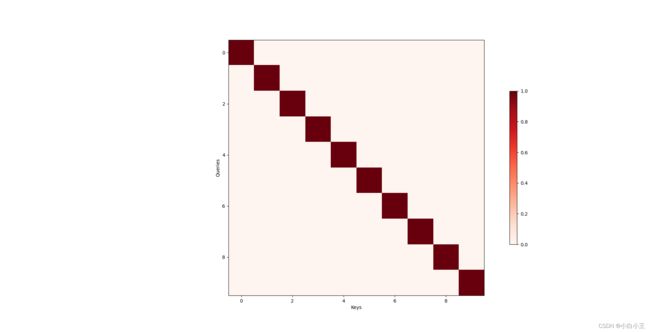
attention_weights = torch.eye(10).reshape((1, 1, 10, 10))
show_heatmaps(attention_weights, xlabel='Keys', ylabel='Queries')
plt.show()运行后:成功显示图像