分类——逻辑回归Python实现
目录
一、确认训练数据
二、逻辑回归实现
三、验证
四、线性不可分分类的实现
五、随机梯度下降算法的实现
一、确认训练数据
import numpy as np
import matplotlib.pyplot as plt
#读入训练数据
train = np.loadtxt('D:/深度之眼/study/sourcecode-cn/sourcecode-cn/images2.csv', delimiter=',', skiprows=1)
train
打印结果
二、逻辑回归实现
train_x = train[:,0:2]
train_y = train[:,2]
#初始化参数
theta = np.random.rand(3)
#标准化
mu = train_x.mean(axis = 0)
sigma = train_x.std(axis = 0)
def standardize(x):
    return (x - mu)/ sigma
train_z = standardize(train_x)
#增加x0
def to_matrix(x):
    x0 = np.ones([x.shape[0], 1])
    return np.hstack([x0, x])
X = to_matrix(train_z)
#将标准化后的训练数据画成图
plt.plot(train_z[train_y == 1, 0], train_z[train_y == 1, 1], 'o')
plt.plot(train_z[train_y == 0, 0], train_z[train_y == 0, 1], 'x')
plt.show()
预测函数
#sigmod函数
def f(x):
    return 1 / (1 + np.exp(-np.dot(x, theta)))
到此事前准备就结束了,接下来是参数更新部分的实现。学习逻辑回归的时候,我们进行了定义逻辑回归的似然函数,对对数似然函数进行微分等一系列操作,然后最终得到的参数更新表达式是这样的。
与回归时一样,将![]() 当作向量来处理,将它与训练数据的矩阵相乘就行了,我们把重复次数设置得稍微多一点,比如5000 次左右。在实际问题中需要通过反复尝试来设置这个值,即通过确认学习中的精度来确定重复多少次才足够好。
当作向量来处理,将它与训练数据的矩阵相乘就行了,我们把重复次数设置得稍微多一点,比如5000 次左右。在实际问题中需要通过反复尝试来设置这个值,即通过确认学习中的精度来确定重复多少次才足够好。
#学习率
ETA = 1e-3
#重复次数
epoch = 5000
#重复学习
for _ in range(epoch):
theta = theta -ETA * np.dot(f(X) - train_y, X)那我们用图来确认一下结果吧。之前说过在逻辑回归中,![]() 这条直线是决策边界。 也就是说,
这条直线是决策边界。 也就是说,![]() 时图像是横向的,
时图像是横向的,![]() 时图像是纵向的。将
时图像是纵向的。将![]() 变形并加以整理,得到这样的表达式。我们把它用图来展示一下看看。
变形并加以整理,得到这样的表达式。我们把它用图来展示一下看看。
![]()
x0 = np.linspace(-2, 2, 100)
plt.plot(train_z[train_y == 1, 0], train_z[train_y == 1, 1], 'o')
plt.plot(train_z[train_y == 0, 0], train_z[train_y == 0, 1], 'x')
plt.plot(x0, -(theta[0] + theta[1] * x0) / theta[2], linestyle = 'dashed')
plt.show()
上图可发现通过逻辑回归也能很好地分类了
三、验证
接下来我们尝试对任意图像进行分类。不要忘了对预测数据进行标准化哦。
f(to_matrix(standardize([[200, 100],[100, 200]])))输出结果:array([0.91677595, 0.0297916 ])
所以前面200 × 100 的图像对应的值0.917 403 19 意味着图像是横向的概率为91.7%,而100 × 200 的图像对应的值0.029 557 52 意味着图像是纵向的概率为2.9%。
直接看概率可能不够直观,我们可以确定一个阈值,然后定义一个根据阈值返回1 或0 的函数。
def classify(x):
    return (f(x) >= 0.5).astype(np.int)
classify(to_matrix(standardize([[200, 100], [100, 200]])))
输出结果:array([1, 0])
200×100 被分类为横向,而100×200 被分类为纵向了。
以上代码汇总
import numpy as np
import matplotlib.pyplot as plt
#读入训练数据
train = np.loadtxt('D:/深度之眼/study/sourcecode-cn/sourcecode-cn/images2.csv', delimiter=',', skiprows=1)
train_x = train[:,0:2]
train_y = train[:,2]
#初始化参数
theta = np.random.rand(3)
#标准化
mu = train_x.mean(axis = 0)
sigma = train_x.std(axis = 0)
def standardize(x):
    return (x - mu)/ sigma
train_z = standardize(train_x)
#增加x0
def to_matrix(x):
    x0 = np.ones([x.shape[0], 1])
    return np.hstack([x0, x])
X = to_matrix(train_z)
#sigmod函数
def f(x):
    return 1 / (1 + np.exp(-np.dot(x, theta)))
#分类函数
def classify(x):
    return (f(x) >= 0.5).astype(np.int)
#学习率
ETA = 1e-3
#重复次数
count = 0
for _ in range(epoch):
    theta = theta - ETA * np.dot(f(X) - train_y, X)
    # 日志输出
    count += 1
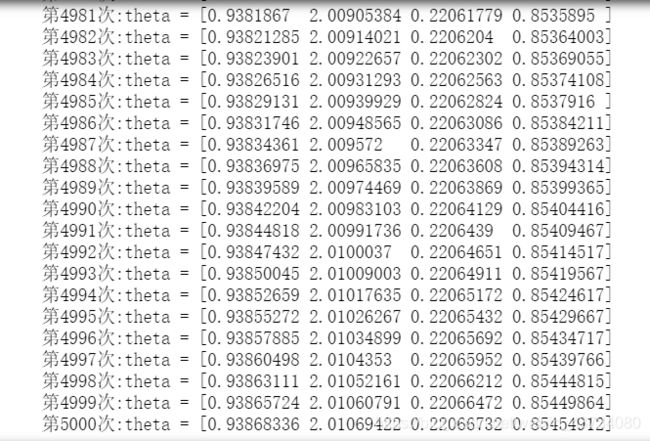
    print(' 第{} 次: theta = {}'.format(count, theta))

#绘图确认
x0 = np.linspace(-2, 2, 100)
plt.plot(train_z[train_y == 1, 0], train_z[train_y == 1, 1], 'o')
plt.plot(train_z[train_y == 0, 0], train_z[train_y == 0, 1], 'x')
plt.plot(x0, -(theta[0] + theta[1] * x0) / theta[2], linestyle='dashed')
plt.show()
训练结果
四、线性不可分分类的实现
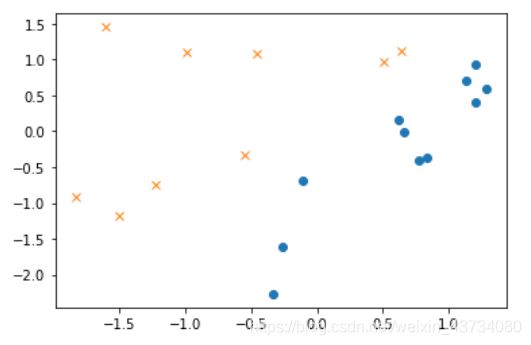
查看数据分布
import numpy as np
import matplotlib.pyplot as plt
#读入训练数据
train = np.loadtxt('D:/NoteBook/sourcecode-cn/data3.csv', delimiter=',', skiprows=1)
train_x = train[:,0:2]
train_y = train[:, 2]
plt.plot(train_x[train_y == 1, 0], train_x[train_y == 1, 1], 'o')
plt.plot(train_x[train_y == 0, 0], train_x[train_y == 0, 1], 'x')
plt.show()
在图像上显示分布情况
我们试着用二次函数,即在训练数据里加上![]() 尝试分类,也就是说要增加一个
尝试分类,也就是说要增加一个![]() 参数,参数总数达到四个。
参数,参数总数达到四个。
#参数初始化
theta = np.random.rand(4)
#标准化
mu = train_x.mean(axis = 0)
sigma = train_x.std(axis = 0)
def standardize(x):
    return (x - mu) / sigma
train_z = standardize(train_z)
#增加x0和x0
def to_matrix(x):
    x0 = np.ones([x.shape[0], 1])
    x3 = x[:,0,np.newaxis] ** 2
    return np.hstack([x0, x, x3])#增加一个维度为x平方
X = to_matrix(train_z)
sigmoid 函数和学习的部分与刚才完全一样就行,可以直接执行了。
#sigmod函数
def f(x):
    return 1 / (1 + np.exp(-np.dot(x, theta)))
#学习率
ETA = 1e-3
#重复次数
epoch = 5000
#重复学习
for _ in range(epoch):
    theta = theta - ETA * np.dot(f(X) - train_y, X)
#日志输出
    count += 1
print('第{}次:theta = {}'.format(count, theta))对于有四个参数的![]() 可以这样变形,然后按这个公式画图就行了。
可以这样变形,然后按这个公式画图就行了。
![]()
x1= np.linspace(-2, 2, 100)
x2 = -(theta[0] + theta[1] * x1 + theta[3] * x1 ** 2) / theta[2]
plt.plot(train_z[train_y == 1, 0], train_z[train_y == 1, 1], 'o')
plt.plot(train_z[train_y == 0, 0], train_z[train_y == 0, 1], 'x')
plt.plot(x1, x2, linestyle = 'dashed')
plt.show()
如上图,决策边界已经变成曲线了。和回归时一样,将重复次数作为横轴、精度作为纵轴来绘图,这次应该会看到精度上升的样子。
精度的计算公式如下:
我们来验证一下
#参数初始化
theta = np.random.rand(4)
#精度的历史记录
accuracies = []
#重复学习
for _ in range(epoch):
    theta = theta -ETA * np.dot(f(X) - train_y, X)
    #计算现在的精度
    result = classify(X) == train_y
    accuracy = len(result[result == True]) / len(result)
    accuracies.append(accuracy)
#将精度画成图
x = np.arange(len(accuracies))

plt.plot(x, accuracies)
plt.show()
如上图,随着次数的增加,精度的确变好了。这是训练数据只有20 个的缘故,精度值只能为0.05 的整数倍,所以这条线看起来有棱有角。而且从图中可以看出,在重复满5000 次之前,精度已经到1.0 了。刚才我是随口说了个5000 次,也可以像这样,每次学习后都计算精度,当精度达到满意的程度后就停止学习。
五、随机梯度下降算法的实现
我们再像回归时所做的那样,试试随机梯度下降法的实现,要做的也就是把学习部分稍稍修改一下。
#参数初始化
theta = np.random.rand(4)
#重复学习
for _ in range(epoch):
    p = np.random.permutation(X.shape[0])#numpy.random.permutation(length)用来产生一个随机序列作为索引,再使用这个序列从原来的数据集中按照新的随机顺序产生随机数据集。length 为训练数据的个数。
    for x, y in zip(X[p,:], train_y[p]):
        theta = theta - ETA * (f(x) - y) * x
x1= np.linspace(-2, 2, 100)#在闭区间[-2, 2]生成200个均匀间隔的数字
x2 = -(theta[0] + theta[1] * x1 + theta[3] * x1 ** 2) / theta[2]
plt.plot(train_z[train_y == 1, 0], train_z[train_y == 1, 1], 'o')
plt.plot(train_z[train_y == 0, 0], train_z[train_y == 0, 1], 'x')
plt.plot(x1, x2, linestyle = 'dashed')
plt.show()从上图可以发现,分类的效果很不错!


