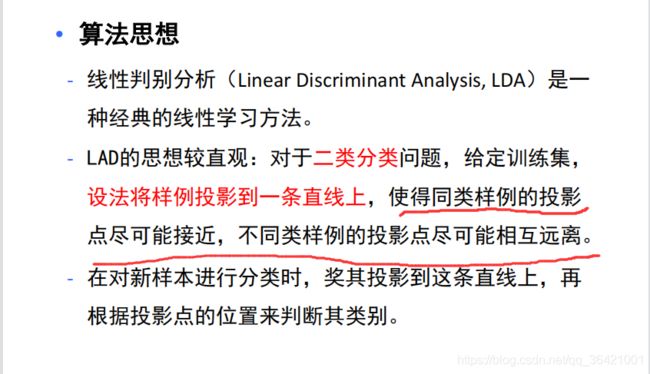
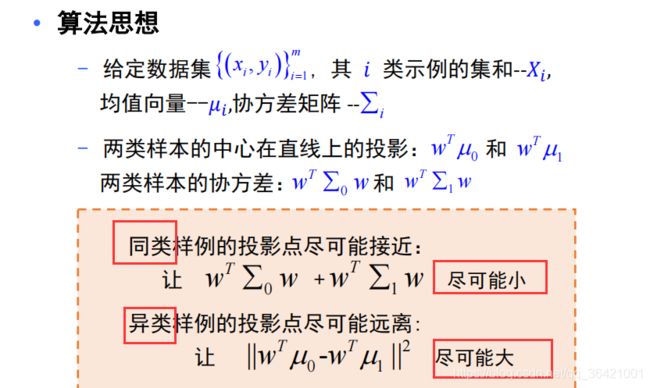
线性判别分析(LDA)推导及python实现
代码实现:
import numpy as np
import matplotlib.pyplot as plt
from mpl_toolkits.mplot3d import Axes3D

class LDA():
    def __init__(self):
        self.w=None

    def calculate_covariance_matrix(self,X,Y=None):
        #计算协方差矩阵
        m=X.shape[0]
        X=X-np.mean(X,axis=0)
        Y=X if Y==None else Y-np.mean(Y,axis=0)
        return 1/m*np.matmul(X.T,Y)
    #对数据进行向量转换
    def transform(self,x,y):
        self.fit(X,y)
        X_transform=X.dot(self.w)
        return X_transform
    #LDA拟合过程
    def fit(self,X,y):
        #按类划分
        X0=X[y.reshape(-1)==0]
        X1=X[y.reshape(-1)==1]
        #计算两类数据变量的协方差矩阵
        sigma0=self.calculate_covariance_matrix(X0)
        sigma1=self.calculate_covariance_matrix(X1)
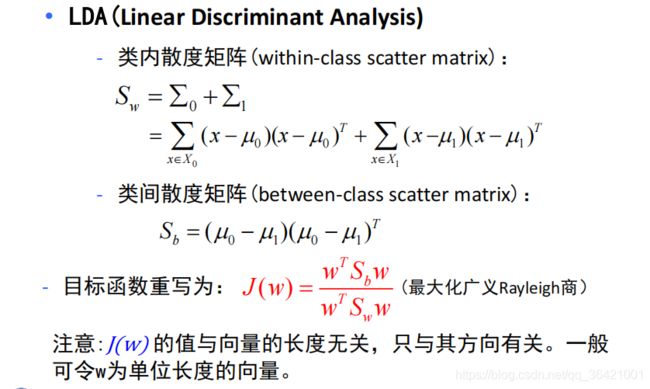
        #计算类内散度矩阵
        Sw=sigma0+sigma1
        #分别计算两类数据自变量的均值和方差
        u0,u1=X0.mean(0),X1.mean(0)
        mean_diff=np.atleast_1d(u0-u1)#atleast_1d将输入转换为至少一维的数组
        #对类内矩阵进行奇异值分解
        U,S,V=np.linalg.svd(Sw)
        #计算类内散度矩阵的逆
        Sw_=np.dot(np.dot(V.T,np.linalg.pinv(np.diag(S))),U.T)
        #计算w
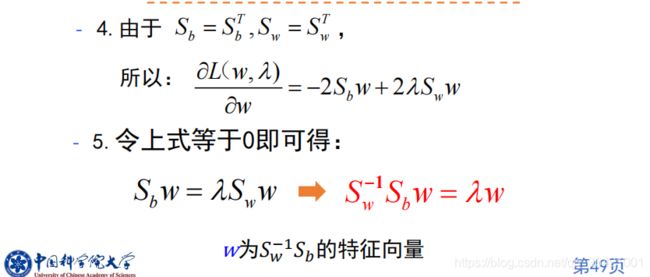
        self.w=Sw_.dot(mean_diff)
        return self.w
    #LDA分类预测:
    def predict(self,X):
        y_pred=[]
        for sample in X:
            h=sample.dot(self.w)
            y=1*(h<0)
            y_pred.append(y)
        return y_pred
    #训练集数据
    def get_train_data(self,data_size=100):
        data_label = np.zeros((2 * data_size, 1))
        # class 1
        x1 = np.reshape(np.random.normal(1, 0.6, data_size), (data_size, 1))
        y1 = np.reshape(np.random.normal(1, 0.8, data_size), (data_size, 1))
        data_train = np.concatenate((x1, y1), axis=1)
        data_label[0:data_size, :] = 0  # 0

        # class 2
        x2 = np.reshape(np.random.normal(-1, 0.3, data_size), (data_size, 1))
        y2 = np.reshape(np.random.normal(-1, 0.5, data_size), (data_size, 1))
        data_train = np.concatenate((data_train, np.concatenate((x2, y2), axis=1)), axis=0)
        data_label[data_size:2 * data_size, :] = 1
        return data_train, data_label

    def get_test_data(self,data_size=10):
        testdata_label = np.zeros((2 * data_size, 1))
        # class 1
        x1 = np.reshape(np.random.normal(1, 0.6, data_size), (data_size, 1))
        y1 = np.reshape(np.random.normal(1, 0.8, data_size), (data_size, 1))
        data_test = np.concatenate((x1, y1), axis=1)
        testdata_label[0:data_size, :] = 0

        # class 2
        x2 = np.reshape(np.random.normal(-1, 0.3, data_size), (data_size, 1))
        y2 = np.reshape(np.random.normal(-1, 0.5, data_size), (data_size, 1))
        data_test = np.concatenate((data_test, np.concatenate((x2, y2), axis=1)), axis=0)
        testdata_label[data_size:2 * data_size, :] = 1
        return data_test, testdata_label
    def plot_2d_desision(self):
        x = np.arange(-2, 2, 0.1)
        y = -w[0] * x / w[1]
        plt.figure()
        plt.scatter(train_data[:100, 0], train_data[:100, 1], c='g', marker='+', label='Category 0')
        plt.scatter(train_data[100:, 0], train_data[100:, 1], c='b', marker='o', label='Category 1')
        plt.scatter(test_data[:, 0], test_data[:, 1], c='r', marker='s', label='test data')
        plt.plot(x, y, 'r--', label='Decision Boundary')
        plt.legend()
    def plot_3d_decision(self):
        fig2 = plt.figure()
        ax2 = Axes3D(fig2)
        ax2.scatter(train_data[:100, 0], train_data[:100, 1], train_label[:100, 0], c='g', marker='+',
                    label='Category 0')
        ax2.scatter(train_data[100:, 0], train_data[100:, 1], train_label[100:, 0], c='b', marker='o',
                    label='Category 1')
        ax2.scatter(test_data[:, 0], test_data[:, 1], test_label, c='r', marker='s', label='test data')
        x1 = np.arange(-2, 2.1, 0.1)
        x2 = np.arange(-3, 3.1, 0.1)
        x1, x2 = np.meshgrid(x1, x2)
        Y = w[0] * x1 + w[1] * x2
        ax2.plot_surface(x1, x2, Y, rstride=1, cstride=1, cmap=plt.cm.coolwarm)
        plt.legend()

if __name__=="__main__":
    #1.产生数据
    lda=LDA()
    train_data,train_label=lda.get_train_data()
    test_data,test_label=lda.get_test_data()
    print('train_data=', train_data.shape)
    print('train_label=', train_label.shape)
    print('test_data=', test_data.shape)
    print('test_label=', test_label.shape)
    #2.用训练集训练LDA
    w=lda.fit(train_data,train_label)
    #3.测试集预测
    y_pred=lda.predict(test_data)
    print("分界面权向量w=",w)
    print("测试集预测值为:",y_pred)
    print("测试集预测精度为acc=",np.sum(y_pred==test_label.reshape(-1))/len(y_pred))
    #4,画二维图及决策面
    lda.plot_2d_desision()

    #5.三维图及决策面
    lda.plot_3d_decision()
    plt.show()
参考链接:https://mp.weixin.qq.com/s/PZpEtcdiPUxIv6M3sGOaGA


