【Python绘图】Python绘制roc和aupr曲线
目录
- 1 绘制AUC曲线(绘制多个曲线到同一张图中)
- 2 AUC曲线结果
- 3 绘制AUPR曲线
- 4 AUPR结果
- 5 参考文献
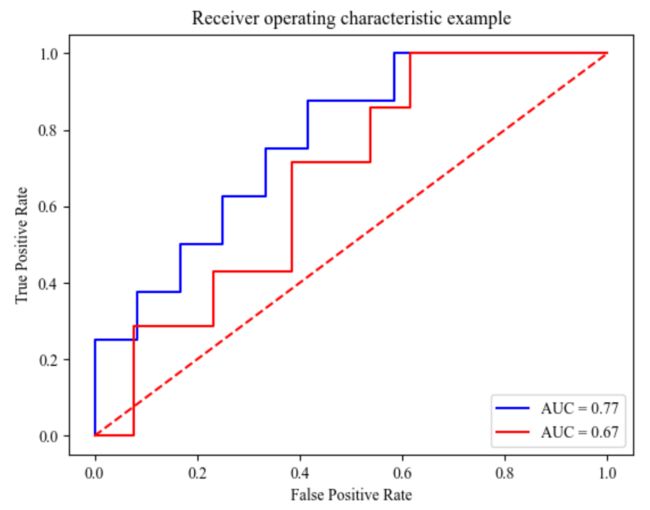
在进行模型方法性能对比的时候,往往需要将自己的方法和 b a s e l i n e m o d e l baseline~model baseline model的性能指标绘制绘制到同一个 F i g u r e Figure Figure进行对比,如Area Under the Receiver Operating Characteristic (AUROC)。具体的绘制方法如下(Python script, 以二分类为例):
1 绘制AUC曲线(绘制多个曲线到同一张图中)
from sklearn import metrics
import matplotlib.pylab as plt

plt.rc('font', family='Times New Roman')

y_true_1 = [1.0, 1.0, 0.0, 1.0, 0.0, 1.0, 0.0, 1.0, 0.0, 1.0,
            0.0, 1.0, 0.0, 0.0, 1.0, 0.0, 0.0, 0.0, 0.0, 0.0]

y_score_2 = [0.99, 0.98, 0.97, 0.93, 0.85, 0.80, 0.79, 0.75, 0.70, 0.65,
             0.64, 0.63, 0.55, 0.54, 0.51, 0.49, 0.30, 0.2, 0.1, 0.09]

fpr1, tpr1, thresholds = metrics.roc_curve(y_true_1, y_score_2)
roc_auc1 = metrics.auc(fpr1, tpr1)  # the value of roc_auc1
print(roc_auc1)
plt.plot(fpr1, tpr1, 'b', label='AUC = %0.2f' % roc_auc1)

# ++++++++++++++++++++++++++++++++++++++++++++++++++++++

y_true_2 = [0.0, 1.0, 0.0, 0.0, 0.0, 0.0, 0.0, 1.0, 0.0, 1.0,
            0.0, 1.0, 0.0, 0.0, 1.0, 1.0, 0.0, 0.0, 1.0, 0.0]

y_score_2 = [0.43, 0.56, 0.97, 0.76, 0.85, 0.85, 0.79, 0.75, 0.60, 0.65,
             0.64, 0.80, 0.40, 0.54, 0.90, 0.49, 0.30, 0.2, 0.9, 0.45]

fpr2, tpr2, _ = metrics.roc_curve(y_true_2, y_score_2)
roc_auc2 = metrics.auc(fpr2, tpr2)  # the value of roc_auc1
print(roc_auc2)
plt.plot(fpr2, tpr2, 'r', label='AUC = %0.2f' % roc_auc2)

plt.legend(loc='lower right')
plt.plot([0, 1], [0, 1], 'r--')
# plt.xlim([0, 1])  # the range of x-axis
# plt.ylim([0, 1])  # the range of y-axis
plt.xlabel('False Positive Rate')  # the name of x-axis
plt.ylabel('True Positive Rate')  # the name of y-axis
plt.title('Receiver operating characteristic example')  # the title of figure
plt.show()
2 AUC曲线结果
3 绘制AUPR曲线
from sklearn import metrics
import matplotlib.pylab as plt

plt.rc('font', family='Times New Roman')

y_true_1 = [1.0, 1.0, 0.0, 1.0, 0.0, 1.0, 0.0, 1.0, 0.0, 1.0,
            0.0, 1.0, 0.0, 0.0, 1.0, 0.0, 0.0, 0.0, 0.0, 0.0]

y_score_2 = [0.99, 0.98, 0.97, 0.93, 0.85, 0.80, 0.79, 0.75, 0.70, 0.65,
             0.64, 0.63, 0.55, 0.54, 0.51, 0.49, 0.30, 0.2, 0.1, 0.09]

precision1, recall1, _ = metrics.precision_recall_curve(y_true_1, y_score_2)
aupr1 = metrics.auc(recall1, precision1)  # the value of roc_auc1
print(aupr1)
plt.plot(recall1, precision1, 'b', label='AUC = %0.2f' % aupr1)

# ++++++++++++++++++++++++++++++++++++++++++++++++++++++
y_true_2 = [1, 1, 1, 1, 1, 0, 1, 1, 0, 1, 1, 1, 0, 0, 0, 0, 1, 0, 0, 0]
y_score_2 = [0.9, 0.75, 0.86, 0.47, 0.55, 0.56, 0.74, 0.62, 0.5, 0.86,
            0.8, 0.47, 0.44, 0.67, 0.43, 0.4, 0.52, 0.4, 0.35, 0.1]


precision2, reacall2, _ = metrics.precision_recall_curve(y_true_2, y_score_2)
aupr2 = metrics.auc(reacall2, precision2)  # the value of roc_auc1
print(aupr2)
plt.plot(reacall2, precision2, 'r', label='AUC = %0.2f' % aupr2)

plt.legend(loc='lower left')
plt.plot([1, 0], 'r--', color='b')
# plt.xlim([0, 1])  # the range of x-axis
# plt.ylim([0, 1])  # the range of y-axis
plt.xlabel('Recall')  # the name of x-axis
plt.ylabel('Precision')  # the name of y-axis
plt.title('Precision-Recall')  # the title of figure
plt.show()
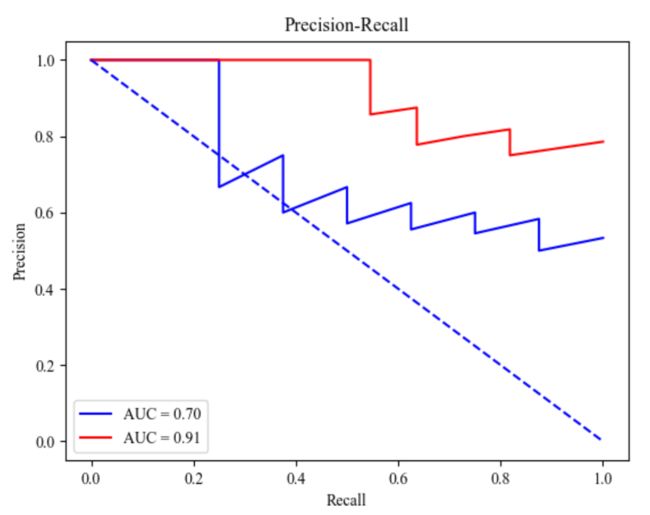
4 AUPR结果
5 参考文献
[1]如何在一张图中画多条ROC线?
[2]如何画ROC曲线和FROC曲线
[4]Python3绘制P-R曲线(二分类)

