Python数据分析第十一课:初识Seaborn
前面我们学习了Pandas如何处理数据以及用Matplotlib对数据进行可视化,在今天的课程中我们再来感受一个更具魅力的绘图工具,它叫做Seaborn。
一、Seaborn简介
Seaborn 是基于 Python 且非常受欢迎的图形可视化库,并且在 Matplotlib 的基础上,进行了更高级的封装,使得作图更加方便快捷。可以通过极简的代码,做出具有分析价值而又十分美观的图形。
首先,我们来了解一下seanborn.set()函数:
import seaborn as sns
sns.set(context='notebook',style='darkgrid',palette='deep',font='sans-serif'.font_scale=1,color_code=True)
- context:该参数控制着默认的画幅大小,分别有{papper,notebook,talk,poster}四个值。其中,poster>talk>notebook>paper。
- style:该参数控制默认样式,分别有{darkgrid,whitegrid,dark,white,ticks},可以自行更改查看他们之间的不同。
- palette:该参数为预设的调色板,分别有{deep,muted,bright,pastel,dark,colorblind}等,可以自行更改查看他们之间的不同。
- font:设置字体。
- font_scale:设置字体大小。
- color_code:不是用调色板而采用先前的“r”等色彩缩写。
import numpy as np
import matplotlib.pyplot as plt
import seaborn as sns

def sinplot():
    x = np.linspace(0,15,num=100)
    for i in range(1,3):
        plt.plot(x,np.sin(x+i))

sinplot()
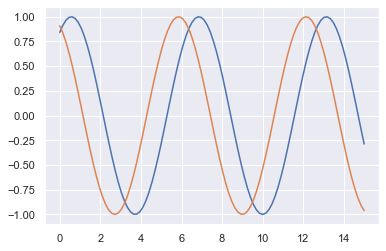
接下来,我们调用sns.set()函数来改变style,看看效果如何:
import numpy as np
import matplotlib.pyplot as plt
import seaborn as sns

def sinplot():
    x = np.linspace(0,15,num=100)
    for i in range(1,3):
        plt.plot(x,np.sin(x+i))
sns.set()
sinplot()
plt.show()
根据结果,我们添加了sns.set()方法后,图形添加了网格,而且隐藏了坐标轴。
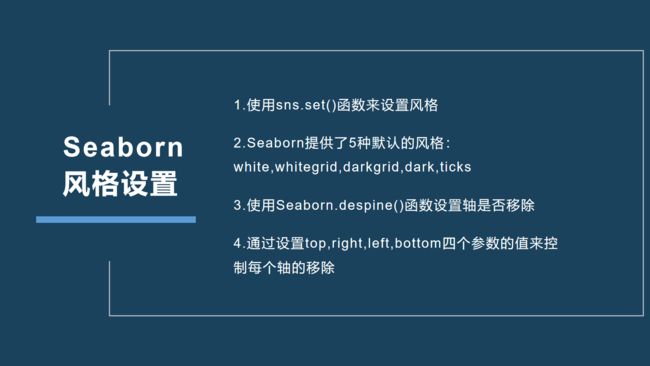
二、Seaborn风格设置
那么,问题来了,有人会说,这个set()函数这么多参数,只要改变其中任意一个参数的值,绘图效果就会发生变化,那我们怎么知道哪种搭配是最佳效果呢,难道我们要一个个去测试吗?
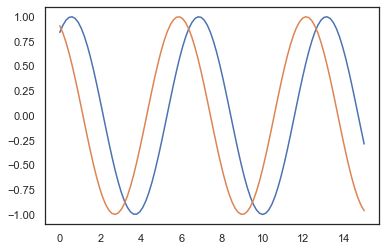
当然不是,seaborn提供了5种默认的风格,我们在实际绘图中只要选择一种喜欢的风格就可以了,下面我们就看看这5种风格的用法及效果。
import numpy as np
import matplotlib.pyplot as plt
import seaborn as sns

def sinplot():
    x = np.linspace(0,15,num=100)
    for i in range(1,3):
        plt.plot(x,np.sin(x+i))
sns.set(style='white')
sinplot()
plt.show()
import numpy as np
import matplotlib.pyplot as plt
import seaborn as sns

def sinplot():
    x = np.linspace(0,15,num=100)
    for i in range(1,3):
        plt.plot(x,np.sin(x+i))
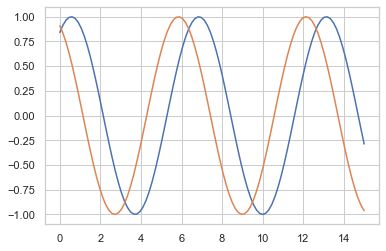
sns.set(style='whitegrid')
sinplot()
plt.show()
import numpy as np
import matplotlib.pyplot as plt
import seaborn as sns

def sinplot():
    x = np.linspace(0,15,num=100)
    for i in range(1,3):
        plt.plot(x,np.sin(x+i))
sns.set(style='darkgrid')
sinplot()
plt.show()
import numpy as np
import matplotlib.pyplot as plt
import seaborn as sns

def sinplot():
    x = np.linspace(0,15,num=100)
    for i in range(1,3):
        plt.plot(x,np.sin(x+i))
sns.set(style='dark')
sinplot()
plt.show()
import numpy as np
import matplotlib.pyplot as plt
import seaborn as sns

def sinplot():
    x = np.linspace(0,15,num=100)
    for i in range(1,3):
        plt.plot(x,np.sin(x+i))
sns.set(style='ticks')
sinplot()
plt.show()
当然,除了这5种内置风格以外,我们也可以通过其他函数进行个性化设置。
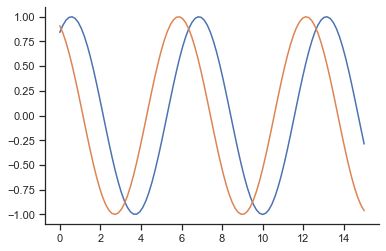
比如,当我们的风格设置为style='ticks’时,会有上部和右侧的坐标轴,我们可以使用seaborn.despine()函数进行去除。
%matplotlib inline
import numpy as np
import matplotlib.pyplot as plt
import seaborn as sns

def sinplot():
    x = np.linspace(0,15,100)
    for i in range(1,3):
        plt.plot(x,np.sin(x+i))

sns.set(style='ticks')
sinplot()
sns.despine()
plt.show()
sns.despine()函数默认移除了上部和右侧的轴,当然我们也可以移除其他轴。
对于是否移除某个轴,我们可以设置sns.despine()函数的top、right、left、bottom参数的值来控制,值为True时,会移除该轴,反之,保留该轴。
子图风格设置
在matplotlib中我们已经学过了,在一个figure对象中,我们可以添加多个子图,那么如何让我们不同的子图使用不同的风格呢?
我们可以使用with设置风格,在with下画的图都可以使用该种风格。
%matplotlib inline
import numpy as np
import matplotlib.pyplot as plt
import seaborn as sns

def sinplot():
    x = np.linspace(0,15,100)
    for i in range(1,3):
        plt.plot(x,np.sin(x+i))

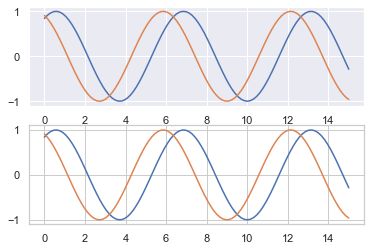
with sns.axes_style('darkgrid'):
    plt.subplot(211)
    sinplot()

plt.subplot(212)
sns.set(style='whitegrid')
sinplot()
plt.show()
我们看到第一个子图的风格成功设置成了darkgrid,而且在绘制第二个子图的时候并未受到影响。
sns.axes_style()的作用是临时设置绘图的参数,也就是只设置使用with打开的作用域内的绘图,不会对其他的图造成影响。
这就是常用seaborn库的风格设置,我们常会使用sns.set()设置图形风格,以及使用with sns.axes_style()函数给不同的子图设置不同的风格。
三、Seaborn调色板及颜色设置
颜色在可视化中非常重要,用来代表各种特征,并且提高整个图的观赏性。
前面我们学习了如何设置seaborn画图的整体风格,接下来我们学习一下seaborn如何创建调色板以及使用调色板设置颜色。
调色板就像是装水彩笔的盒子,等我们把图绘制完成以后,使用相应颜色的水彩笔涂上颜色就好了
color_palette()
seaborn的seaborn.color_palette()函数提供了一组定义好的调色板,我们了解一下这个函数:
seaborn.color_palette(palette=None,n_colors=None,desat=None
该函数的返回值:一个调色板定义的颜色列表。
- palette:调色板,可以不写,可以填写字符串,也可以是一个序列
- n_colors:可以指定颜色的数量
- desat:按照比例降低每一种颜色的饱和度
不带任何参数时,表示获取这个盒子里的全部颜色。
import seaborn as sns

# 获取默认调色板的颜色列表
current_palette = sns.color_palette()
# 绘制调色板的颜色
sns.palplot(current_palette)
color_palette()默认给我们提供了6种主题颜色去对应matplotlib中的10种颜色。
6个默认的颜色主题是:deep, muted, pastel, bright, dark, colorblind
下面我们依次看一下每一种主题色的效果:
import seaborn as snsn

# 获取默认调色板的颜色列表
current_palette = sns.color_palette()
# 绘制调色板的颜色
sns.palplot(current_palette)

theme_list = ['deep','muted','pastel','bright','dark','colorblind']
for i in theme_list:
    sns.palplot(sns.color_palette(i))


注意: 这六种主题形成的颜色列表中,最多含有10种,如果我们设置n_colors的值多余10中,就会用这10种颜色进行循环增加。
%matplotlib inline

sns.palplot(sns.color_palette('deep',12))
以上的代码运行后,我们发现12个颜色中,前两个和最后两个是一样的。
如果我们想用不同的颜色表示不同的类别,有没有更多的颜色可供我们使用呢?
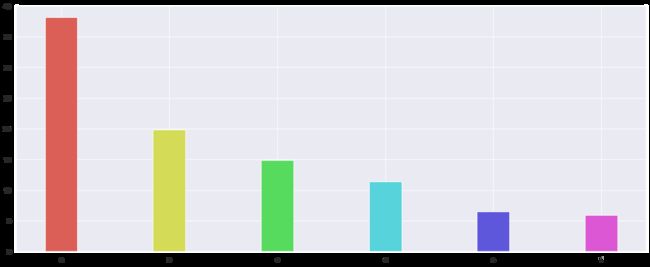
最常用的方法是使用hls的颜色空间,这是RGB值的一个简单转换。
hls:大家就可以看做是一个颜色足够丰富的色板。
%matplotlib inline

from matplotlib import pyplot as plt
import seaborn as sns

a = ['a','b','c','d','e','f']
b = [38.13,19.85,14.89,11.36,6.47,5.93]
plt.figure(figsize=(20,8),dpi=80)

# 绘制条形图
plt.bar(a,b,width=0.3,color=sns.color_palette('hls',6))
plt.show()
四、总结
Seaborn简介
Seaborn风格设置
Seaborn调色板及颜色设置
五、练习
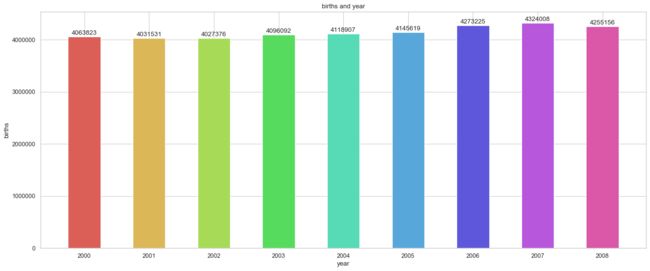
- 这是一份从2000年到2008年每个月新生婴儿数据,使用matplotlib绘制出每年总出生数的柱状图,并使用seaborn设置一种风格。
%matplotlib inline
import matplotlib.pyplot as plt
import pandas as pd
import seaborn as sns

# 读取数据
data = pd.read_excel(r'C:\Users\lin-a\Desktop\data\births.xlsx')
#了解数据基本特征
print(data.shape)
data.head()
(216, 4)
| year | month | gender | births | |
|---|---|---|---|---|
| 0 | 2000 | 1 | F | 161288 |
| 1 | 2000 | 1 | M | 169225 |
| 2 | 2000 | 2 | F | 154694 |
| 3 | 2000 | 2 | M | 162997 |
| 4 | 2000 | 3 | F | 166124 |
# 年份分组
groups = data.groupby('year')['births'].sum()
groups
year
2000    4063823
2001    4031531
2002    4027376
2003    4096092
2004    4118907
2005    4145619
2006    4273225
2007    4324008
2008    4255156
Name: births, dtype: int64
x = groups.index.tolist()
y = groups.values.tolist()
# 设置画布大小
plt.figure(figsize=(20,8),dpi=80)
# 绘制柱形图
rects = plt.bar(x,y,width=0.5,color=sns.color_palette('hls',9))
# 设置每年出生的数量
for rect in rects:
    height = rect.get_height()
    plt.text(rect.get_x()+rect.get_width()/2,height+40000,str(height),ha='center')
# 设置x轴显示范围
plt.xticks(x)
# 设置x,y图例和标题
plt.xlabel('year')
plt.ylabel('births')
plt.title('births and year')
# 设置图形风格
sns.set(style='whitegrid')
plt.show()
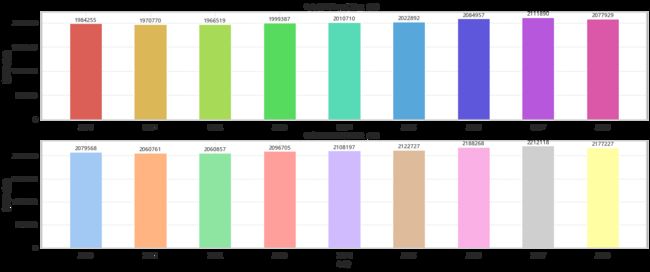
- 继续使用上一份数据。
- 绘制出每年出生的男孩柱状图
- 绘制出每年出生的女孩柱状图
%matplotlib inline
from matplotlib import pyplot as plt
import pandas as pd
import seaborn as sns

# 导入数据
# 读取数据
data = pd.read_excel(r'C:\Users\lin-a\Desktop\data\births.xlsx')
#了解数据基本特征
print(data.shape)
data.head()
(216, 4)
| year | month | gender | births | |
|---|---|---|---|---|
| 0 | 2000 | 1 | F | 161288 |
| 1 | 2000 | 1 | M | 169225 |
| 2 | 2000 | 2 | F | 154694 |
| 3 | 2000 | 2 | M | 162997 |
| 4 | 2000 | 3 | F | 166124 |
# 数据分组
groups = data.groupby(by=['year','gender'])
# 循环遍历分组数据
x1 = []
y1 = []
x2 = []
y2 = []
for group_name, group_df in groups:
    # 当性别为女时,取出x,y的数据
    if group_name[1] == 'F':
        x1.append(group_name[0])
        y1.append(group_df['births'].sum())
    # 当性别为男时,取出对应的数据
    elif group_name[1] == 'M':
        x2.append(group_name[0])
        y2.append(group_df['births'].sum())

# 设置画布大小
plt.figure(figsize=(20,8),dpi=80)
# 设置全局字体
plt.rcParams['font.sans-serif'] = ['Microsoft YaHei']

# 绘制每年出生的女孩柱状图
plt.subplot(211)
rects1 = plt.bar(x1,y1,width=0.5,color=sns.color_palette('hls',9))

plt.xticks(x1)
plt.title('每年新出生婴儿数量(女)')
plt.ylabel('新出生数量')
plt.grid(linestyle='--',alpha=0.7)
for rect in rects1:
    height = rect.get_height()
    plt.text(rect.get_x()+rect.get_width()/2,height+40000,str(height),ha='center')
# 绘制每年出生的男孩柱状图
plt.subplot(212)
rects2 = plt.bar(x2,y2,width=0.5,color=sns.color_palette('pastel',9))
plt.xticks(x2)
plt.xlabel('年份')
plt.ylabel('新出生数量')
plt.title('每年新出生婴儿数量(男)')
plt.grid(linestyle='--',alpha=0.7)
for rect in rects2:
    height = rect.get_height()
    plt.text(rect.get_x()+rect.get_width()/2,height+40000,str(height),ha='center')

plt.show()
