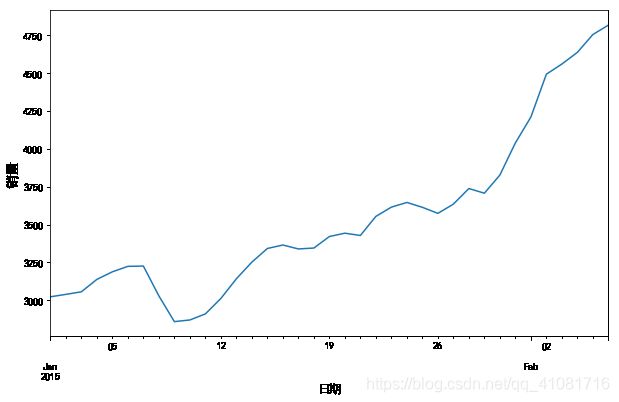
案例:2015/1/1至2015/2/6某餐厅销售数据进行建模
参考链接:
1.https://zhuanlan.zhihu.com/p/54985638
2.https://zhuanlan.zhihu.com/p/35128342
3.https://www.kaggle.com/pratyushakar/time-series-analysis-using-arima-sarima
statsmodels.tsa.arima_model文档:https://www.statsmodels.org/stable/search.html?q=statsmodels.tsa.arima_model
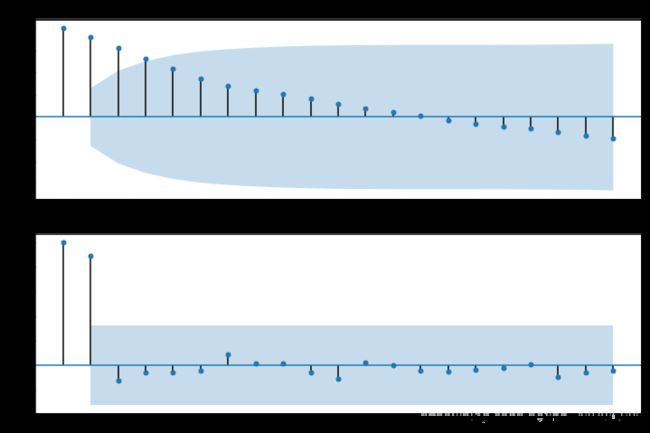
1:原始数据平稳性判断
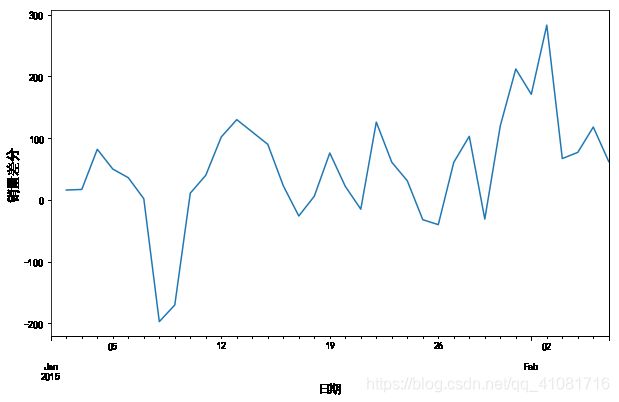
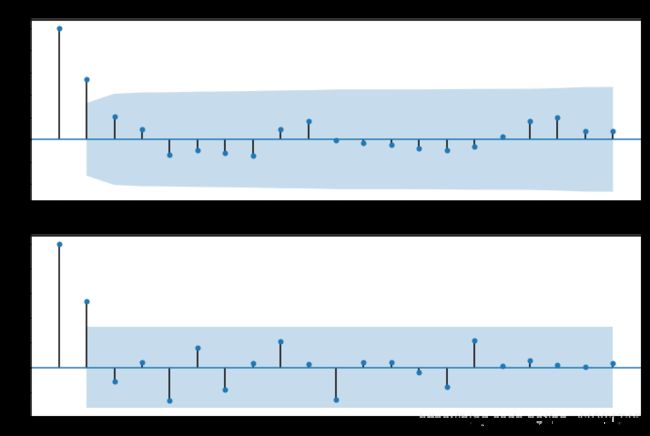
2:差分数据平稳性判断
3:对差分数据建模,并得到预测值
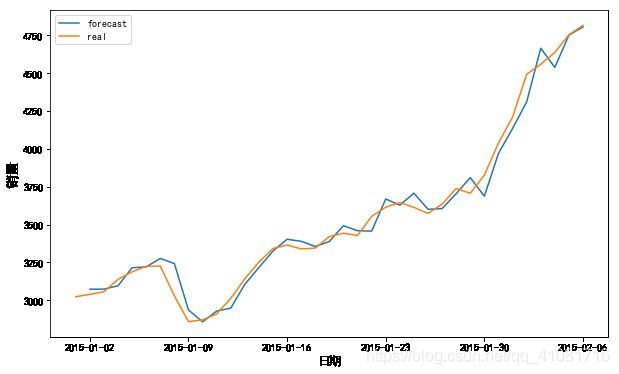
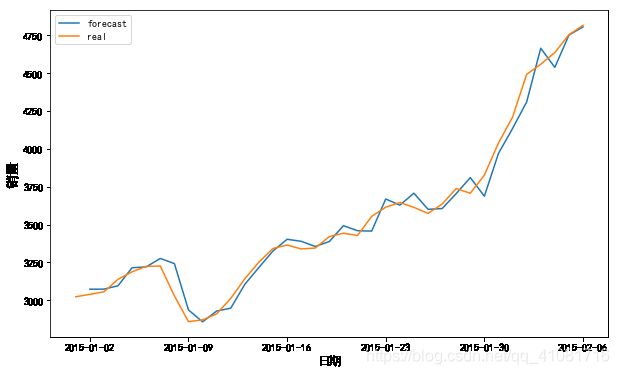
4:返回原数据的预测值,并画出拟合图
import pandas as pd
import matplotlib.pyplot as plt
from datetime import datetime
import numpy as np
import statsmodels.api as sm
from statsmodels.tsa.stattools import adfuller
from pandas.plotting import autocorrelation_plot
from statsmodels.tsa.arima_model import ARIMA
excelFile = 'C:/Users/admin/Desktop/Jupyter/数据分析/python数据分析-从入门到精通/第12周/arima_data.xls'
data = pd.read_excel(excelFile, index_col = u'日期')
data = pd.DataFrame(data,dtype=np.float64)
plt.figure(figsize=(10, 6))
plt.rcParams['font.sans-serif'] = ['SimHei']
plt.rcParams['axes.unicode_minus'] = False
data["销量"].plot()
plt.xlabel('日期',fontsize=12,verticalalignment='top')
plt.ylabel('销量',fontsize=14,horizontalalignment='center')
plt.show()
data.head()
|
销量 |
| 日期 |
|
| 2015-01-01 |
3023.0 |
| 2015-01-02 |
3039.0 |
| 2015-01-03 |
3056.0 |
| 2015-01-04 |
3138.0 |
| 2015-01-05 |
3188.0 |
fig = plt.figure(figsize=(12,8))
ax1=fig.add_subplot(211)
fig = sm.graphics.tsa.plot_acf(data,lags=20,ax=ax1)
ax2 = fig.add_subplot(212)
fig = sm.graphics.tsa.plot_pacf(data,lags=20,ax=ax2)
plt.show()
temp = np.array(data["销量"])
t = adfuller(temp)
output=pd.DataFrame(index=['Test Statistic Value', "p-value", "Lags Used", "Number of Observations Used","Critical Value(1%)","Critical Value(5%)","Critical Value(10%)"],columns=['value'])
output['value']['Test Statistic Value'] = t[0]
output['value']['p-value'] = t[1]
output['value']['Lags Used'] = t[2]
output['value']['Number of Observations Used'] = t[3]
output['value']['Critical Value(1%)'] = t[4]['1%']
output['value']['Critical Value(5%)'] = t[4]['5%']
output['value']['Critical Value(10%)'] = t[4]['10%']
output
|
value |
| Test Statistic Value |
1.81377 |
| p-value |
0.998376 |
| Lags Used |
10 |
| Number of Observations Used |
26 |
| Critical Value(1%) |
-3.71121 |
| Critical Value(5%) |
-2.98125 |
| Critical Value(10%) |
-2.63009 |
from statsmodels.stats.diagnostic import acorr_ljungbox
print(acorr_ljungbox(data["销量"], lags=1))
(array([ 32.0111333]), array([ 1.53291527e-08]))
data1= data["销量"].diff(1)
plt.figure(figsize=(10, 6))
data1.plot()
plt.xlabel('日期',fontsize=12,verticalalignment='top')
plt.ylabel('销量差分',fontsize=14,horizontalalignment='center')
plt.show()
temp = np.diff(data["销量"])
t = adfuller(temp)
output=pd.DataFrame(index=['Test Statistic Value', "p-value", "Lags Used", "Number of Observations Used","Critical Value(1%)","Critical Value(5%)","Critical Value(10%)"],columns=['value'])
output['value']['Test Statistic Value'] = t[0]
output['value']['p-value'] = t[1]
output['value']['Lags Used'] = t[2]
output['value']['Number of Observations Used'] = t[3]
output['value']['Critical Value(1%)'] = t[4]['1%']
output['value']['Critical Value(5%)'] = t[4]['5%']
output['value']['Critical Value(10%)'] = t[4]['10%']
output
|
value |
| Test Statistic Value |
-3.15606 |
| p-value |
0.0226734 |
| Lags Used |
0 |
| Number of Observations Used |
35 |
| Critical Value(1%) |
-3.63274 |
| Critical Value(5%) |
-2.94851 |
| Critical Value(10%) |
-2.61302 |
sales = list(np.diff(data["销量"]))
data2 = {
"日期":data1.index[1:],
"销量":sales
}
df = pd.DataFrame(data2)
df['日期'] = pd.to_datetime(df['日期'])
data_diff = df.set_index(['日期'], drop=True)
data_diff.head()
|
销量 |
| 日期 |
|
| 2015-01-02 |
16.0 |
| 2015-01-03 |
17.0 |
| 2015-01-04 |
82.0 |
| 2015-01-05 |
50.0 |
| 2015-01-06 |
36.0 |
fig = plt.figure(figsize=(12,8))
ax1=fig.add_subplot(211)
fig = sm.graphics.tsa.plot_acf(data_diff,lags=20,ax=ax1)
ax2 = fig.add_subplot(212)
fig = sm.graphics.tsa.plot_pacf(data_diff,lags=20,ax=ax2)
plt.show()
sm.tsa.arma_order_select_ic(data_diff,max_ar=6,max_ma=4,ic='aic')['aic_min_order']
(0, 1)
```python
pmax = int(len(df) / 10)
qmax = int(len(df) / 10)
bic_matrix = []
for p in range(pmax +1):
temp= []
for q in range(qmax+1):
try:
temp.append(ARIMA(data, (p, 1, q)).fit().bic)
except:
temp.append(None)
bic_matrix.append(temp)
bic_matrix = pd.DataFrame(bic_matrix)
p,q = bic_matrix.stack().idxmin()
print(u'BIC 最小的p值 和 q 值:%s,%s' %(p,q))
BIC 最小的p值 和 q 值:0,1
model = ARIMA(data, (p,1,q)).fit()
model.summary2()
| Model: |
ARIMA |
BIC: |
422.5101 |
| Dependent Variable: |
D.销量 |
Log-Likelihood: |
-205.88 |
| Date: |
2020-04-27 22:21 |
Scale: |
1.0000 |
| No. Observations: |
36 |
Method: |
css-mle |
| Df Model: |
2 |
Sample: |
01-02-2015 |
| Df Residuals: |
34 |
|
02-06-2015 |
| Converged: |
1.0000 |
S.D. of innovations: |
73.086 |
| AIC: |
417.7595 |
HQIC: |
419.418 |
|
Coef. |
Std.Err. |
t |
P>|t| |
[0.025 |
0.975] |
| const |
49.9564 |
20.1390 |
2.4806 |
0.0182 |
10.4847 |
89.4281 |
| ma.L1.D.销量 |
0.6710 |
0.1648 |
4.0712 |
0.0003 |
0.3480 |
0.9941 |
|
Real |
Imaginary |
Modulus |
Frequency |
| MA.1 |
-1.4902 |
0.0000 |
1.4902 |
0.5000 |
predictions_ARIMA_diff = pd.Series(model.fittedvalues, copy=True)
print(predictions_ARIMA_diff.head())
日期
2015-01-02    49.956427
2015-01-03    34.245128
2015-01-04    39.803780
2015-01-05    76.789439
2015-01-06    32.393775
dtype: float64
plt.figure(figsize=(10, 6))
plt.plot(predictions_ARIMA_diff,label="forecast_diff")
plt.plot(data_diff,label="diff")
plt.xlabel('日期',fontsize=12,verticalalignment='top')
plt.ylabel('销量差分',fontsize=14,horizontalalignment='center')
plt.legend()
plt.show()
predictions = [i + j for i, j in zip(list(predictions_ARIMA_diff), list(data["销量"][:36]))]
prediction_sales = {
"日期":data1.index[1:],
"销量":predictions
}
prediction_sales = pd.DataFrame(prediction_sales)
prediction_sales['日期'] = pd.to_datetime(prediction_sales['日期'])
prediction_sales = prediction_sales.set_index(['日期'], drop=True)
prediction_sales.head()
|
销量 |
| 日期 |
|
| 2015-01-02 |
3072.956427 |
| 2015-01-03 |
3073.245128 |
| 2015-01-04 |
3095.803780 |
| 2015-01-05 |
3214.789439 |
| 2015-01-06 |
3220.393775 |
plt.figure(figsize=(10, 6))
plt.plot(prediction_sales,label="forecast")
plt.plot(data,label="real")
plt.xlabel('日期',fontsize=12,verticalalignment='top')
plt.ylabel('销量',fontsize=14,horizontalalignment='center')
plt.legend()
plt.show()
model.forecast(5)
(array([ 4873.9667493 ,  4923.92317644,  4973.87960359,  5023.83603073,
         5073.79245787]),
 array([  73.08574293,  142.32679918,  187.542821  ,  223.80281869,
         254.95704265]),
 array([[ 4730.72132537,  5017.21217324],
        [ 4644.96777602,  5202.87857687],
        [ 4606.30242887,  5341.4567783 ],
        [ 4585.19056646,  5462.48149499],
        [ 4574.08583666,  5573.49907907]])


