吴恩达机器学习ex2
文章目录
-
- 逻辑回归-线性可分
-
- 基础知识
- 实验要求
- 数据可视化
- 构造数据集
- 构造损失函数
- 梯度下降函数
- 准确率
- 绘制决策边界
- 逻辑回归-线性不可分
-
- 知识点
- 案例介绍
- 数据可视化
- 特征映射
- 构造数据集
- 正则化损失函数
- 梯度下降函数
- 准确率
- 数据可视化
逻辑回归-线性可分
基础知识
线性可分指的是多变量的情况下,可以用直线将两种类别进行划分
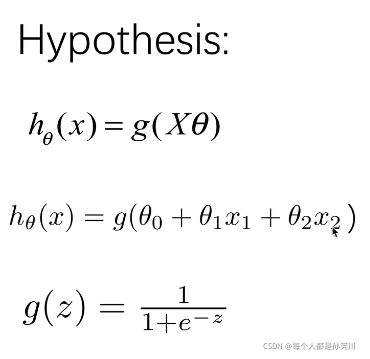
这样我们可以对该模型的函数做出如下假设,由于该分类需要将结果分为0和1,如果还是与上次实验一样使用h=theta@X的话,结果的取值会有不落在0-1之中的。所以添加了一个激活函数sigmoid函数,将theta@X再次做运算,让函数收敛到0和1之间。
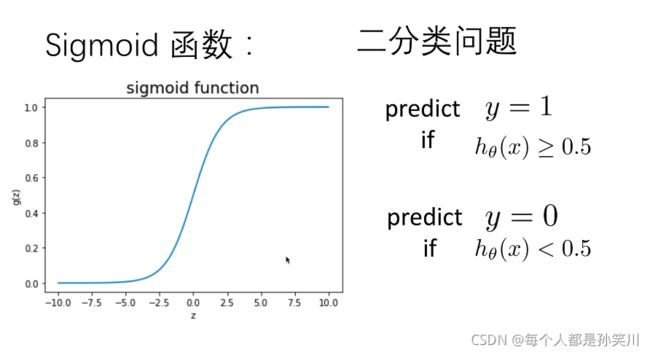
关于sigmoid函数
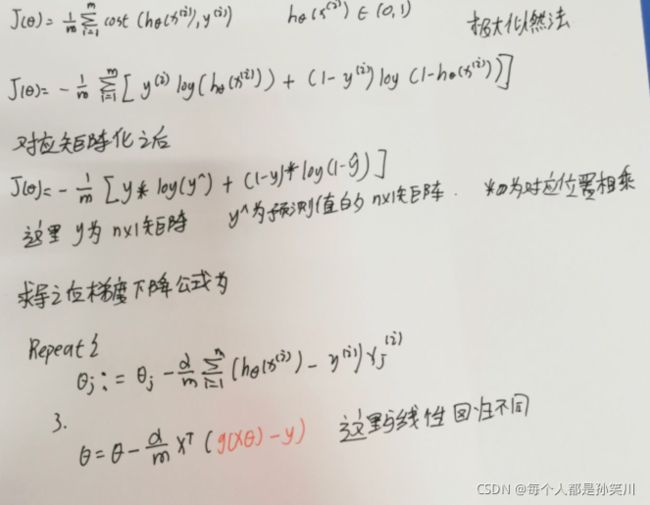
同样的,如果损失函数的计算再使用线性回归中类似的算法的话,可能会出现有多个局部最优解,我们在这里采用的损失函数如下: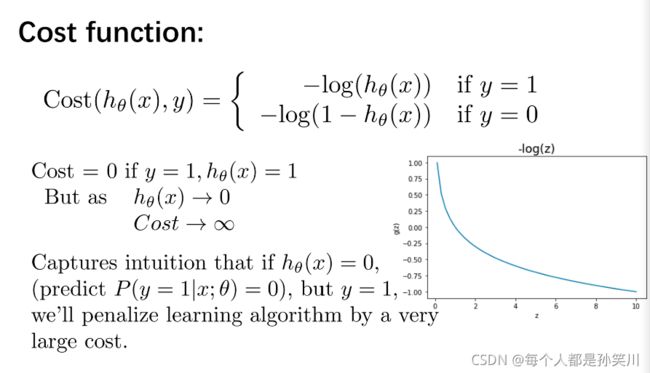
代价函数与批量梯度下降函数如图所示:
实验要求
根据学生的两门成绩,预测该学生是否会被大学录取。 数据集:ex2data1.txt
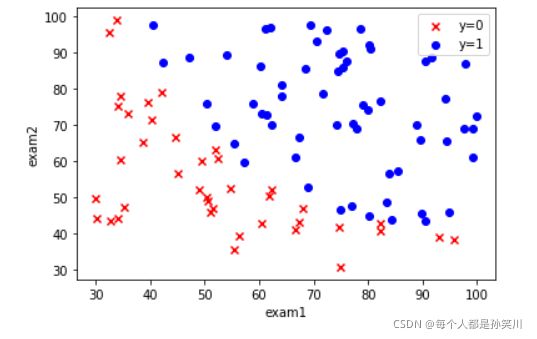
数据可视化
import numpy as np
import pandas as pd
import matplotlib.pyplot as plt
path='./ex2data1.txt'
data=pd.read_csv(path,names=['Exam 1','Exam 2','Accepted'])
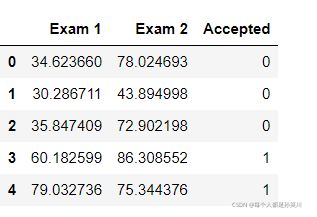
data.head()
fig,ax=plt.subplots()
ax.scatter(data[data['Accepted']==0]['Exam 1'],data[data['Accepted']==0]['Exam 2'],c='r',marker='x',label='y=0')

ax.scatter(data[data['Accepted']==1]['Exam 1'],data[data['Accepted']==1]['Exam 2'],c='b',marker='o',label='y=1')
ax.legend()
ax.set(xlabel='exam1',
      ylabel='exam2')
plt.show()
构造数据集
def get_Xy(data):
    data.insert(0,'ones',1)
    X_=data.iloc[:,0:-1]
    X=X_.values

    y_=data.iloc[:,-1]
    y=y_.values.reshape(len(y_),1)

    return X,y
X,y=get_Xy(data)
X.shape,y.shape
构造损失函数
# 定义激活函数
def sigmoid(z):
    return 1/(1+np.exp(-z))
def costFunction(X,y,theta):
    A=sigmoid(X@theta)# 经历激活函数转换之后的结果
    first=y*np.log(A)
    second=(1-y)*np.log(1-A)
    return -np.sum(first+second)/len(X)
theta=np.zeros((3,1))
cost_init=costFunction(X,y,theta)
print(cost_init)
梯度下降函数
def gradientDescent(X,y,theta,iters,alpha):
    m=len(X)
    costs=[]

    for i in range(iters):
        A=sigmoid(X@theta)
        theta=theta-(X.T@(A-y))*alpha/m
        cost=costFunction(X,y,theta)
        costs.append(cost)
        if i % 1000==0:
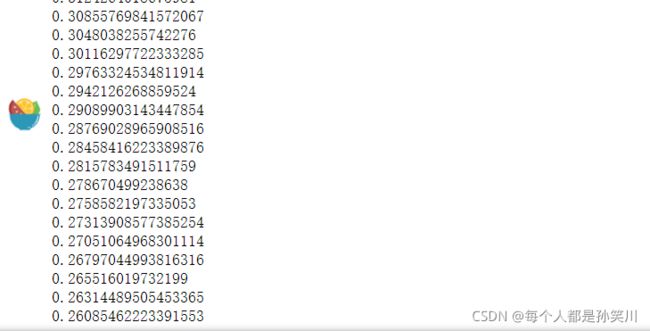
            print(cost)
    return costs,theta
alpha=0.004
iters=200000
costs,theta_final=gradientDescent(X,y,theta,iters,alpha)
theta_final
准确率
def predict(X,theta):
    prob=sigmoid(X@theta)
    return [1 if x>=0.5 else 0 for x in prob]

y_=np.array(predict(X,theta_final))
y_pre=y_.reshape(len(y_),1)

acc=np.mean(y_pre==y)
print(acc)
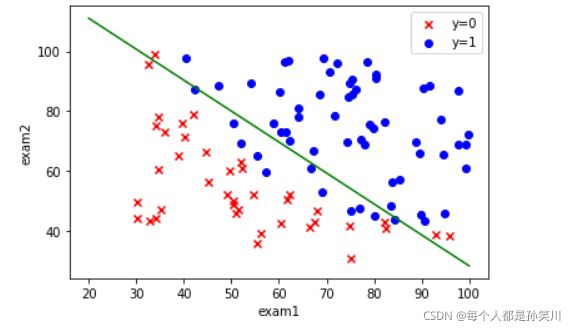
绘制决策边界
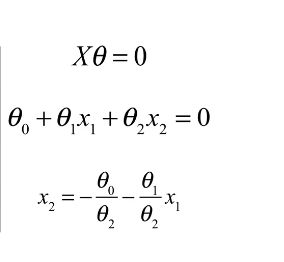
coef1=-theta_final[0,0]/theta_final[2,0]
coef2=-theta_final[1,0]/theta_final[2,0]

x=np.linspace(20,100,100)
f=coef1+coef2*x
fig,ax=plt.subplots()
ax.scatter(data[data['Accepted']==0]['Exam 1'],data[data['Accepted']==0]['Exam 2'],c='r',marker='x',label='y=0')

ax.scatter(data[data['Accepted']==1]['Exam 1'],data[data['Accepted']==1]['Exam 2'],c='b',marker='o',label='y=1')
ax.legend()
ax.set(xlabel='exam1',
      ylabel='exam2')

ax.plot(x,f,c='g')
plt.show()
逻辑回归-线性不可分
知识点
线性不可分指的是没有办法用一条直线将类别进行区分
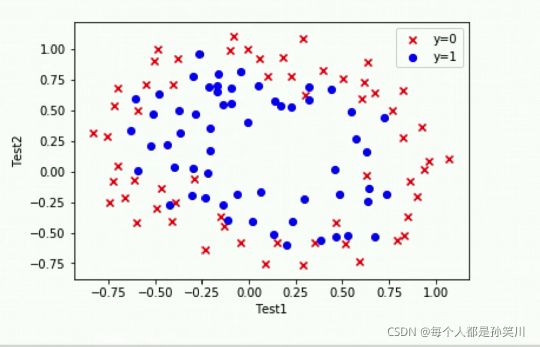
我们无法使用单纯的线性模型来组合特征,我们需要使用复杂的模型来进行组合特征。
我们需要进行特征映射
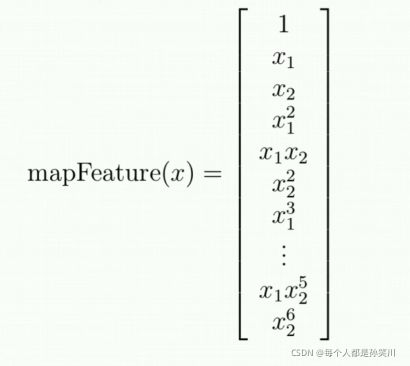
例如:X1、X2映射到2阶
1、X1、X2、X12、X22、X1X2
正则化线性回归
在损失函数里面添加一个正则项,防止过拟合或者欠拟合


案例介绍
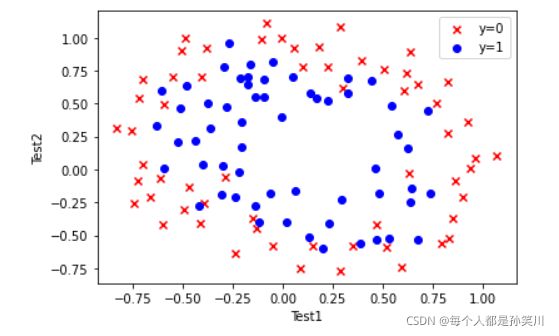
设想你是工厂的生产主管,你要决定是否芯片被接受或者抛弃
数据集:ex2data2.txt,芯片在两次测试中的测试结果
数据可视化
import numpy as np
import pandas as pd
import matplotlib.pyplot as plt

path='./ex2data2.txt'
data=pd.read_csv(path,names=['Test1','Test2','Accepted'])
data.head()
fig,ax=plt.subplots()
ax.scatter(data[data['Accepted']==0]['Test1'],data[data['Accepted']==0]['Test2'],c='r',marker='x',label='y=0')

ax.scatter(data[data['Accepted']==1]['Test1'],data[data['Accepted']==1]['Test2'],c='b',marker='o',label='y=1')
ax.legend()
ax.set(xlabel='Test1',
      ylabel='Test2')
plt.show()
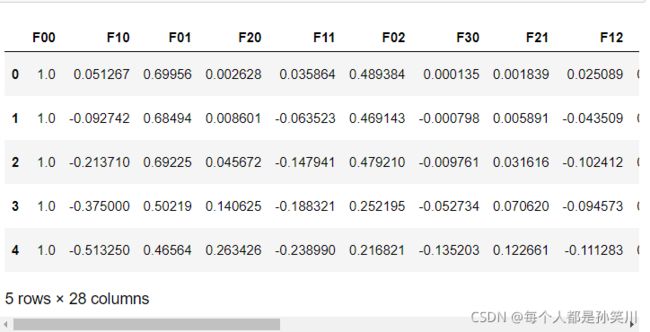
特征映射
def feature_mapping(x1,x2,power):
    data={}

    for i in np.arange(power+1):
        for j in np.arange(i+1):
            data['F{}{}'.format(i-j,j)]=np.power(x1,i-j)*np.power(x2,j)

    return pd.DataFrame(data)
x1=data['Test1']
x2=data['Test2']
data2=feature_mapping(x1,x2,6)
data2.head()
构造数据集
X=data2.values
y=data.iloc[:,-1].values
y=y.reshape(len(y),1)
正则化损失函数
# 定义激活函数
def sigmoid(z):
    return 1/(1+np.exp(-z))

def costFunction(X,y,theta,lamda):
    A=sigmoid(X@theta)# 经历激活函数转换之后的结果
    first=y*np.log(A)
    second=(1-y)*np.log(1-A)

    reg=np.sum(np.power(theta[1:],2))*(lamda/(2*len(X)))
    return -np.sum(first+second)/len(X)+reg
theta=np.zeros((28,1))
lamda=1
cost_init=costFunction(X,y,theta,lamda)
print(cost_init)
梯度下降函数
def gradientDescent(X,y,theta,iters,alpha,lamda):
    m=len(X)
    costs=[]

    for i in range(iters):

        reg=theta[1:]*(lamda*alpha/len(X))
        reg=np.insert(reg,0,values=0,axis=0)
        A=sigmoid(X@theta)
        theta=theta-(X.T@(A-y))*alpha/m-reg
        cost=costFunction(X,y,theta,lamda)
        costs.append(cost)
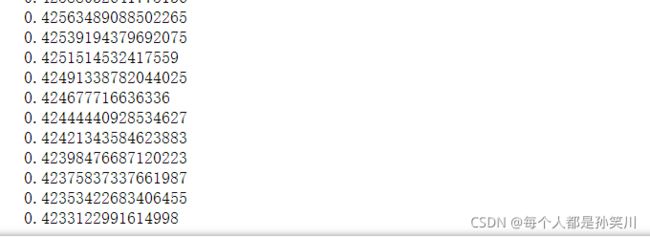
        if i % 1000==0:
            print(cost)
    return costs,theta
alpha=0.001
iters=200000
lamda=0.1
costs,theta_final=gradientDescent(X,y,theta,iters,alpha,lamda)
准确率
def predict(X,theta):
    prob=sigmoid(X@theta)
    return [1 if x>=0.5 else 0 for x in prob]

y_=np.array(predict(X,theta_final))
y_pre=y_.reshape(len(y_),1)

acc=np.mean(y_pre==y)

print(acc)
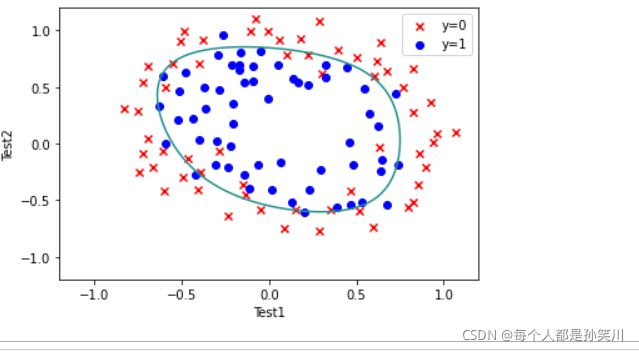
数据可视化
x=np.linspace(-1.2,1.2,200)
xx,yy=np.meshgrid(x,x)

z=feature_mapping(xx.ravel(),yy.ravel(),6).values

zz=z@theta_final

zz=zz.reshape(xx.shape)

fig,ax=plt.subplots()
ax.scatter(data[data['Accepted']==0]['Test1'],data[data['Accepted']==0]['Test2'],c='r',marker='x',label='y=0')

ax.scatter(data[data['Accepted']==1]['Test1'],data[data['Accepted']==1]['Test2'],c='b',marker='o',label='y=1')
ax.legend()
ax.set(xlabel='Test1',
      ylabel='Test2')

plt.contour(xx,yy,zz,0)
plt.show()
