ASD OTO 可见近红外光谱合并 试验须知与注意事项 工程文档
1:前言 Preface
该文档主要是留给使用这两台仪器的的师弟师妹快速上手,由于这两台仪器的主要使用者包括留学生,所以这个文档为中英双语。
This document is servicing for my junior fellow who use these two instruments to get started quickly. Because the users of these two instruments include overseas students, this document have English Version.
2:仪器简介 Introduction of instrument
2.1主要参数
1.
可见短波近红外高光谱仪器(以下简称ASD):ASD HandHeld 2(Malvern Panalytical,英国)(光谱范围为380-1075 nm,分辨率为1 nm)
Visible short-wave near-infrared hyperspectral instrument (ASD):ASD HandHeld 2(Malvern Panalytical,UK)(range 380-1075 nm,resolution 1 nm)
官网/official website
ASD HandHeld 2 Pro: VNIR Hand-held - Spectroradiometer | 产品支持 | Malvern Panalytical
2.
近红外光谱仪(以下简称OtO):SW2520-050-NIRA(台湾超微光学,中国台湾)(光谱范围为870-1700 nm,分辨率为6nm)
Near infrared spectrometer (OtO) : SW2520-050-NIRA (Taiwan ultramicro optics, Taiwan, China) (range 870-1700 nm, resolution 6nm)
官网/official website
响尾蛇系列 SideWinder (otophotonics.com)
2.2 注意事项 Matters needing attention
1:试验采用的Y型光纤型号为:SIH400 Y6+1, 鑫锐光子科技有限公司,中国;光纤昂贵,过度弯曲会使其折断,使用时因谨慎注意。
2:保持探头与光纤内部清洁,灰尘的落入会导致数据精度发生改变,由于无法清洗,这是不可逆的。所以要求试验场地应为干净且无尘土漂浮。
3:光源产生的热量导致系统的温度变化是影响数据的主要系统误差,所以每次试验前应该开启光源让系统预热15分钟。并且在接下来的试验中,30-45分钟需要对系统进行校正以保证可靠的精度。
4:白板需要妥善放置和保护,受到污染白板会直接导致数据前后失真。
5:ASD仪器需要白板校正,OtO需要白板校正和黑板校正。需要注意首次使用OtO软件时,要将默认的文件储存格式设置为CSV格式,方便处理。
1. The model of Y-type fiber used in the test is: SIH400 Y6+1, Xinrui Photonics Technology Co., LTD., China; Optical fiber is very expensive, excessive bending will cause it to break,Please use with much caution.
2: Keep the probe and fiber inside clean, dust falling will lead to changes in data accuracy, which is irreversible because it cannot be cleaned unless buy new. Therefore, it is required that the test place should be clean and free of dust floating.
3. The temperature change of the system from the heat generated by the light source is the cause of main system error that affecting the data, so the light source should be turned on to allow the system to warm up for 15 minutes before each test. And in the following test, the system needs to be corrected in 30 to 45 minutes to ensure reliable accuracy.
4: The whiteboard needs to be properly placed and protected. polluted whiteboard will directly lead to data distortion.
5:ASD instruments require whiteboard correction, OtO requires whiteboard correction and blackboard correction. When you use the OtO software for the first time, set the default file format to CSV for easy handling.
3:数据的导入和储存 Data import and storage
3.1ASD
将ASD连接到电脑后使用以下链接中的插件将数据下载到电脑
Once you have connected the ASD to your computer, use the following link 's software o download the data
ASDHandHeld2传输数据插件-其它文档类资源-CSDN文库
之后使用ViewSpecPro(VSP)将下载的文件转化为txt格式
Then use ViewSpecPro(VSP) to convert the downloaded file to TXT format
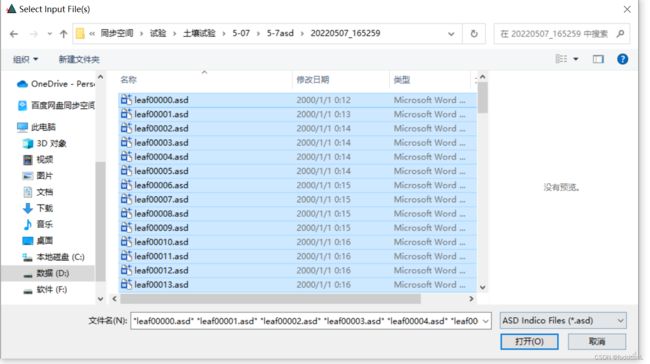
如图:用VSP打开下载的文件需要全选
Figure: Open the downloaded file with VSP need to select all
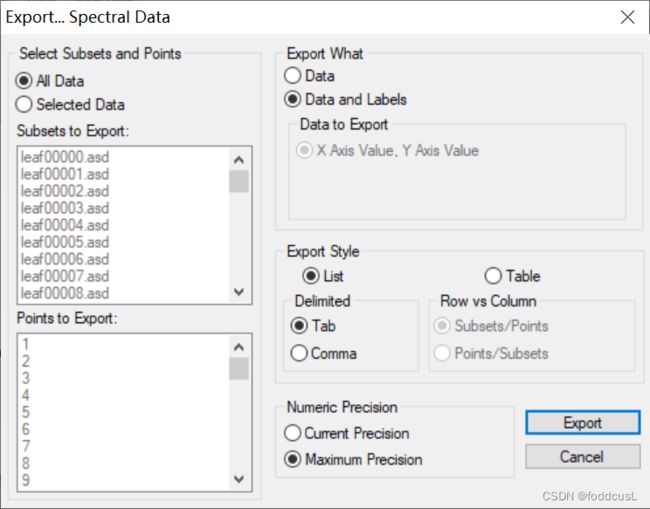
点击View 然后点击 Graph Date 后,选择csv格式并设置好输出文件路径和文件名(.注意:csv后缀)
Click View and then Graph Date, select csv format and set the output file path and file name ( Note: CSV suffix)
如上操作输出即可
The output is as Fig follows
3.2OtO
OtO的储存格式比较特别,我们默认为子文件夹储存数据的储存方式,因为在植物生理的试验中,我们一篇叶子要取3个采样点,这就决定了我们的样本文件夹要存放不同的3个光谱数据。
OtO storage format is special. By default, we store spectral data in sub-folders. Because in the experiment of plant physiology, we need to take 3 sampling points for one leaf(sample), which determines that our sample folder need to store 3 different spectral data.
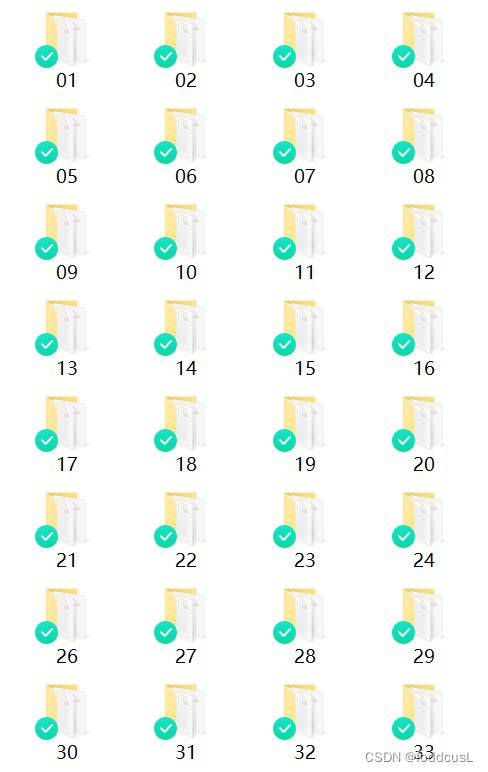
1层文件夹:子文件为样本代号的文件夹(注意:文件排序,三位数样本个位数应取001、002...)
Layer 1 folder: A folder whose subfiles are sample codes(Note: for file sorting, the number of units in three-digit sample should be 001, 002...)
2层文件夹:存放着该样本的三个采集点的光谱数据(默认名称1、2、3)
Layer 2 folder: holds the spectral data of the three collection points of the sample (default name 1, 2, 3)
4:自动化拼接与输出 Automated stitching and output
注意:该页面的所有脚本已经打包成压缩包,下面链接下载即可(不需要各个复制粘贴)
Note: All the scripts on this page have been packaged as a zip package and can be downloaded from the following link (no need to copy and paste each)
4.1 ASD文件内容的自动提取 Automatic extraction of ASDdata contents
ASD文件经过处理后变为TXT文件后使用以下Matlab的脚本将其内容提取出来(这段已经函数化了,在后面会使用其函数,不需要手动操作)
After the ASD file is processed into TXT file, the following Matlab script will be used to extract its content.(This section has been functioned, the function will be used later, no manual operation is needed)
%读取asd输出的txt文件,首先需要将后缀修改成.csv

% clear all
% input=xlsread("D:\同步空间\试验\土壤试验\4-19\4-19asd.csv");
%%
function output=DealForASD_getData(input)
[num,~]=size(input);

rownum=0;%用于判断样本
column=1;%用于对应样本波段
for i=1:num%对所有的行遍历
    if input(i,2)==325
        rownum=rownum+1;
        column=1;
    end
    output(rownum,column)=input(i,3);
    column=column+1;
end
4.2 OTO文件内容的自动提取 Automatic extraction of OTO file contents
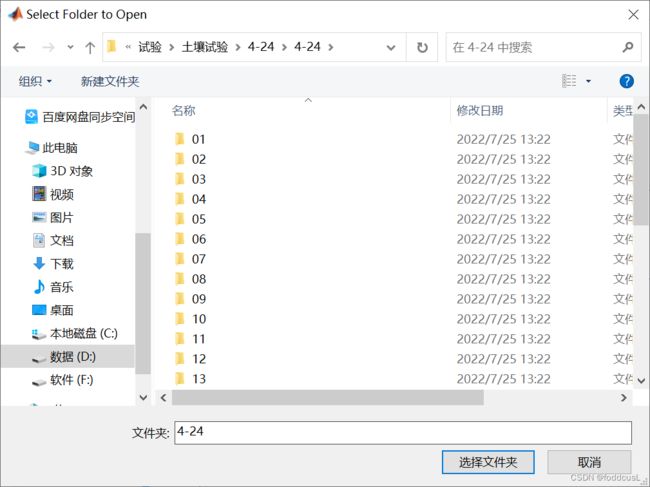
OTO文件夹群使用以下Matlab的脚本将其内容提取出来:joint_csv.m
The OTO folder group uses the following Matlab script to extract its contents:joint_csv.m
%author lijiayi FAFU
%用法:提取csv格式的数据
%输出:在脚本文件夹处输出当前日期为名的excel文件

clear all
range='A25:A137';%设置截取表格范围
endrow=137;%表格结束的行
startrow=25;%表格开始的行
orinPath=pwd;
srcDir=uigetdir('Choose source directory.'); %获得选择的文件夹
cd(srcDir);%%更改根路径
files = dir(fullfile(srcDir));%检测是否有二级文件夹
folder_nums = size(files,1);
include={'1.csv','2.csv','3.csv'};%目标的文件夹名称
a=[];b=[];c=[];
%%
for j=1:folder_nums-2
    names=getfield(files(j+2),'name');
    newfile=[srcDir,'\',names]%组成新文件夹的名称
    cd(newfile);
    allnames=struct2cell(dir('*.csv')); %获取目标文件的类型
    [k,len]=size(allnames); %获得bmp文件的个数

    anser=ismember(allnames(1,:),include);%判断文件是否为目标
    for ii=1:len
        %逐次取出文件
        name=allnames{1,ii};
        if anser(ii)
            a1=xlsread(name);
            disp(name);
            for q=1:endrow-startrow+1%对应设置
                a(1,q)=a1(startrow-1+q,2);
            end
            if(size(a)==0)
                disp('error')
                disp(ii)
                break
            end
            b=[b;a];
            clear a;
        end
    end
end
cd(orinPath);
nameSave=date;
writematrix(b,strcat(date,'.xlsx'));
执行该脚本后之后选中所在文件夹路径
After executing the script, select the folder path
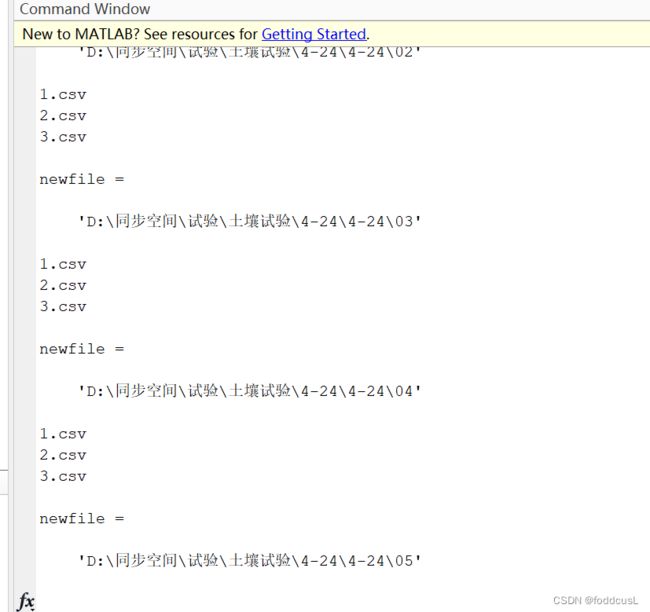
执行中command window会跳出目前的处理进展
The Command Window will jump out of the current processing progress
执行完后输出的xlsx文件(没有表头和序号,列为光谱参数,不同行不同样本)
XLSX file output after execution (no header and serial number, column is the spectrum parameters, different rows are different samples)
4.3 文件的合并与计算 Data merging and calculation
将OtO的数据提取出来后,就需要求平均值并将这两段光谱拼接在一起。使用以下脚本:script_Combine.m
Once the OtO data is extracted, an average is required and the two spectra are concatenated together. Use the following script:
%将asd与oto的数据自动整合
clear all
input=xlsread("D:\同步空间\试验\土壤试验\土壤含水率校准数据库\6\ASD_6.CSV");%asd.csv文件,没有表头和标识
otoData=xlsread("D:\同步空间\试验\土壤试验\土壤含水率校准数据库\6\6_oto.xlsx");%oto文件,没标识没有表头

%%异常样本标识与顺序重组
order=0;
%xlsread("D:\同步空间\试验\土壤试验\4-19\4-19顺序.xlsx");%顺序文件,不需要对顺序进行调整或数据剔除时,如果order为0,
repnum=3;%单个样本重复次数

%%其他数据引用(一般为所需要的预测值),这些数据按样本顺序排好
waterinput=xlsread("D:\同步空间\试验\土壤试验\土壤含水率校准数据库\6\water6");%含水率文件,需要表头
saltinput=xlsread("D:\同步空间\试验\土壤试验\土壤含水率校准数据库\最终电导率.xlsx");%含盐量文件,需要表头
%
otoData=otoData*0.01;%转为百分号单位
%%
input=DealForASD_getData(input);
%input=input(2:end,:);
%otoData=otoData(2:end,:);
if order~=0%由于OtO数据本身就会按顺序提取,所以只需要对ASD数据进行排序
    orderData=ReOrder(input,order,repnum,1);%重新排序,并且如果有某一标号的样本数据缺失,将其删除
else
    orderData=input;
end
%%
%在文件右侧依次添加其他数据,有多少格外数据添加多少次
otoData=addPara(otoData,waterinput,repnum);
otoData=addPara(otoData,saltinput,repnum);

allData=Combine_asd_oto(otoData,orderData);%alldata为原始未平均的数据,有需要可以自己复制到excel中保存
output=averageF(allData,repnum);%求平均后的数据;1:751 is the VNIR; 752:end is NIR only

%拼接与插值:ASD取325:1000; OTO取1000-1700
NirData=interV(averageF(otoData(:,8:end-2),repnum));
LData=[output(:,1:675),NirData];
%ordNum=325:1:1700;
%LData=[ordNum;LData];
LData=[LData,output(:,end-2,end)];%平均拼接插值平滑后的输出,这一行为添加标签数据;最后光谱范围为325:1700;只有1000-1700的平滑了
其中要求我们输入的变量
input:ASD的CSV文件;
otoData:我们以及从oto提取出来的文件;
order:顺序文件(格式如下显示)
其他数据:案例中为waterinput、saltinput;
Input: CSV file of ASD;
OtoData: we and the files extracted from OTO;
Order: order file (format shown below)
Other data: WaterInput, Saltinput in this case;
顺序文件结构图示:仅需一列,从上到下为你样本的检测顺序
Sequential FILE STRUCTURE diagram: Just one column, from top to bottom, shows the detection order of your samples
最终:得到处理好的试验数据Finally: get processed test data
以上脚本包地址:可见近红外ASDOTO光谱数据拼接整理脚本整合包-机器学习文档类资源-CSDN文库

