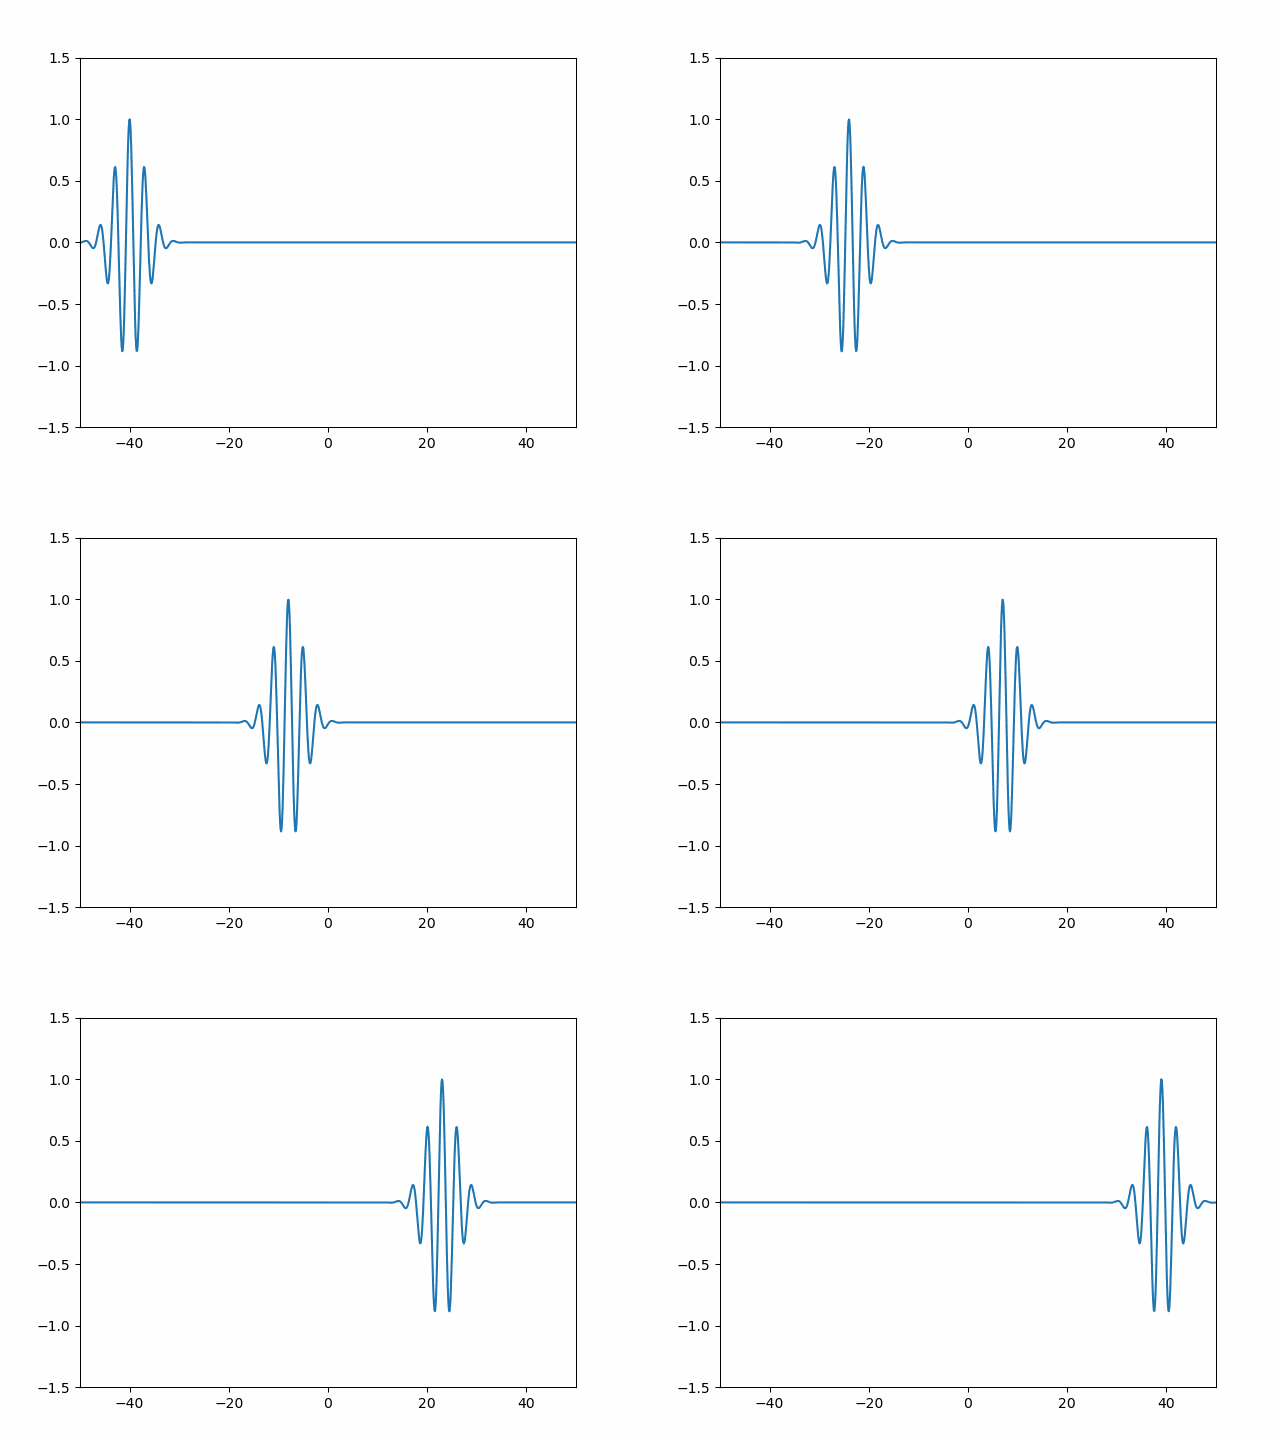
python绘制动图
利用matplotlib.animation中的ArtistAnimation方法
import numpy as np
import matplotlib.pyplot as plt
import matplotlib.animation as ma

t = np.linspace(-50, 50, 1000, endpoint=True)
fig, (ax1, ax2) = plt.subplots(ncols=1, nrows=2)
ax1.set_xlim(-50, 50)
ax1.set_ylim(-1.5, 1.5)
ax2.set_xlim(-50, 50)
ax2.set_ylim(-1.5, 1.5)
ims = []
ims1 = []
for b in np.arange(-40000, 40000, 10000):
    for a in np.arange(1, 10):
        phi = np.exp(2 * np.pi * (t - b / 1000)/a * 1j) * np.exp(-((t - b / 1000)/a) ** 2 / 2)
        im = ax1.plot(t, phi.real, color='k')  # 散点图用ax1.plot(t, phi.real, color='k').findobj()
        im1 = ax2.plot(t, phi.imag, color='k')
        ims.append(im)
        ims1.append(im1)

ani = ma.ArtistAnimation(fig, ims, interval=100, repeat=True)
ani1 = ma.ArtistAnimation(fig, ims1, interval=100, repeat=True)
ani.save('morlet1.gif')
ani1.save('morlet1.gif')
plt.show()
利用matplotlib.animation中的FuncAnimation
import numpy as np
import matplotlib.pyplot as plt
import matplotlib.animation as ma

t = np.linspace(-50, 50, 1000, endpoint=True)
fig, ax = plt.subplots()
ax.set_xlim(-50,50)
ax.set_ylim(-1.5,1.5)
line, = ax.plot([], [])
point = [[],[]]
def update(b):
    phi = np.exp(2 * np.pi * 1 * (t - (100 * b - 4000) / 100) / 3 * 1j) * np.exp(
        -((t - (100 * b - 4000) / 100) / 3) ** 2 / 2)
    phi = phi.real
    xdata = t
    ydata = phi
    point = [xdata, ydata]
    line.set_data(*point)
    return [line]

ani = ma.FuncAnimation(fig, update, frames=80, repeat=False, interval=100)
ani.save('wt.gif')
plt.show()

这种方式感觉只能改变一个参数,而且得通过line_set_data把数据加进去
两种方法都可以实现动图,但第一种方法速度较慢,该方法是将plot画在一个im里面,然后在通过ArtistAnimation函数显示出来,所以这种方法较为灵活,而第二种方法使用update(n)函数去更新,其中的n是frames=n这个n,取值是0-n,所以想实现一个参数不变而另一个参数改变,目前通过这种方法没查到好的方法。
如果只是想显示一下,不保存这种简单的方式也可以
import numpy as np
import matplotlib.pyplot as plt


fig, ax = plt.subplots()
ax.set_xlim(-50,50)
ax.set_ylim(-1.5,1.5)
t = np.linspace(-50, 50, 1000,endpoint=True)

for b in np.arange(-40000, 40000, 10000):
    for a in np.arange(1, 10):
        phi = np.exp(2 * np.pi * (t - b / 1000)/a * 1j) * np.exp(-((t - b / 1000)/a) ** 2 / 2)
        plt.ion()
        plt.cla()
        plt.plot(t, phi.real)
        plt.pause(0.0001)
绘制多ax
import numpy as np
import matplotlib.pyplot as plt
import matplotlib.animation as ma

t = np.linspace(-50, 50, 1000, endpoint=True)
fig, (ax, ax1) = plt.subplots(nrows=2, ncols=1)  # 这里如要定义多个ax,则需要给定行和列,不然会报错
line, = ax.plot([], [])
line1, = ax1.plot([], [])


def init():
    ax.set_xlim(-50, 50)
    ax.set_ylim(-1.5, 1.5)
    ax1.set_xlim(-50, 50)
    ax1.set_ylim(-1.5, 1.5)


def update(b):
    phi = np.exp(2 * np.pi * 1 * (t - (100 * b - 4000) / 100) / 3 * 1j) * np.exp(
        -((t - (100 * b - 4000) / 100) / 3) ** 2 / 2)
    phi1 = phi.real
    phi2 = phi.imag
    line.set_data(t,phi1)
    line1.set_data(t,phi2)
    return line,line1


ani = ma.FuncAnimation(fig, update, frames=80, init_func= init, repeat=True, interval=100)
ani.save('wt.gif', writer='ffmpeg')
plt.show()
同一个ax显示两幅图,多数据点显示类似
import numpy as np
import matplotlib.pyplot as plt
import matplotlib.animation as ma

t = np.linspace(-50, 50, 1000, endpoint=True)
fig, ax1 = plt.subplots()
# line = ax.plot([], [], 'k', [], [], 'r')
line1, = ax1.plot([], [], 'k') # 此处line后面一定加逗号
line2, = ax1.plot([], [], 'r')


def init():
    ax1.set_xlim(-50, 50)
    ax1.set_ylim(-1.5, 1.5)
    return line1,line2


def update(b):
    phi = np.exp(2 * np.pi * 1 * (t - (100 * b - 4000) / 100) / 3 * 1j) * np.exp(
        -((t - (100 * b - 4000) / 100) / 3) ** 2 / 2)
    phi1 = phi.real
    phi2 = phi.imag
    line1.set_data(t,phi1)
    line2.set_data(t,phi2)
    return line1, line2


ani = ma.FuncAnimation(fig, update, frames=80, init_func= init, repeat=True, interval=100)
ani.save('wt1.gif')
plt.show()
import numpy as np
import matplotlib.pyplot as plt
import matplotlib.animation as ma

t = np.linspace(-50, 50, 1000, endpoint=True)
fig, ax1 = plt.subplots()
line = ax1.plot([], [], 'k', [], [], 'r') #此处直接定义line2D,line后面不用加逗号


def init():
    ax1.set_xlim(-50, 50)
    ax1.set_ylim(-1.5, 1.5)
    return line


def update(b):
    phi = np.exp(2 * np.pi * 1 * (t - (100 * b - 4000) / 100) / 3 * 1j) * np.exp(
        -((t - (100 * b - 4000) / 100) / 3) ** 2 / 2)
    phi1 = phi.real
    phi2 = phi.imag
    line[0].set_data(t,phi1)
    line[1].set_data(t,phi2)
    return line


ani = ma.FuncAnimation(fig, update, frames=80, init_func= init, repeat=True, interval=100)
ani.save('wt1.gif')
plt.show()
用FuncAnimation完美实现多参数改变并保存
import numpy as np
import matplotlib.pyplot as plt
import matplotlib.animation as ma

t = np.arange(-50,50,0.01)
fig, (ax1, ax2) = plt.subplots(nrows=2, ncols=1)
line1, = ax1.plot([], [], color='k')
line2, = ax2.plot([], [], color='k')
ax1.set_xlim(min(t), max(t))
ax1.set_ylim(-1.5, 1.5)
ax2.set_xlim(min(t), max(t))
ax2.set_ylim(-1.5, 1.5)


y1 = []
y2 = []
for time in np.arange(-40,40,1):
    for scale in np.arange(1,10):
        phi = np.exp(2 * np.pi * 1 * (t - time) / scale * 1j) * np.exp(
            -((t - time) /  scale) ** 2 / 2)
        phi = np.array(phi)
        y1.append(phi.real)
        y2.append(phi.imag)

def update(frame):
    line1.set_data(t, y1[frame])
    line2.set_data(t, y2[frame])
    return line1,line2


ani = ma.FuncAnimation(fig, update, frames=len(y1), interval=50, repeat=False)
ani.save('perc.tif')
plt.show()


