TL; DR: (TL;DR:)
I made an LSTM neural network model that uses 30+ years of weather and streamflow data to quite accurately predict what the streamflow will be tomorrow.
我制作了一个LSTM神经网络模型,该模型使用30多年的天气和流量数据来非常准确地预测明天的流量。
河流预报问题 (The problem with river forecasts)
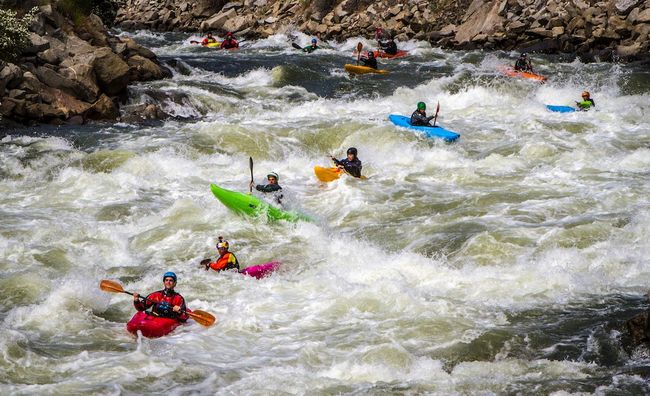
Water meets Idaho granite. Will Stauffer-Norris 水遇见爱达荷州花岗岩。 Sta威尔·斯塔弗·诺里斯The main reason I practice data science is to apply it to real-world problems. As a kayaker, I have spent many, many hours poring over weather forecasts, hydrologic forecasts, and SNOTEL station data to make a prediction about a river’s flow. There are good places out there that make this prediction- NOAA runs prediction centers throughout each major river basin in the country, including the South Fork.
我实践数据科学的主要原因是将其应用于实际问题。 作为皮划艇运动员,我花了许多小时研究天气预报,水文预报和SNOTEL站数据,以便对河流的流量做出预测。 有很多地方可以进行此预测-NOAA在全国每个主要流域( 包括南福克)都设有预测中心。
But these forecasts often fall short. In particular, I’ve noticed that the forecasts are susceptible to major rain events (flashy rivers in the Pacific Northwest are notoriously hard to predict), and the forecasts are typically only put out once or twice per day, which is often not frequent enough to react to rapidly changing mountain weather forecasts. NOAA also only gives forecasts on a select group of rivers. If you want a forecast for a smaller or more remote drainage, even if it’s gauged, you’re out of luck.
但是,这些预测往往达不到目标。 特别是,我注意到预报很容易受到重大降雨事件的影响(众所周知,太平洋西北部的山河泛滥很难预报),而且预报通常每天仅发布一次或两次,而发布频率往往不够频繁对快速变化的山区天气预报做出React。 NOAA也仅对部分河流进行预报。 如果您希望得到一个更小或更远的排水量的预测,即使它是经过计量的,那么您就没有运气了。
So I’m setting out to create a model that will meet or exceed NOAA’s forecasts, and build models for some drainages that are not covered by NOAA.
因此,我着手创建一个将达到或超过NOAA预测的模型,并为NOAA并未涵盖的某些排水系统建立模型。
To start out, I’m benchmarking my model against an industry-standard model created by Upstream Tech.
首先,我将根据Upstream Tech创建的行业标准模型对我的模型进行基准测试。
The South Fork Payette is a great place to start, for several reasons:
出于以下几个原因,South Fork Payette是一个不错的起点:
- The South Fork above Lowman is undammed, so the confounding variables of reservoirs are avoided. Lowman上方的South Fork不受限制,因此避免了储层的混杂变量。
- The USGS operates a gauge on the South Fork, NOAA has weather stations and a river forecast, and there are SNOTEL sites in the basin. There is a lot of easily accessible data to start with. 美国地质调查局在南叉上设有一个测距仪,美国国家海洋和大气管理局有气象站和河流预报,流域内还有SNOTEL站点。 首先有很多易于访问的数据。
- I used to teach kayaking on the Payette and I’ve paddled almost every section of the river system, so I know the region and its hydrology well! 我曾经在Payette上教皮划艇,并且几乎在河系的每个区域都划过桨,所以我非常了解该地区及其水文学!
数据 (The data)
The Upstream Tech model I’m benchmarking against uses meteorological as well as remote sensing data to build the model. I haven’t incorporated any satellite imagery yet, although this is the next development in my model.
我作为基准的上游技术模型使用气象数据和遥感数据来构建模型。 尽管这是我模型中的下一个开发项目,但我还没有合并任何卫星图像。
To start, I downloaded daily meteorological data from NOAA from a weather station on Banner Summit, which is at the headwaters of the South Fork. Eventually, I will incorporate more stations into my forecast, but I wanted to keep it simple for this first iteration. The metrics measured are:
首先,我从南叉源头的Banner峰顶的气象站下载了NOAA的每日气象数据 。 最终,我会将更多的台站合并到我的预测中,但是我希望在第一次迭代中保持简单。 衡量的指标是:
- Precipitation 沉淀
- Temperature (min and max) 温度(最小和最大)
- Snow Depth 雪深
- Snow Water Equivalent 雪水当量
- Day of Year. 一年中的一天。
These are my predictive features. The data go back to 1987.
这些是我的预测功能。 数据可以追溯到1987年。
Next, I went to the USGS gauge at Lowman, Idaho, and grabbed the daily discharge for every day since 1987. In a more refined model, I might get hourly data, but I decided daily was good enough for this iteration.
接下来,我去了爱达荷州Lowman的USGS量规 ,并获取了自1987年以来每天的每日排放量。在一个更精细的模型中,我可能会获得每小时的数据,但是我认为每天足以进行此迭代。
Discharge in CFS at the South Fork Payette at Lowman, 1987–2020 1987–2020年在劳曼南叉支付站的CFS排放 Rocky Mountain rivers are used for recreation as well as hydropower and irrigation. Will Stauffer-Norris 落基山河被用于娱乐以及水力发电和灌溉。 Sta威尔·斯塔弗·诺里斯争吵 (Wrangling)
I merged the two datasets using pandas, creating a dataframe with features and a target variable (discharge).
我使用熊猫合并了两个数据集,创建了一个具有特征和目标变量(排放)的数据框。
There were a few missing values in the meteorological data, so I imputed some values to replace the NaNs. I created a correlation matrix to see if any values were correlated and could be dropped. I decided to get rid of the average temperature reading, as there were already min and max temperature features.
气象数据中缺少一些值,因此我估算了一些值来代替NaN。 我创建了一个相关矩阵,以查看是否有任何相关的值可以删除。 我决定摆脱平均温度读数,因为已经有最低和最高温度功能。
With the data cleaned up, it was time to start modeling.
清理数据后,就该开始建模了。
该模型 (The model)
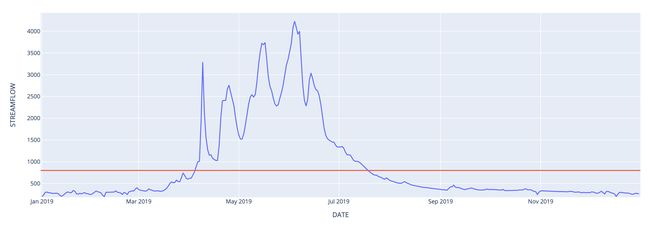
I started with just a baseline- what would happen if you just guessed the average discharge — about 800 CFS — of the South Fork every time? It turns out that the average error is about 600 CFS. This is unacceptably large, as it’s almost the flow of the river itself!
我仅以基线作为起点,如果您仅每次猜测南叉的平均排放量(约800 CFS),将会发生什么? 事实证明,平均误差约为600 CFS。 这太大了,几乎是河水的流量!
I knew I could do better- a lot better.
我知道我可以做得更好-更好。
The red line is the baseline prediction of about 800 CFS. Period is the year 2019. 红线是大约800 CFS的基线预测。 期间为2019年。线性回归 (Linear regression)
Linear regressions are very simple, but not a bad place to start getting my hands dirty. I used one, then two, then all the features to see how well they would predict the flow of the South Fork. The answer is- pretty badly.
线性回归非常简单,但是开始弄脏我的手并不是一个坏地方。 我使用了一个,然后是两个,然后是所有功能,以查看它们对南叉流量的预测情况。 答案很糟糕。
A single feature linear regression based on the “Day of year” feature is just a sloped line that resets each year. Not too useful. 基于“一年中的某天”功能的单个功能线性回归只是每年重置一次的斜线。 不太有用。随机森林 (Random forest)
OK, so linear regressions aren’t known to be the most powerful machine learning models out there. Time to bring out some more complicated stuff. I put all the features in a random forest model. I could have spent longer tweaking the hyperparameters, but I decided to just use the stock scikit-learn settings, with the exception of using 100 estimators.
好的,因此,线性回归并不是最强大的机器学习模型。 是时候推出一些更复杂的东西了。 我将所有功能放入随机森林模型中。 我本可以花更长的时间来调整超参数,但是我决定只使用普通的scikit-learn设置,除了使用100个估计器。
The results were a striking improvement- the random forest didn’t quite capture the nuances of the runoff, but it did track the general seasonal trend much better than a linear regression.
结果是一个了不起的改进-随机森林并未完全捕获径流的细微差别,但它确实比线性回归更好地跟踪了整个季节趋势。
A random forest model- getting closer to a decent prediction! 随机森林模型-越来越接近体面的预测! The Sawtooth Mountains, headwaters of the South Fork Payette. Will Stauffer-Norris 锯齿山,南叉帕耶特的源头。 Sta威尔·斯塔弗·诺里斯LSTM神经网络 (LSTM neural network)
Now time for the newest, biggest and baddest model- the neural network. LSTM neural networks can be useful for time series prediction, although they have some limitations. I used the Keras LSTM model.
现在该是最新,最大和最糟糕的模型了-神经网络。 LSTM神经网络尽管有一些局限性,但对时间序列预测很有用。 我使用Keras LSTM模型。
The model has some quirks- you must wrangle data in a very specific way to make it fit- and I found a few tutorials that were invaluable (the Keras documentation and Machine Learning Mastery).
该模型有一些古怪之处-您必须以非常特定的方式纠缠数据以使其适合-我发现了一些非常有价值的教程( Keras文档和Machine Learning Mastery )。
I trained the model on the period 1987–2015 and evaluated it on the years 2016–2020. In later iterations, I will look more into better validation techniques for time series data, such as nested cross-validation.
我在1987-2015年期间对模型进行了训练,并在2016-2020年期间对其进行了评估。 在以后的迭代中,我将更多地研究时间序列数据的更好的验证技术,例如嵌套交叉验证。
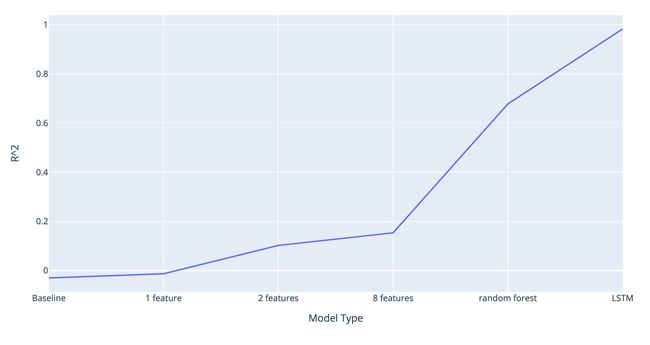
Eventually, I managed to get a model that had a 98% R² value and a mean absolute error of only ~50 cfs! This is head and shoulders better than the other (quite simple) models I tried.
最终,我设法得到一个模型,该模型的R²值为98%,平均绝对误差仅为〜50 cfs! 这比我尝试过的其他(非常简单)模型更好。
My model performance over time. The LSTM is a clear winner! 我的模型随着时间的推移表现。 LSTM无疑是赢家!The craziest part is that I haven’t even incorporated any other weather stations or remote sensing data into the neural network.
最疯狂的部分是,我什至没有将任何其他气象站或遥感数据纳入神经网络。
I suspect that the previous day’s flow is contributing most to the prediction because the predicted peaks seem to lag the actual peaks by about a day.
我怀疑前一天的流量对预测有最大贡献,因为预测的峰值似乎比实际峰值滞后了大约一天。
I’d like to do more investigation into how exactly the LSTM is coming up with the prediction, and visualize the feature importances.
我想对LSTM到底是如何准确地做出预测进行更多调查,并可视化功能的重要性。
My LSTM model for the 2019 spring runoff (lead time one day). 我的LSTM模型用于2019年Spring径流(提前期一天)。 Like the Idaho backcountry, there is always something more to explore with machine learning. Will Stauffer-Norris 像爱达荷州的偏远地区一样,机器学习总是有更多值得探索的地方。 Sta威尔·斯塔弗·诺里斯下一步 (Next steps)
Although my model performed decently well a day in advance, I’d like to model the flow in a longer forecast range (2–10 days out). I’ve started doing this with the LSTM, but I need to spend some more time on it.
尽管我的模型提前一天表现不错,但我想在更长的预测范围(2-10天)内对流量进行建模。 我已经开始使用LSTM进行此操作,但是我需要花更多的时间在它上面。
I also want to incorporate more weather stations. NOAA operates several more stations in the area, and it will be quite interesting to see how the position of the station in the watershed changes the prediction.
我还想合并更多的气象站。 NOAA在该地区经营着另外几个气象站,看到流域中气象站的位置如何改变预测将非常有趣。
I also want to incorporate satellite imagery as a feature. This is quite a bit more complicated, due to the large file sizes and acquiring the images in the first place. I’ve started building a pipeline to ingest Google Earth Engine data into my machine learning models.
我也想将卫星图像作为一项功能。 由于文件很大并且首先要获取图像,因此这要复杂得多。 我已经开始建立管道,以将Google Earth Engine数据吸收到我的机器学习模型中。
Finally, looking at the model, it’s able to predict very well the down-legs of the hydrograph- but so can I, just intuitively. The model is less able to predict abrupt upswings due to rapid snowmelt or a rain event. These are the kinds of events where prediction is critically important for hydropower, flood control, and public safety.
最后,查看模型,它可以很好地预测水文曲线的下肢,但我可以凭直觉就可以预测。 该模型无法预测由于快速融雪或下雨事件而导致的突然上升。 在这些事件中,预测对于水电,防洪和公共安全至关重要。
As always, there is more work to do!
与往常一样,还有更多工作要做!
Thanks for reading, and stay tuned for Part 2, where I will go through some of these next steps, especially incorporating satellite imagery.
感谢您的阅读,并继续关注第2部分,在该部分中,我将继续进行一些后续步骤,尤其是合并卫星图像。
You can view the notebooks I used on Github here.
您可以在这里查看我在Github上使用过的笔记本。
翻译自: https://towardsdatascience.com/predicting-the-flow-of-the-south-fork-payette-river-using-an-lstm-neural-network-65292eadf6a6


