机器学习-聚类算法
机器学习-基础知识
机器学习-线性回归
机器学习-逻辑回归
机器学习-聚类算法
机器学习-决策树算法
机器学习-集成算法
机器学习-SVM算法
文章目录
-
- 聚类算法
-
- 1. K-Means算法
-
- 1.1. 理论基础
- 1.2. 具体代码
-
- 1.2.1. 数据集
- 1.2.2. 自定义k-means算法类
- 1.2.3. 测试模块
- 1.3. 效果展示
-
- 1.3.1. 有标签和无标签数据集
- 1.3.2. 无标签与训练结果对比
- 2. DBSCAN算法
-
- 2.1. 理论基础
- 3. 聚类算法实践
-
- 3.1. Kmeans
- 3.2. 决策边界
- 3.3. 算法流程
- 3.4. 不稳定的结果
- 3.5. 评估方法
- 3.6. 找到最佳簇数
- 3.7. 轮廓系数
- 3.8. Kmeans存在的问题
- 3.9. 图像分割小例子
- 3.10. 半监督学习
- 3.11. DBSCAN算法
聚类算法
1. K-Means算法
1.1. 理论基础
-
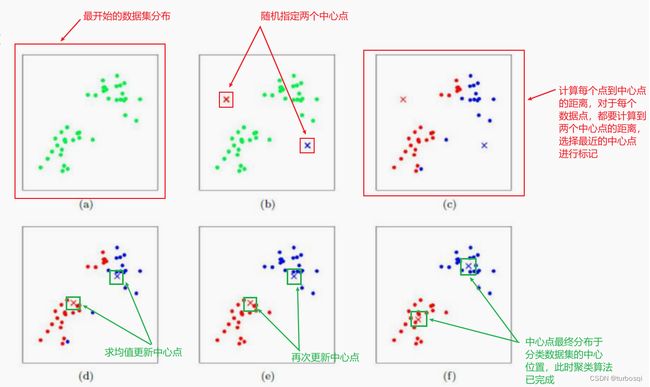
k-means算法是聚类算法的一种,属于无监督学习算法,训练样本的标记信息是未知的,目标是通过对无标记样本的学习来揭示数据的内在性质和规律,为进一步数据分析提供基础。 -
核心步骤有两点:
- 距离的计算;
- 中心点的更新。
-
基本概念:
-
簇:就是分类的数量,需要指定;
-
质心:均值,就是向量各维取平均;
-
距离的度量:常用欧几里得距离和余弦相似度;
-
优化目标:
E = ∑ i = 1 k ∑ x ϵ C i ∣ ∣ x − μ i ∣ ∣ 2 2 E= \sum_{i=1}^{k}\sum_{x\epsilon C_i}{||x-\mu_i||}_2^2 E=i=1∑kxϵCi∑∣∣x−μi∣∣22
-
-
优点:
简单,快速,适合常规数据集 。
-
缺点:
K值难确定;- 复杂度与样本呈线性关系;
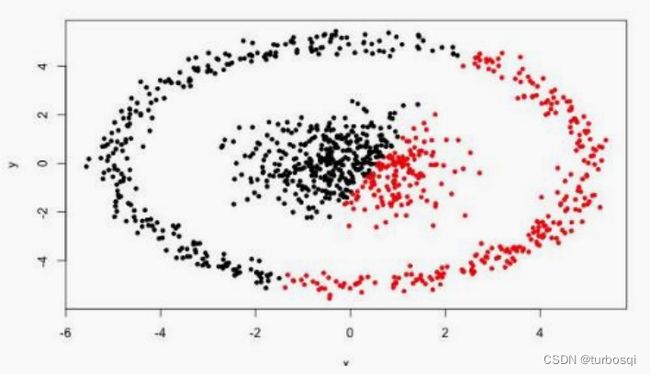
- 很难发现任意形状的簇。
1.2. 具体代码
1.2.1. 数据集
(iris.csv)
sepal_length,sepal_width,petal_length,petal_width,class
5.1,3.5,1.4,0.2,SETOSA
4.9,3.0,1.4,0.2,SETOSA
4.7,3.2,1.3,0.2,SETOSA
4.6,3.1,1.5,0.2,SETOSA
5.0,3.6,1.4,0.2,SETOSA
5.4,3.9,1.7,0.4,SETOSA
4.6,3.4,1.4,0.3,SETOSA
5.0,3.4,1.5,0.2,SETOSA
4.4,2.9,1.4,0.2,SETOSA
4.9,3.1,1.5,0.1,SETOSA
5.4,3.7,1.5,0.2,SETOSA
4.8,3.4,1.6,0.2,SETOSA
4.8,3.0,1.4,0.1,SETOSA
4.3,3.0,1.1,0.1,SETOSA
5.8,4.0,1.2,0.2,SETOSA
5.7,4.4,1.5,0.4,SETOSA
5.4,3.9,1.3,0.4,SETOSA
5.1,3.5,1.4,0.3,SETOSA
5.7,3.8,1.7,0.3,SETOSA
5.1,3.8,1.5,0.3,SETOSA
5.4,3.4,1.7,0.2,SETOSA
5.1,3.7,1.5,0.4,SETOSA
4.6,3.6,1.0,0.2,SETOSA
5.1,3.3,1.7,0.5,SETOSA
4.8,3.4,1.9,0.2,SETOSA
5.0,3.0,1.6,0.2,SETOSA
5.0,3.4,1.6,0.4,SETOSA
5.2,3.5,1.5,0.2,SETOSA
5.2,3.4,1.4,0.2,SETOSA
4.7,3.2,1.6,0.2,SETOSA
4.8,3.1,1.6,0.2,SETOSA
5.4,3.4,1.5,0.4,SETOSA
5.2,4.1,1.5,0.1,SETOSA
5.5,4.2,1.4,0.2,SETOSA
4.9,3.1,1.5,0.1,SETOSA
5.0,3.2,1.2,0.2,SETOSA
5.5,3.5,1.3,0.2,SETOSA
4.9,3.1,1.5,0.1,SETOSA
4.4,3.0,1.3,0.2,SETOSA
5.1,3.4,1.5,0.2,SETOSA
5.0,3.5,1.3,0.3,SETOSA
4.5,2.3,1.3,0.3,SETOSA
4.4,3.2,1.3,0.2,SETOSA
5.0,3.5,1.6,0.6,SETOSA
5.1,3.8,1.9,0.4,SETOSA
4.8,3.0,1.4,0.3,SETOSA
5.1,3.8,1.6,0.2,SETOSA
4.6,3.2,1.4,0.2,SETOSA
5.3,3.7,1.5,0.2,SETOSA
5.0,3.3,1.4,0.2,SETOSA
7.0,3.2,4.7,1.4,VERSICOLOR
6.4,3.2,4.5,1.5,VERSICOLOR
6.9,3.1,4.9,1.5,VERSICOLOR
5.5,2.3,4.0,1.3,VERSICOLOR
6.5,2.8,4.6,1.5,VERSICOLOR
5.7,2.8,4.5,1.3,VERSICOLOR
6.3,3.3,4.7,1.6,VERSICOLOR
4.9,2.4,3.3,1.0,VERSICOLOR
6.6,2.9,4.6,1.3,VERSICOLOR
5.2,2.7,3.9,1.4,VERSICOLOR
5.0,2.0,3.5,1.0,VERSICOLOR
5.9,3.0,4.2,1.5,VERSICOLOR
6.0,2.2,4.0,1.0,VERSICOLOR
6.1,2.9,4.7,1.4,VERSICOLOR
5.6,2.9,3.6,1.3,VERSICOLOR
6.7,3.1,4.4,1.4,VERSICOLOR
5.6,3.0,4.5,1.5,VERSICOLOR
5.8,2.7,4.1,1.0,VERSICOLOR
6.2,2.2,4.5,1.5,VERSICOLOR
5.6,2.5,3.9,1.1,VERSICOLOR
5.9,3.2,4.8,1.8,VERSICOLOR
6.1,2.8,4.0,1.3,VERSICOLOR
6.3,2.5,4.9,1.5,VERSICOLOR
6.1,2.8,4.7,1.2,VERSICOLOR
6.4,2.9,4.3,1.3,VERSICOLOR
6.6,3.0,4.4,1.4,VERSICOLOR
6.8,2.8,4.8,1.4,VERSICOLOR
6.7,3.0,5.0,1.7,VERSICOLOR
6.0,2.9,4.5,1.5,VERSICOLOR
5.7,2.6,3.5,1.0,VERSICOLOR
5.5,2.4,3.8,1.1,VERSICOLOR
5.5,2.4,3.7,1.0,VERSICOLOR
5.8,2.7,3.9,1.2,VERSICOLOR
6.0,2.7,5.1,1.6,VERSICOLOR
5.4,3.0,4.5,1.5,VERSICOLOR
6.0,3.4,4.5,1.6,VERSICOLOR
6.7,3.1,4.7,1.5,VERSICOLOR
6.3,2.3,4.4,1.3,VERSICOLOR
5.6,3.0,4.1,1.3,VERSICOLOR
5.5,2.5,4.0,1.3,VERSICOLOR
5.5,2.6,4.4,1.2,VERSICOLOR
6.1,3.0,4.6,1.4,VERSICOLOR
5.8,2.6,4.0,1.2,VERSICOLOR
5.0,2.3,3.3,1.0,VERSICOLOR
5.6,2.7,4.2,1.3,VERSICOLOR
5.7,3.0,4.2,1.2,VERSICOLOR
5.7,2.9,4.2,1.3,VERSICOLOR
6.2,2.9,4.3,1.3,VERSICOLOR
5.1,2.5,3.0,1.1,VERSICOLOR
5.7,2.8,4.1,1.3,VERSICOLOR
6.3,3.3,6.0,2.5,VIRGINICA
5.8,2.7,5.1,1.9,VIRGINICA
7.1,3.0,5.9,2.1,VIRGINICA
6.3,2.9,5.6,1.8,VIRGINICA
6.5,3.0,5.8,2.2,VIRGINICA
7.6,3.0,6.6,2.1,VIRGINICA
4.9,2.5,4.5,1.7,VIRGINICA
7.3,2.9,6.3,1.8,VIRGINICA
6.7,2.5,5.8,1.8,VIRGINICA
7.2,3.6,6.1,2.5,VIRGINICA
6.5,3.2,5.1,2.0,VIRGINICA
6.4,2.7,5.3,1.9,VIRGINICA
6.8,3.0,5.5,2.1,VIRGINICA
5.7,2.5,5.0,2.0,VIRGINICA
5.8,2.8,5.1,2.4,VIRGINICA
6.4,3.2,5.3,2.3,VIRGINICA
6.5,3.0,5.5,1.8,VIRGINICA
7.7,3.8,6.7,2.2,VIRGINICA
7.7,2.6,6.9,2.3,VIRGINICA
6.0,2.2,5.0,1.5,VIRGINICA
6.9,3.2,5.7,2.3,VIRGINICA
5.6,2.8,4.9,2.0,VIRGINICA
7.7,2.8,6.7,2.0,VIRGINICA
6.3,2.7,4.9,1.8,VIRGINICA
6.7,3.3,5.7,2.1,VIRGINICA
7.2,3.2,6.0,1.8,VIRGINICA
6.2,2.8,4.8,1.8,VIRGINICA
6.1,3.0,4.9,1.8,VIRGINICA
6.4,2.8,5.6,2.1,VIRGINICA
7.2,3.0,5.8,1.6,VIRGINICA
7.4,2.8,6.1,1.9,VIRGINICA
7.9,3.8,6.4,2.0,VIRGINICA
6.4,2.8,5.6,2.2,VIRGINICA
6.3,2.8,5.1,1.5,VIRGINICA
6.1,2.6,5.6,1.4,VIRGINICA
7.7,3.0,6.1,2.3,VIRGINICA
6.3,3.4,5.6,2.4,VIRGINICA
6.4,3.1,5.5,1.8,VIRGINICA
6.0,3.0,4.8,1.8,VIRGINICA
6.9,3.1,5.4,2.1,VIRGINICA
6.7,3.1,5.6,2.4,VIRGINICA
6.9,3.1,5.1,2.3,VIRGINICA
5.8,2.7,5.1,1.9,VIRGINICA
6.8,3.2,5.9,2.3,VIRGINICA
6.7,3.3,5.7,2.5,VIRGINICA
6.7,3.0,5.2,2.3,VIRGINICA
6.3,2.5,5.0,1.9,VIRGINICA
6.5,3.0,5.2,2.0,VIRGINICA
6.2,3.4,5.4,2.3,VIRGINICA
5.9,3.0,5.1,1.8,VIRGINICA
1.2.2. 自定义k-means算法类
def train(self,max_iterations):训练函数,用来训练数据集;def centroids_init(data,num_culsters):中心点初始化,随机生成位置不确定的中心点;def centroids_find_closest(data,centroids):计算距离,计算每个数据点到所有中心点的最短距离;def centroids_compute(data,closest_centroids_ids,num_clustres):进行中心点的更新。
import numpy as np

class KMeans:
    def __init__(self,data,num_clusters):
        self.data = data
        # 聚成的类别
        self.num_clusters = num_clusters

    def train(self,max_iterations):
        """训练函数"""
        # 1.先随机选择k个中心点
        centroids = KMeans.centroids_init(self.data,self.num_clusters)
        # 2.开始训练
        num_examples = self.data.shape[0]
        # 最近的中心点
        closest_centroids_ids = np.empty((num_examples,1))
        for _ in range(max_iterations):
            # 3.得到当前每一个样本点到K个中心点的距离,找最近的(核心1:计算距离)
            closest_centroids_ids = self.centroids_find_closest(self.data,centroids)
            # 4.进行中心点位置更新(核心2:质心更新)
            centroids = self.centroids_compute(self.data,closest_centroids_ids,self.num_clusters)
        return centroids,closest_centroids_ids


    @staticmethod
    def centroids_init(data,num_culsters):
        """中心点初始化"""
        # 获取样本总数
        num_examples = data.shape[0]
        # 洗牌操作
        random_ids = np.random.permutation(num_examples)
        # 取出所有的中心点
        centroids = data[random_ids[:num_culsters],:]
        return centroids

    @staticmethod
    def centroids_find_closest(data,centroids):
        """计算距离"""
        # 获取样本数量
        num_examples = data.shape[0]
        # 获取中心点数量
        num_centroids = centroids.shape[0]
        closest_centroids_ids = np.zeros((num_examples,1))
        # 每一个样本点都要计算与所有簇的距离,然后返回最近的那个簇
        for example_index in range(num_examples):
            distance = np.zeros((num_centroids,1))
            for centroid_index in range(num_centroids):
                distance_diff = data[example_index,:] - centroids[centroid_index,:]
                # 对数据进行平方操作
                distance[centroid_index] = np.sum(distance_diff**2)
            # 找最近的聚类
            closest_centroids_ids[example_index] = np.argmin(distance)
        return closest_centroids_ids

    @staticmethod
    def centroids_compute(data,closest_centroids_ids,num_clustres):
        """质心更新"""
        num_features = data.shape[1]
        # 先填充质心点(矩阵)
        centroids = np.zeros((num_clustres,num_features))
        # 每一个类别都需要计算
        for centroid_id in range(num_clustres):
            # 找到属于当前类别的点
            closest_ids = (closest_centroids_ids == centroid_id)
            centroids[centroid_id] = np.mean(data[closest_ids.flatten(),:],axis = 0)
        return centroids
1.2.3. 测试模块
import pandas as pd
import matplotlib.pyplot as plt

from K_Means import KMeans

data = pd.read_csv('../data/iris.csv')
iris_types = ['SETOSA','VERSICOLOR','VIRGINICA']
# 两个特征,一个是花萼长度,一个是花萼宽度
x1_axis = 'petal_length'
x2_axis = 'petal_width'

# 原始数据图展示
plt.figure(figsize=(12,5))
plt.subplot(121)
# 分类别展示
for iris_type in iris_types:
    # 区分类别显示: [data['class'] == iris_type]
    plt.scatter(data[x1_axis][data['class'] == iris_type],
                data[x2_axis][data['class'] == iris_type],
                label = iris_type)
plt.title('label known')
plt.legend()
plt.subplot(122)
# 不区分类别显示: [:]
plt.scatter(data[x1_axis][:], data[x2_axis][:])
plt.title('label unknown')
plt.show()

# 选取两个特征进行展示
num_examples = data.shape[0]
x_train = data[[x1_axis, x2_axis]].values.reshape(num_examples, 2)

# 指定好训练所需的参数
num_clusters = 3
max_iteritions = 50

# 构建聚类算法
k_means = KMeans(x_train,num_clusters)
centroids,closest_centroids_ids = k_means.train(max_iteritions)

# 对比结果
plt.figure(figsize=(12,5))
plt.subplot(121)
for iris_type in iris_types:
    plt.scatter(data[x1_axis][data['class'] == iris_type],
                data[x2_axis][data['class'] == iris_type],
                label=iris_type)
plt.title('label known')
plt.legend()
plt.subplot(122)
for centroids_id,centroid in enumerate(centroids):
    # 当前样本索引
    current_examples_index = (closest_centroids_ids == centroids_id).flatten()
    plt.scatter(data[x1_axis][current_examples_index],
                data[x2_axis][current_examples_index],
                label=centroids_id)

for centroids_id,centroid in enumerate(centroids):
    plt.scatter(centroid[0],centroid[1],c='red',marker='X')
plt.legend()
plt.title('label kmeans')
plt.show()
1.3. 效果展示
1.3.1. 有标签和无标签数据集
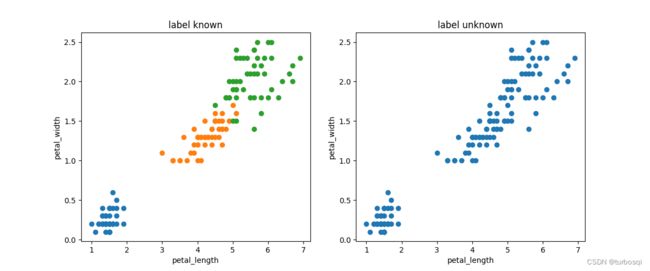
左图为有标签的数据集展示,右图是无标签的数据集展示,K-means算法是无监督的学习,没有类别标记,所以训练时不能指定标签,也就是右图所示的数据形式。
1.3.2. 无标签与训练结果对比
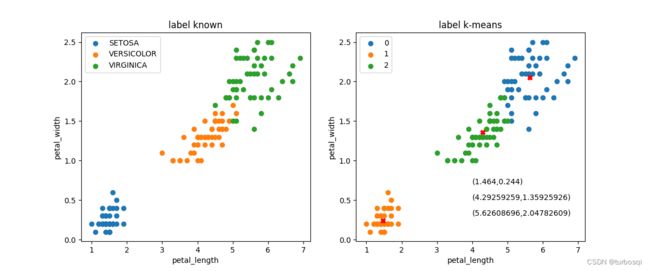
左图为有标签的数据集,右图是经过k-means算法训练之后的结果演示,类别为3类,中心叉号代表每个类别的质心点。
2. DBSCAN算法
2.1. 理论基础
-
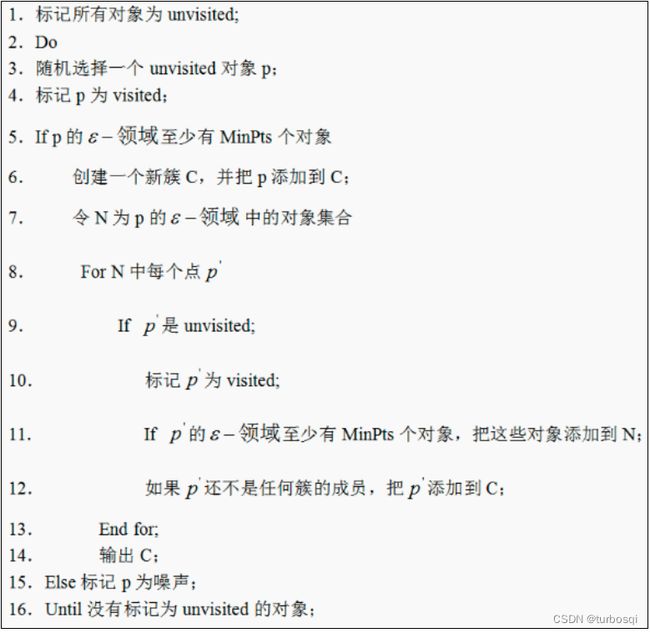
核心对象:若某个点的密度达到算法设定的阈值则其为核心点(即 r 邻域内点的数量不小于 minPts)。
-
ϵ-邻域的距离阈值:设定的半径r 。
-
直接密度可达:若某点p在点q的 r 邻域内,且q是核心点,则p-q直接密度可达。
-
密度可达:若有一个点的序列q0、q1、…qk,对任意qi-qi-1是直接密度可达的 ,则称从q0到qk密度可达,这实际上是直接密度可达的传播。
-
密度相连:若从某核心点p出发,点q和点k都是密度可达的 ,则称点q和点k是密度相连的。
-
边界点:属于某一个类的非核心点,不能发展下线了。
-
直接密度可达:若某点p在点q的 r 邻域内,且q是核心点则p-q直接密度可达。
-
优点:
- 不需要指定簇个数;
- 可以发现任意形状的簇;
- 擅长找到离群点(检测任务);
- 两个参数。
-
缺点:
- 高维数据有些困难(可以做降维) ;
- 参数难以选择(参数对结果的影响非常大);
- Sklearn中效率很慢(数据削减策略)。
3. 聚类算法实践
3.1. Kmeans
-
导包操作
导入numpy、matplotlib工具包,以及画图操作的相关参数设置,最后导入的包是防止环境出现警告。
import numpy as np
import os
%matplotlib inline
import matplotlib
import matplotlib.pyplot as plt

plt.rcParams['axes.labelsize'] = 14
plt.rcParams['xtick.labelsize'] = 12
plt.rcParams['ytick.labelsize'] = 12

import warnings
warnings.filterwarnings('ignore')
np.random.seed(42)
- 绘制中心点并设置发散程度
# 导入绘制类别的工具包
from sklearn.datasets import make_blobs

# 指定五个中心点
blob_centers = np.array(
[
    [0.2,2.3],
    [-1.5,2.3],
    [-2.8,1.8],
    [-2.8,2.8],
    [-2.8,1.3]
]
)

# 五个点对应的发散程度,应当设置的小一点
blob_std = np.array([0.4,0.3,0.1,0.1,0.1])
- 设置样本
# 参数n_samples:样本个数,centers:样本中心点,cluster_std:以中心点为圆心,向周围发散的程度
X,y = make_blobs(n_samples = 2000,centers=blob_centers,cluster_std=blob_std,random_state=7)
- 画图展示
def plot_clusters(X,y = None):
    plt.scatter(X[:,0],X[:,1],c=y,s=1)
    plt.xlabel("$x_1$",fontsize=14)
    plt.ylabel("$x_2$",fontsize=14,rotation=0)

plt.figure(figsize=(8,4))
# 无监督学习,传递参数的时候只传递X值
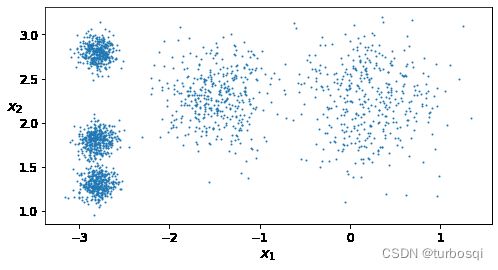
plot_clusters(X)
plt.show()
3.2. 决策边界
- 假定
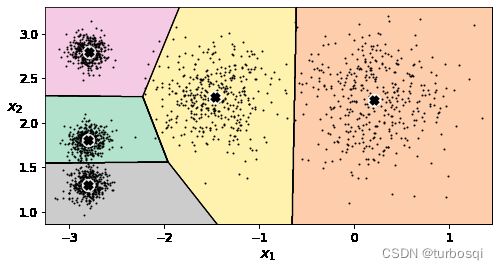
k=5进行分类
from sklearn.cluster import KMeans
k = 5
kmeans = KMeans(n_clusters = 5,random_state = 42)
# 计算聚类中心并预测每个样本的聚类索引
# fit_predict(X)与kmeans.labels_得到的结果是一致的
y_pred = kmeans.fit_predict(X)
- 画图展示
# 把当前的数据进行展示
def plot_data(X):
    plt.plot(X[:, 0], X[:, 1], 'k.', markersize=2)

# 绘制中心点
def plot_centroids(centroids, weights=None, circle_color='w', cross_color='k'):
    if weights is not None:
        centroids = centroids[weights > weights.max() / 10]
    plt.scatter(centroids[:, 0], centroids[:, 1],
                marker='o', s=30, linewidths=8,
                color=circle_color, zorder=10, alpha=0.9)
    plt.scatter(centroids[:, 0], centroids[:, 1],
                marker='x', s=50, linewidths=5,
                color=cross_color, zorder=11, alpha=1)

# 绘制等高线
def plot_decision_boundaries(clusterer, X, resolution=1000, show_centroids=True,
                             show_xlabels=True, show_ylabels=True):
    mins = X.min(axis=0) - 0.1
    maxs = X.max(axis=0) + 0.1
    # 棋盘操作
    xx, yy = np.meshgrid(np.linspace(mins[0], maxs[0], resolution),
                         np.linspace(mins[1], maxs[1], resolution))
    # 预测结果值          合成棋盘
    Z = clusterer.predict(np.c_[xx.ravel(), yy.ravel()])
    # 预测结果值与棋盘一致
    Z = Z.reshape(xx.shape)

    # 绘制等高线,并绘制区域颜色
    plt.contourf(Z, extent=(mins[0], maxs[0], mins[1], maxs[1]),
                cmap="Pastel2")
    plt.contour(Z, extent=(mins[0], maxs[0], mins[1], maxs[1]),
                linewidths=1, colors='k')
    plot_data(X)

    if show_centroids:
        plot_centroids(clusterer.cluster_centers_)

    if show_xlabels:
        plt.xlabel("$x_1$", fontsize=14)
    else:
        plt.tick_params(labelbottom='off')

    if show_ylabels:
        plt.ylabel("$x_2$", fontsize=14, rotation=0)
    else:
        plt.tick_params(labelleft='off')


# 调用函数开始绘图
plt.figure(figsize = (8,4))
plot_decision_boundaries(kmeans,X)
plt.show()
3.3. 算法流程
就是看程序每一步的优化结果。
- 设置优化步数
# max_iter设置1/2/3相当于三步
kmean_iter1 = KMeans(n_clusters=5,init='random',n_init=1,max_iter=1,random_state=1)
kmean_iter2 = KMeans(n_clusters=5,init='random',n_init=1,max_iter=2,random_state=1)
kmean_iter3 = KMeans(n_clusters=5,init='random',n_init=1,max_iter=3,random_state=1)

kmean_iter1.fit(X)
kmean_iter2.fit(X)
kmean_iter3.fit(X)
- 画图展示
plt.figure(figsize=(12,10))
plt.subplot(321)
# 绘制初始点
plot_data(X)
# 绘制中心点
plot_centroids(kmean_iter1.cluster_centers_, circle_color='r', cross_color='k')
plt.title('Update cluster_centers')

plt.subplot(322)
plot_decision_boundaries(kmean_iter1, X,show_xlabels=False, show_ylabels=False)
plt.title('Iter1')

plt.subplot(323)
plot_decision_boundaries(kmean_iter1, X,show_xlabels=False, show_ylabels=False)
plot_centroids(kmean_iter2.cluster_centers_,circle_color='r',cross_color='g')
plt.title('Change1')

plt.subplot(324)
plot_decision_boundaries(kmean_iter2, X,show_xlabels=False, show_ylabels=False)
plt.title('Iter2')

plt.subplot(325)
plot_decision_boundaries(kmean_iter2, X,show_xlabels=False, show_ylabels=False)
plot_centroids(kmean_iter3.cluster_centers_,circle_color='r',cross_color='g')
plt.title('Change2')

plt.subplot(326)
plot_decision_boundaries(kmean_iter3, X,show_xlabels=False, show_ylabels=False)
plt.title('Iter3')
-
效果展示
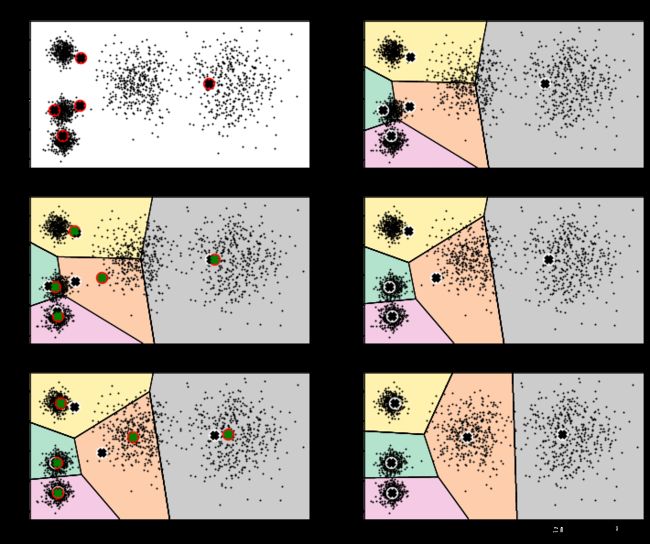
图1为最开始的数据和生成的随机点分布,图2开始进行第一次迭代,图3是进行第二次迭代的过程,其中,黑白点代表上一次中心点的位置,红绿点代表本次迭代后中心点的更新,图4是第二次迭代后的中心点的位置,图5和图6分别是第三次迭代过程和结果中心点的分布情况。
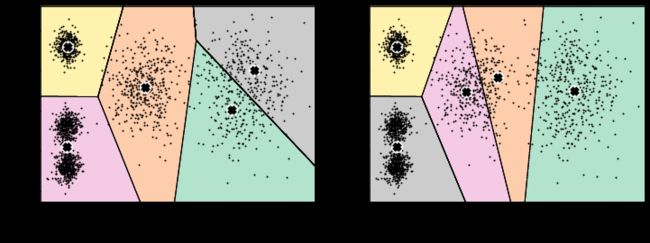
3.4. 不稳定的结果
- 画图展示
def plot_clusterer_comparison(c1,c2,X):
    c1.fit(X)
    c2.fit(X)

    plt.figure(figsize=(12,4))
    plt.subplot(121)
    plot_decision_boundaries(c1,X)
    plt.subplot(122)
    plot_decision_boundaries(c2,X)


# 创建对象,进行不同(质心初始化的随机数生成)结果对比
c1 = KMeans(n_clusters = 5,init='random',n_init = 1,random_state=11)
c2 = KMeans(n_clusters = 5,init='random',n_init = 1,random_state=19)
plot_clusterer_comparison(c1,c2,X)
3.5. 评估方法
Inertia指标:每个样本到它最近簇的距离的平方和然后求和。
kmeans.inertia_
## 211.5985372581684
X_dist = kmeans.transform(X)
# 找到每个样本到最近的簇的距离
X_dist[np.arange(len(X_dist)),kmeans.labels_]

np.sum(X_dist[np.arange(len(X_dist)),kmeans.labels_]**2)
## 211.59853725816868
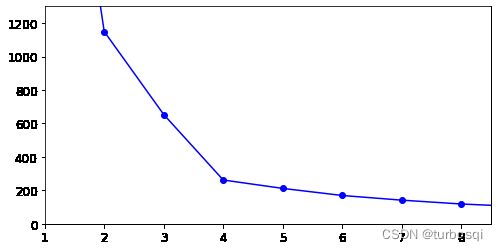
3.6. 找到最佳簇数
- 选择10次数据进行查找
kmeans_per_k = [KMeans(n_clusters = k).fit(X) for k in range(1,10)]
inertias = [model.inertia_ for model in kmeans_per_k]
- 画图展示
plt.figure(figsize=(8,4))
plt.plot(range(1,10),inertias,'bo-')
plt.axis([1,8.5,0,1300])
plt.show()
3.7. 轮廓系数
结论:
- s(i)接近1,则说明样本(i)聚类合理;
- s(i)接近-1,则说明样本(i)更应该分类到另外的簇;
- 若s(i) 近似为0,则说明样本(i)在两个簇的边界上。
- 计算所有样本的平均轮廓系数
from sklearn.metrics import silhouette_score
# 计算所有样本的平均轮廓系数
silhouette_score(X,kmeans.labels_)
- 计算所有轮廓系数
silhouette_scores = [silhouette_score(X,model.labels_) for model in kmeans_per_k[1:]]
- 画图展示
plt.figure(figsize=(8,4))
plt.plot(range(2,10),silhouette_scores,'bo-')
# plt.axis([1,8.5,0,1300])
plt.show()
-
效果展示
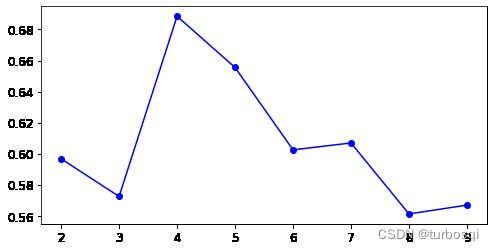
下图结论:此图是上面K-Means算法对应的轮廓系数图,轮廓系数应当越大越好,从图中可以看出,当簇的个数为4时,轮廓系数的值达到最大,从实验看出,簇的个数为5,总结得出衡量指标只是一种指标,不能作为唯一的衡量标准。
3.8. Kmeans存在的问题
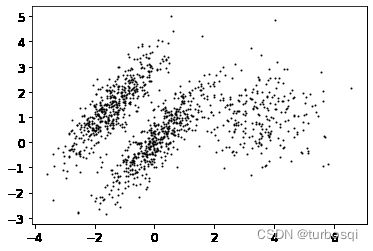
- 生成原始数据集
X1, y1 = make_blobs(n_samples=1000, centers=((4, -4), (0, 0)), random_state=42)
X1 = X1.dot(np.array([[0.374, 0.95], [0.732, 0.598]]))
X2, y2 = make_blobs(n_samples=250, centers=1, random_state=42)
X2 = X2 + [6, -8]
X = np.r_[X1, X2]
y = np.r_[y1, y2]

plot_data(X)
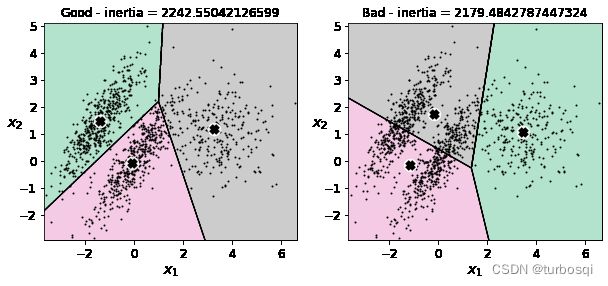
kmeans_good = KMeans(n_clusters = 3,init = np.array([[-1.5,2.5],[0.5,0],[4,0]]),n_init=1,random_state=42)
kmeans_bad = KMeans(n_clusters = 3,random_state=42)
kmeans_good.fit(X)
kmeans_bad.fit(X)
- 绘制图形
plt.figure(figsize=(10,4))
plt.subplot(121)
plot_decision_boundaries(kmeans_good,X)
# plt.title('Good - inertia = {}'.fotmat(kmeans_good.inertia_))

plt.subplot(122)
plot_decision_boundaries(kmeans_bad,X)
# plt.title('Bad - inertia = {}'.fotmat(kmeans_bad.inertia_))
3.9. 图像分割小例子
- 加载图片
# ladybug.png
from matplotlib.image import imread
image = imread('ladybug.png')
image.shape
- 重塑数据
X = image.reshape(-1,3)
- 进行训练
# 进行训练
kmeans = KMeans(n_clusters = 8,random_state=42).fit(X)

# 八个中心位置
# kmeans.cluster_centers_
- 把原始图像的像素数转化为特定的类别
# 通过标签找到对应的中心点,并且把数据还原成三维数据
segmented_img = kmeans.cluster_centers_[kmeans.labels_].reshape(533, 800, 3)
# 此时的图像当中只有八种不同的像素点
segmented_img
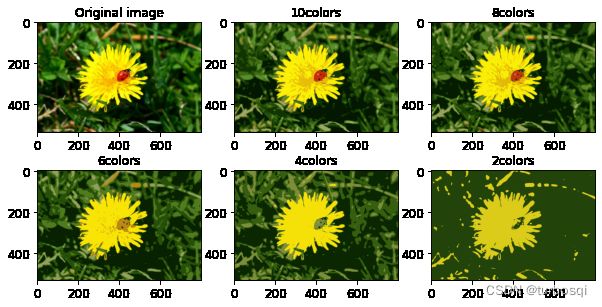
- 把原始数据分为不同的簇,以进行对比实验
segmented_imgs = []
n_colors = (10,8,6,4,2)
for n_clusters in n_colors:
    kmeans =  KMeans(n_clusters,random_state=42).fit(X)
    segmented_img = kmeans.cluster_centers_[kmeans.labels_]
    segmented_imgs.append(segmented_img.reshape(image.shape))
- 绘制图形
plt.figure(figsize = (10,5))
plt.subplot(231)
plt.imshow(image)
plt.title('Original image')

for idx,n_clusters in enumerate(n_colors):
    plt.subplot(232+idx)
    plt.imshow(segmented_imgs[idx])
    plt.title('{}colors'.format(n_clusters))
3.10. 半监督学习
-
加载数据集并对数据集进行拆分
首先,让我们将训练集聚类为50个集群,然后对于每个聚类,让我们找到最靠近质心的图像。 我们将这些图像称为代表性图像:
from sklearn.datasets import load_digits
# 加载并返回数字数据集(分类)
X_digits,y_digits = load_digits(return_X_y = True)

from sklearn.model_selection import train_test_split
# 将数组或矩阵切分为随机训练和测试子集
X_train,X_test,y_train,y_test = train_test_split(X_digits,y_digits,random_state=42)
- 进行训练
- 第一类:直接选择50个样本进行逻辑回归的计算
# 使用逻辑回归进行半监督学习
from sklearn.linear_model import LogisticRegression
n_labeled = 50

log_reg = LogisticRegression(random_state=42)
log_reg.fit(X_train[:n_labeled], y_train[:n_labeled])
log_reg.score(X_test, y_test)
结果:0.8266666666666667
- 第二类:用聚类算法找到距离簇中心最近的具有代表性的点,再进行逻辑回归的计算
# 对训练数据进行聚类
k = 50
kmeans = KMeans(n_clusters=k, random_state=42)
# 得到1347个样本到每个簇的距离
X_digits_dist = kmeans.fit_transform(X_train)

# 找簇中距离质心最近的点的索引
representative_digits_idx = np.argmin(X_digits_dist,axis=0)

# 把索引回传到训练样本中,找到当前的数据
X_representative_digits = X_train[representative_digits_idx]
现在让我们绘制这些代表性图像并手动标记它们:
# 画图并展示
plt.figure(figsize=(8, 2))
for index, X_representative_digit in enumerate(X_representative_digits):
    plt.subplot(k // 10, 10, index + 1)
    plt.imshow(X_representative_digit.reshape(8, 8), cmap="binary", interpolation="bilinear")
    plt.axis('off')

plt.show()
根据以上结果进行手动标记标签:
# 手动打标签
y_representative_digits = np.array([
    4, 8, 0, 6, 8, 3, 7, 7, 9, 2,
    5, 5, 8, 5, 2, 1, 2, 9, 6, 1,
    1, 6, 9, 0, 8, 3, 0, 7, 4, 1,
    6, 5, 2, 4, 1, 8, 6, 3, 9, 2,
    4, 2, 9, 4, 7, 6, 2, 3, 1, 1])
现在我们有一个只有50个标记实例的数据集,它们中的每一个都是其集群的代表性图像,而不是完全随机的实例,然后去训练:
log_reg = LogisticRegression(random_state=42)
log_reg.fit(X_representative_digits, y_representative_digits)
log_reg.score(X_test, y_test)
结果:0.92
- 第三类:将标签传播到同一群集中的所有其他实例,然后进行逻辑回归的计算
# 先做一个空的标签
y_train_propagated = np.empty(len(X_train), dtype=np.int32)
# 遍历打标签
for i in range(k):
    y_train_propagated[kmeans.labels_==i] = y_representative_digits[i]

log_reg = LogisticRegression(random_state=42)
log_reg.fit(X_train, y_train_propagated)

log_reg.score(X_test, y_test)
结果:0.9288888888888889
- 第四类:选择前20个来进行逻辑回归的计算
## 核心:簇 -> 索引 -> 样本
percentile_closest = 20

X_cluster_dist = X_digits_dist[np.arange(len(X_train)), kmeans.labels_]
for i in range(k):
    in_cluster = (kmeans.labels_ == i)
    # 选择属于当前簇的所有样本
    cluster_dist = X_cluster_dist[in_cluster]
    # 排序找到前20个
    cutoff_distance = np.percentile(cluster_dist, percentile_closest)
    # False True结果
    above_cutoff = (X_cluster_dist > cutoff_distance)
    X_cluster_dist[in_cluster & above_cutoff] = -1
# 找到索引
partially_propagated = (X_cluster_dist != -1)
# 回传到样本
X_train_partially_propagated = X_train[partially_propagated]
y_train_partially_propagated = y_train_propagated[partially_propagated]
# 进行训练
log_reg = LogisticRegression(random_state=42)
log_reg.fit(X_train_partially_propagated, y_train_partially_propagated)
log_reg.score(X_test, y_test)
结果:0.9444444444444444
3.11. DBSCAN算法
- 准备数据集
from sklearn.datasets import make_moons
X, y = make_moons(n_samples=1000, noise=0.05, random_state=42)
- 导包并进行对比实验
from sklearn.cluster import DBSCAN
# eps:半径值,min_samples:一个点被视为核心点的邻域内的样本数

# 进行对比实验
dbscan = DBSCAN(eps = 0.05,min_samples=5)
dbscan.fit(X)

dbscan2 = DBSCAN(eps = 0.2,min_samples=5)
dbscan2.fit(X)
- 绘制图形
def plot_dbscan(dbscan, X, size, show_xlabels=True, show_ylabels=True):
    core_mask = np.zeros_like(dbscan.labels_, dtype=bool)
    core_mask[dbscan.core_sample_indices_] = True
    anomalies_mask = dbscan.labels_ == -1
    non_core_mask = ~(core_mask | anomalies_mask)

    cores = dbscan.components_
    anomalies = X[anomalies_mask]
    non_cores = X[non_core_mask]

    plt.scatter(cores[:, 0], cores[:, 1],
                c=dbscan.labels_[core_mask], marker='o', s=size, cmap="Paired")
    plt.scatter(cores[:, 0], cores[:, 1], marker='*', s=20, c=dbscan.labels_[core_mask])
    plt.scatter(anomalies[:, 0], anomalies[:, 1],
                c="r", marker="x", s=100)
    plt.scatter(non_cores[:, 0], non_cores[:, 1], c=dbscan.labels_[non_core_mask], marker=".")
    if show_xlabels:
        plt.xlabel("$x_1$", fontsize=14)
    else:
        plt.tick_params(labelbottom='off')
    if show_ylabels:
        plt.ylabel("$x_2$", fontsize=14, rotation=0)
    else:
        plt.tick_params(labelleft='off')
    plt.title("eps={:.2f}, min_samples={}".format(dbscan.eps, dbscan.min_samples), fontsize=14)
plt.figure(figsize=(18, 4))

plt.subplot(131)
plt.plot(X[:,0],X[:,1],'b.')
plt.xlabel("$x_1$", fontsize=14)
plt.ylabel("$x_2$", fontsize=14,rotation=0)
plt.title("Original image")

plt.subplot(132)
plot_dbscan(dbscan, X, size=100)

plt.subplot(133)
plot_dbscan(dbscan2, X, size=600, show_ylabels=True)

plt.show()
